Managing office space efficiently is crucial for organizations aiming to optimize resources and improve workplace productivity. The Office Utilization Dashboard in Excel is a ready-to-use tool that helps organizations track office bookings, space usage, and occupancy rates. This dashboard allows you to visualize key data, monitor office space performance, and make informed decisions about resource allocation.
In this article, we will explain the key features of the Office Utilization Dashboard, how it works, and how you can use it to improve your office space management.
What is the Office Utilization Dashboard in Excel?
The Office Utilization Dashboard in Excel is a powerful template that helps businesses track and manage office space usage. It consolidates data on bookings, occupancy rates, and space availability into one centralized dashboard, providing you with a clear view of office space performance.
The dashboard includes multiple worksheets, charts, and slicers to allow easy tracking and analysis. This tool is ideal for businesses looking to optimize office space, reduce unused areas, and improve space planning.
Key Features of the Office Utilization Dashboard
The Office Utilization Dashboard consists of several key features, which are spread across multiple worksheets. These features allow businesses to track key metrics related to office space usage, bookings, and availability.
1. Overview Sheet Tab
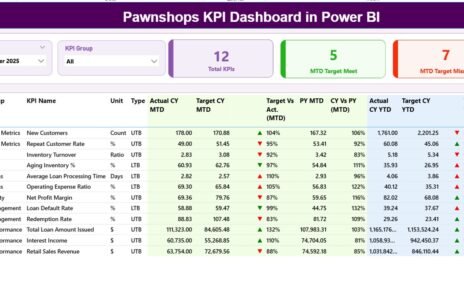
The Overview Sheet serves as the main hub for your office utilization data. It provides a high-level view of key metrics and visualizations.
Key Metrics Displayed on the Overview Sheet:
-
Total Bookings: The total number of bookings made for office spaces.
-
Average Booking Duration: The average length of time spaces are booked for.
-
Total Available: The total number of spaces available for booking.
-
Occupied: The number of spaces currently occupied.
-
Booked: The number of spaces that have been booked.
Charts on the Overview Sheet:
-
Utilization Rate (%): Displays the percentage of available space that is being used.
-
Usage Status Distribution: Shows the breakdown of spaces in terms of occupied, booked, or available.
-
Utilization Rate (%) by Department: Displays the space utilization rate by department.
-
Total Bookings by Location: Shows the number of bookings by different office locations.

Click to buy Office Utilization Dashboard in Excel
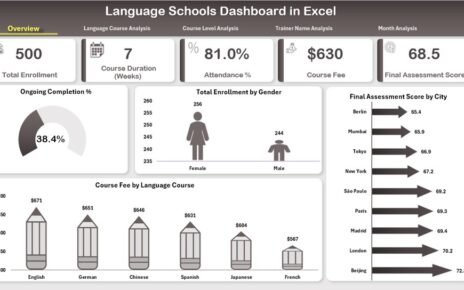
2. Space Usage Analysis Sheet Tab
The Space Usage Analysis Sheet allows you to dive deeper into the analysis of space utilization.
Charts on the Space Usage Analysis Sheet:
-
Total Bookings by Space Type: Shows the number of bookings for each space type (e.g., conference rooms, private offices).
-
Total Available by Space Type: Displays the number of available spaces for each space type.
-
Utilization Rate (%) by Space Type: Provides the utilization rate for each space type.
-
Average Booking Duration by Space Type: Shows the average booking duration for each space type.

3. Departmental Utilization Sheet Tab
The Departmental Utilization Sheet focuses on analyzing space usage within different departments.
Charts on the Departmental Utilization Sheet:
-
Total Bookings by Department: Displays the number of bookings made by each department.
-
Average Booking Duration by Department: Shows the average booking duration by department.
-
Total Available by Department: Indicates the number of spaces available for each department.
-
Occupied vs Booked by Department: Compares the number of occupied spaces to the number of booked spaces by department.

Click to buy Office Utilization Dashboard in Excel
4. Location Performance Sheet Tab
The Location Performance Sheet allows you to track how different office locations are performing in terms of space utilization.
Charts on the Location Performance Sheet:
-
Average Booking Duration by Location: Displays the average booking duration across various office locations.
-
Utilization Rate (%) by Location: Shows the utilization rate of office spaces by location.
-
Occupied vs Booked Location: Compares the number of occupied spaces to booked spaces across different locations.
-
Total Available by Location: Displays the total number of available spaces by location.

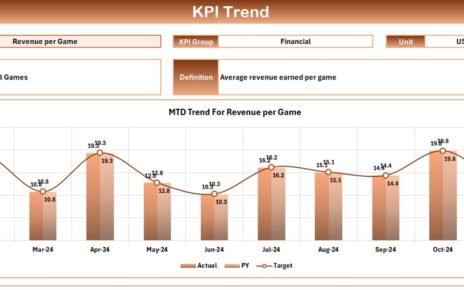
5. Time-Based Metrics Sheet Tab
The Time-Based Metrics Sheet focuses on analyzing trends over time.
Charts on the Time-Based Metrics Sheet:
-
Total Bookings by Month: Shows the number of bookings made each month.
-
Total Available by Month: Displays the number of available spaces each month.
-
Average Booking Duration by Month: Tracks the average booking duration over time.
-
Occupied vs Booked by Month: Compares the number of occupied spaces to booked spaces on a monthly basis.

Click to buy Office Utilization Dashboard in Excel
6. Data Sheet Tab
The Data Sheet Tab is the backend where you input all the necessary data for the dashboard to function. The following data points are captured here:

Benefits of Using the Office Utilization Dashboard
The Office Utilization Dashboard in Excel offers several benefits for businesses looking to optimize office space usage and improve resource planning.
- Efficient Space Management:Track the booking, availability, and utilization of office spaces efficiently to ensure optimal use of space.
- Data-Driven Decision Making:The dashboard provides a comprehensive analysis of space usage, helping you make data-driven decisions to improve space management.
- Improved Accountability:By tracking space usage across departments and locations, the dashboard helps ensure that space is being used efficiently and responsibly.
- Trend Analysis:Monitor trends over time, allowing you to identify patterns in space usage and make adjustments as needed.
Conclusion
Click to buy Office Utilization Dashboard in Excel
The Office Utilization Dashboard in Excel is a comprehensive tool for tracking, managing, and optimizing office space usage. By offering detailed charts, slicers, and data-driven insights, this dashboard helps businesses make informed decisions about space management, improve resource allocation, and increase overall efficiency.
Frequently Asked Questions (FAQs)
1. What KPIs are tracked in the Office Utilization Dashboard?
The dashboard tracks KPIs such as Utilization Rate, Booking Duration, Occupied vs Booked Spaces, and Space Availability.
2. Can I customize the dashboard for my specific needs?
Yes, the dashboard is customizable. You can add or remove KPIs, adjust formulas, and tailor it to suit your specific space management needs.
3. How do I update the data in the dashboard?
You can update the data by entering information into the Data Sheet Tab. The dashboard will automatically update based on the new data.
4. How often should I update the Office Utilization Dashboard?
You should update the dashboard regularly, especially when new bookings are made, or when space availability or occupancy statuses change.
Visit our YouTube channel to learn step-by-step video tutorials
Click to buy Office Utilization Dashboard in Excel