Efficient office space management is critical for modern organizations. With the increasing trend of hybrid work and flexible seating arrangements, understanding how office spaces are being utilized has become essential. The Office Utilization Dashboard in Power BI is a ready-to-use tool that allows managers, facilities teams, and HR departments to monitor office occupancy, track space usage trends, and optimize workplace efficiency.
This dashboard consolidates key metrics, visual analytics, and trends in an interactive Power BI environment, making data-driven decision-making seamless and effective.
Key Features of the Office Utilization Dashboard
The dashboard is designed with multiple pages, each providing insights into different aspects of office space utilization.
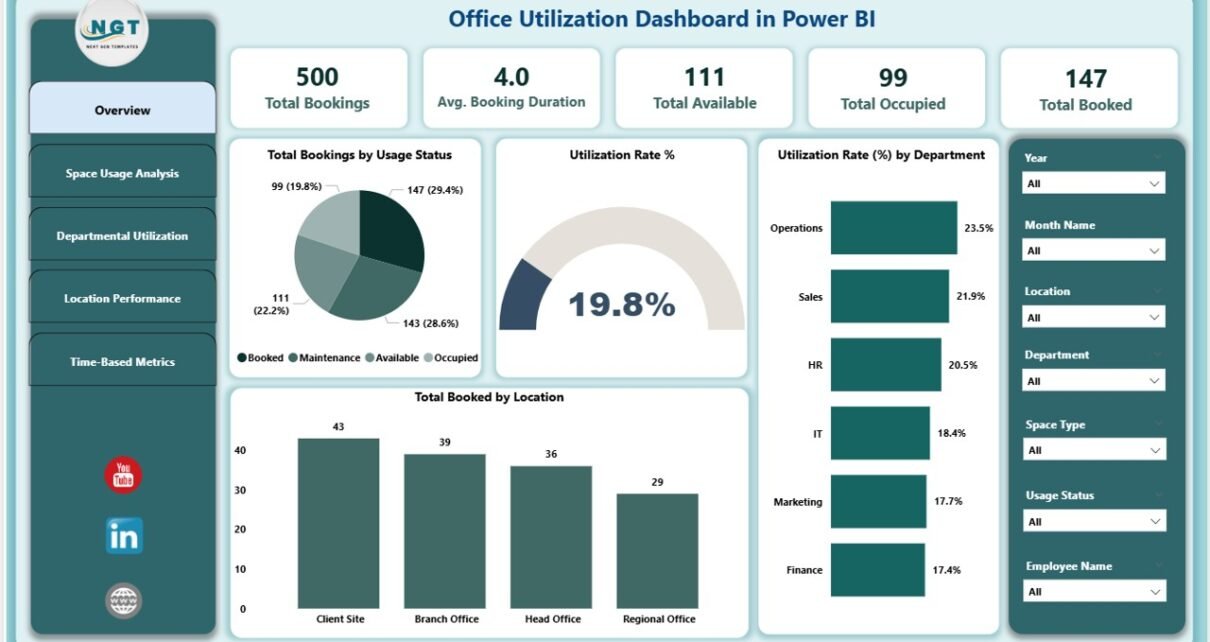
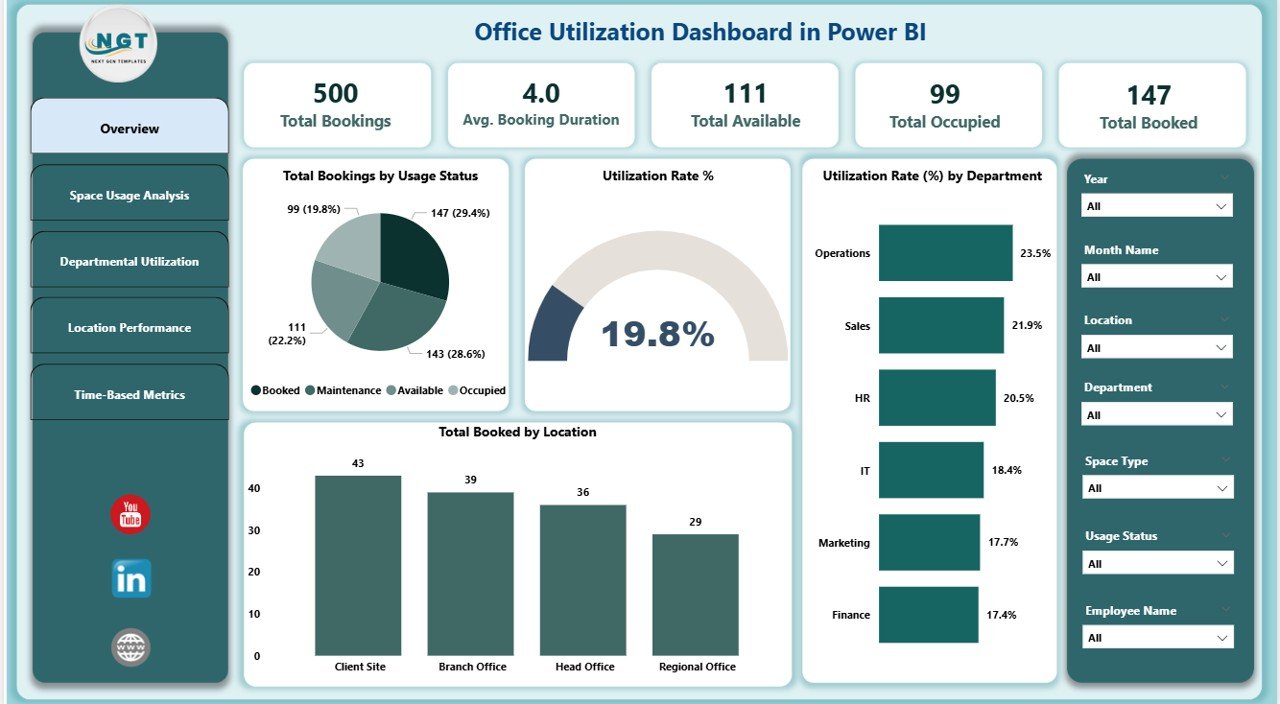
1. Overview Page
The Overview page provides a high-level summary of office utilization metrics.
Cards displayed:
-
Total Booking: Total number of bookings in the selected period.
-
Avg. Booking Duration: Average duration of all bookings.
-
Total Available: Total available office space.
-
Total Occupied: Total space currently occupied.
-
Total Booked: Total space booked by employees or teams.
Charts included:
-
Total Bookings by Usage Status: Visualize booked vs. available spaces.
-
Utilization Rate %: Overall space utilization percentage.
-
Utilization Rate (%) by Department: Department-wise usage rate for insight into departmental space efficiency.
-
Total Booked by Location: Compare space usage across different office locations.
This page provides a quick snapshot of office performance, enabling stakeholders to make immediate operational decisions.
Click to Buy Office Utilization Dashboard in Power BI
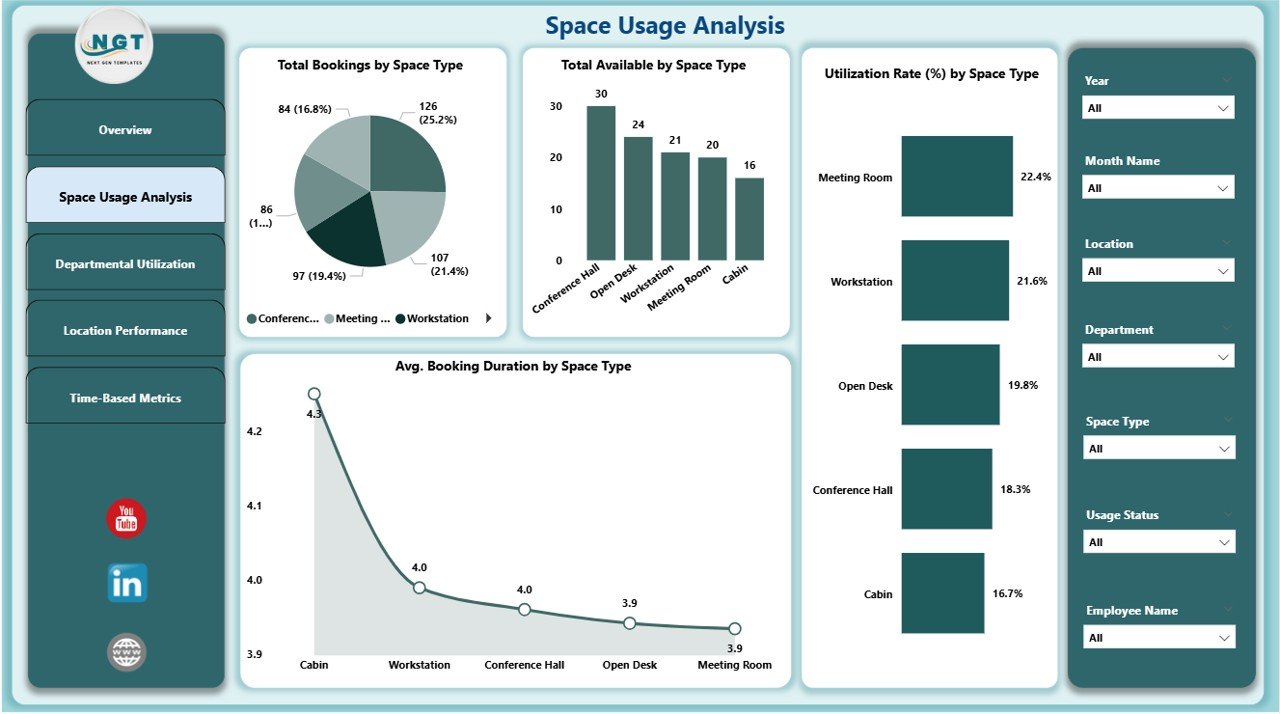
2. Space Usage Analysis Page
The Space Usage Analysis page provides deeper insight into the types of spaces being utilized.
Charts included:
-
Total Bookings by Space Type: Track bookings for conference rooms, workstations, meeting pods, or other space types.
-
Total Available by Space Type: Understand the distribution of available spaces by type.
-
Utilization Rate (%) by Space Type: Evaluate efficiency of space allocation.
-
Avg. Booking Duration by Space Type: Monitor how long each space type is being used on average.
This page allows facilities managers to optimize space allocation, identify underutilized areas, and plan for future office requirements.
Click to Buy Office Utilization Dashboard in Power BI
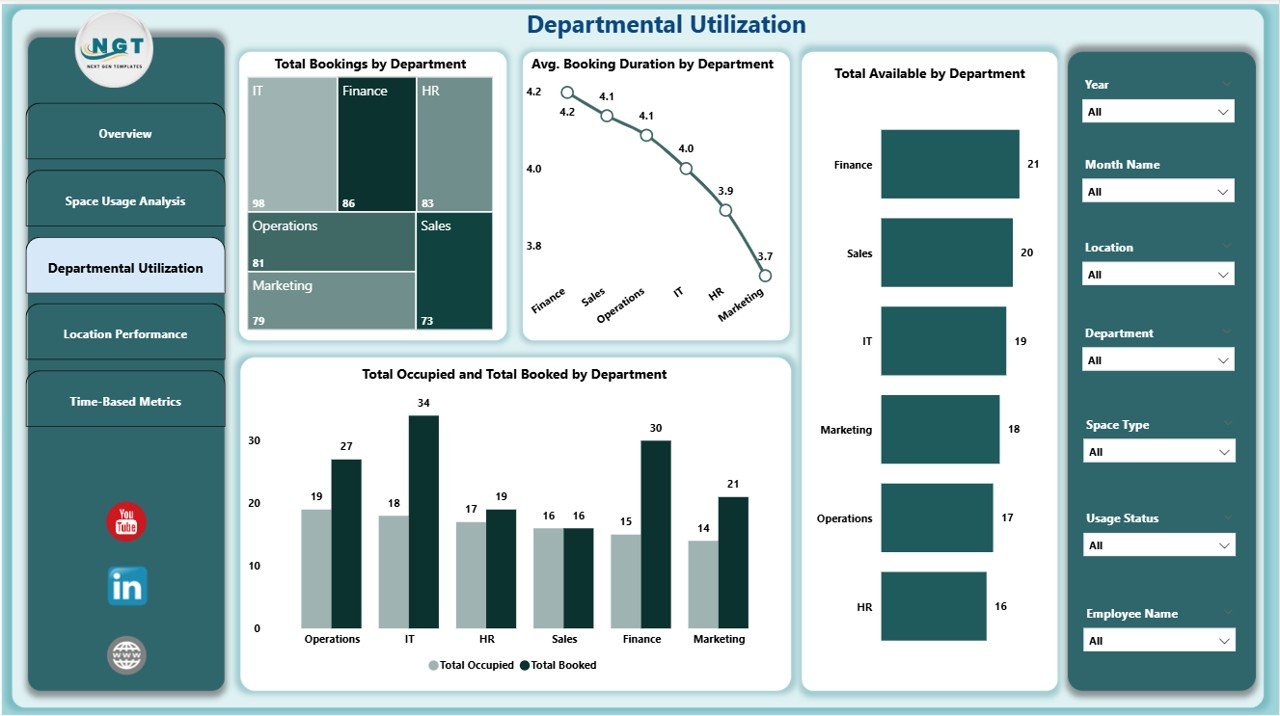
3. Departmental Uti
Departmental Utilization Page
lization Page
The Departmental Utilization page highlights how different departments use office space.
Charts included:
-
Total Bookings by Department: Track which teams are booking spaces most frequently.
-
Avg. Booking Duration by Department: Monitor time spent by each department in booked spaces.
-
Total Available by Department: Identify space allocation per department.
-
Total Occupied and Total Booked by Department: Compare allocated vs. actually used space by department.
This analysis ensures equitable space distribution and helps identify departments with high or low occupancy patterns.
Click to Buy Office Utilization Dashboard in Power BI
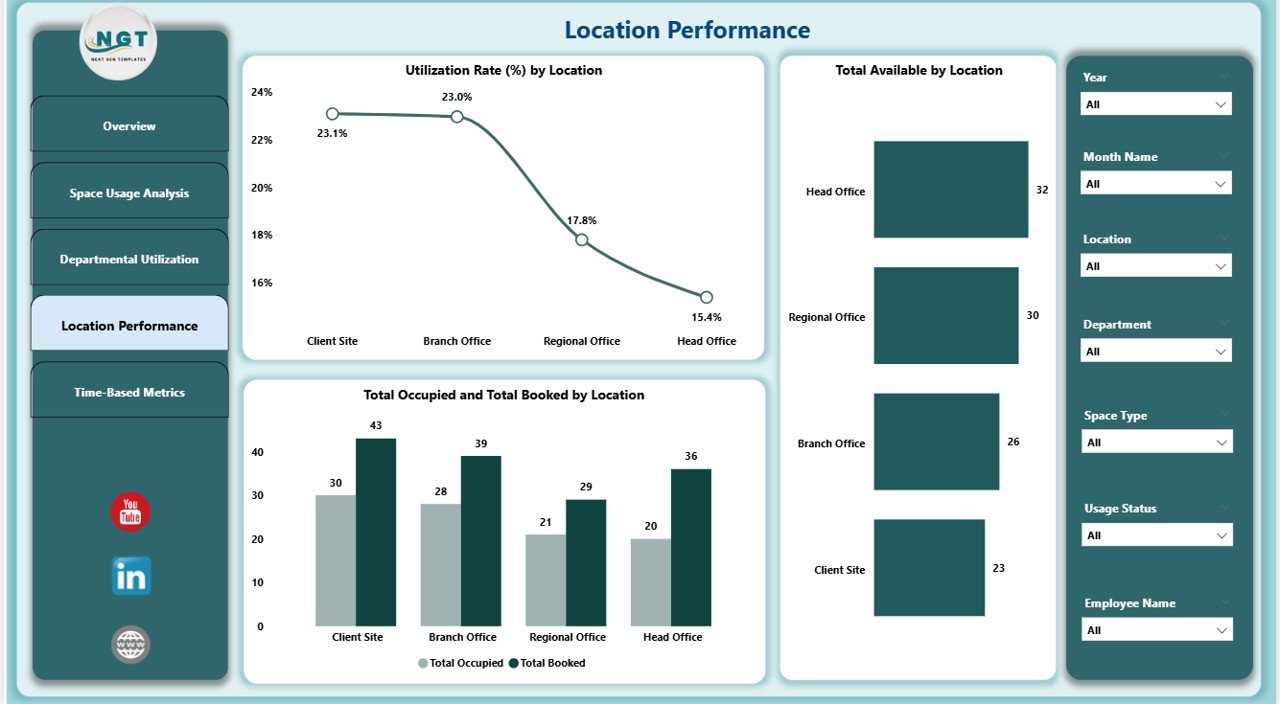
4. Location Performance Page
The Location Performance page focuses on comparing utilization across multiple office locations.
Charts included:
-
Utilization Rate (%) by Location: Identify top-performing locations and underutilized sites.
-
Total Available by Location: Compare total capacity across offices.
-
Total Booked by Location: Track booked spaces per location.
This page is ideal for organizations managing multiple offices, helping optimize space planning and cost allocation.
Click to Buy Office Utilization Dashboard in Power BI
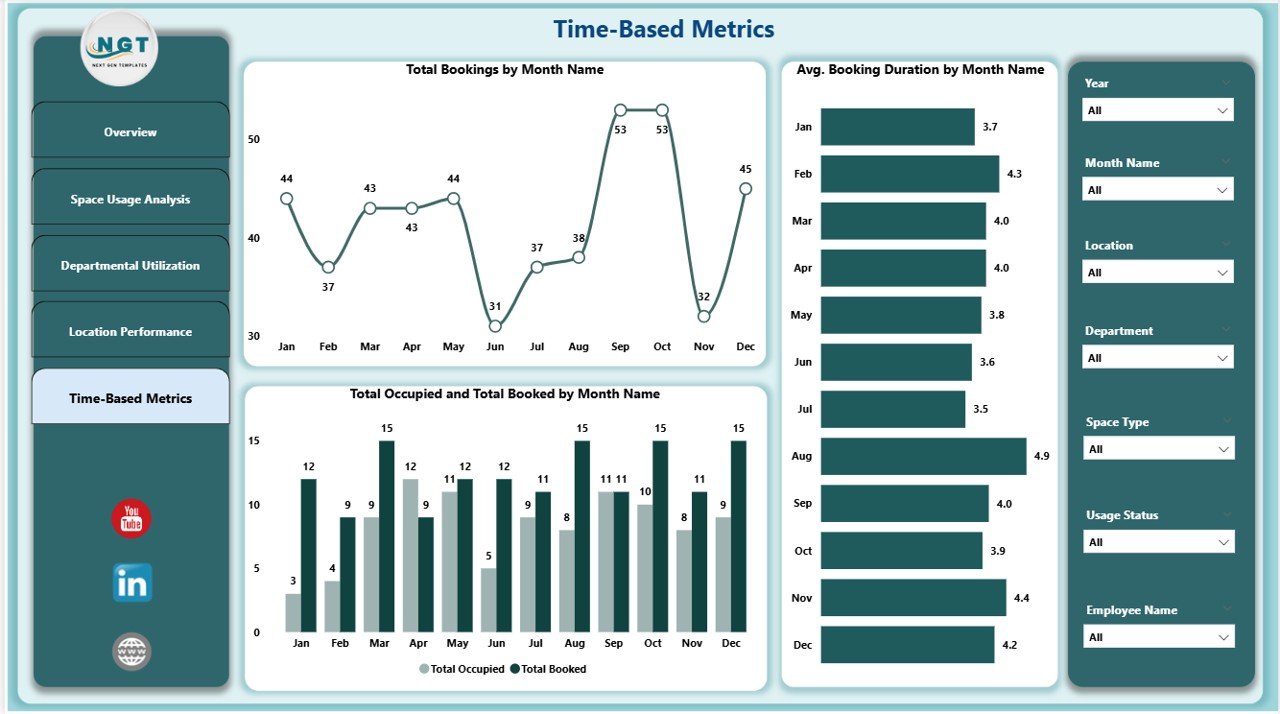
5. Time-Based Metrics Page
The Time-Based Metrics page provides a temporal view of office utilization trends.
Charts included:
-
Total Bookings by Month Name: Monthly trends for space usage.
-
Avg. Booking Duration by Month Name: Track how usage duration changes over time.
-
Total Occupied and Total Booked by Month Name: Monitor occupancy and booking trends across months.
Time-based analytics help in forecasting space requirements, understanding peak usage periods, and making data-driven planning decisions.
Click to Buy Office Utilization Dashboard in Power BI
Advantages of Using the Office Utilization Dashboard
-
✅ Provides a centralized view of all office spaces across departments and locations
-
✅ Tracks occupancy, utilization rates, and booking trends
-
✅ Interactive Power BI visuals enable drill-down analysis for deeper insights
-
✅ Helps identify underutilized spaces and optimize office allocation
-
✅ Supports both operational and strategic planning for hybrid work environments
Opportunities for Improvement
Click to Buy Office Utilization Dashboard in Power BI
-
Integrate with meeting room booking software for real-time updates
-
Add employee feedback or space satisfaction scores
-
Include cost per square foot analysis for better financial planning
-
Implement predictive analytics for future space requirements
Best Practices
-
Regularly update booking and occupancy data for accurate reporting
-
Review departmental and location-wise utilization monthly
-
Use insights to reallocate or repurpose underutilized spaces
-
Combine with HR and IT data to understand workforce distribution and hybrid work trends
Conclusion
Click to Buy Office Utilization Dashboard in Power BI
The Office Utilization Dashboard in Power BI is an essential tool for modern organizations aiming to optimize office space, reduce costs, and improve workforce efficiency. By offering real-time metrics, visual insights, and department/location-specific analysis, this dashboard empowers managers and facilities teams to make data-driven decisions and ensure office spaces are used effectively.
Visit our YouTube channel to learn step-by-step video tutorials
Watch the step-by-step video Demo:
Click to Buy Office Utilization Dashboard in Power BI