Managing office space efficiently is crucial for modern organizations, especially with hybrid and flexible work models. An Office Utilization Report in Excel provides a ready-to-use solution to track workspace occupancy, bookings, and utilization trends. This report helps facility managers, HR teams, and operations staff make data-driven decisions to optimize office resources.
In this article, we will explain the features, advantages, and best practices of using this Excel report.
What Is an Office Utilization Report?
An Office Utilization Report is a structured Excel tool that monitors how office space is being used. It tracks metrics such as total bookings, available versus occupied spaces, usage duration, and departmental occupancy.
Using Excel, this report allows organizations to:
-
Measure workspace utilization efficiently
-
Identify underused areas or overbooked zones
-
Make informed decisions about office layout, space allocation, and resource planning
-
Generate visual insights through cards and charts
Key Features of the Office Utilization Report
Click to Buy Office Utilization Report in Excel
This report contains three worksheets, each designed to provide unique insights:
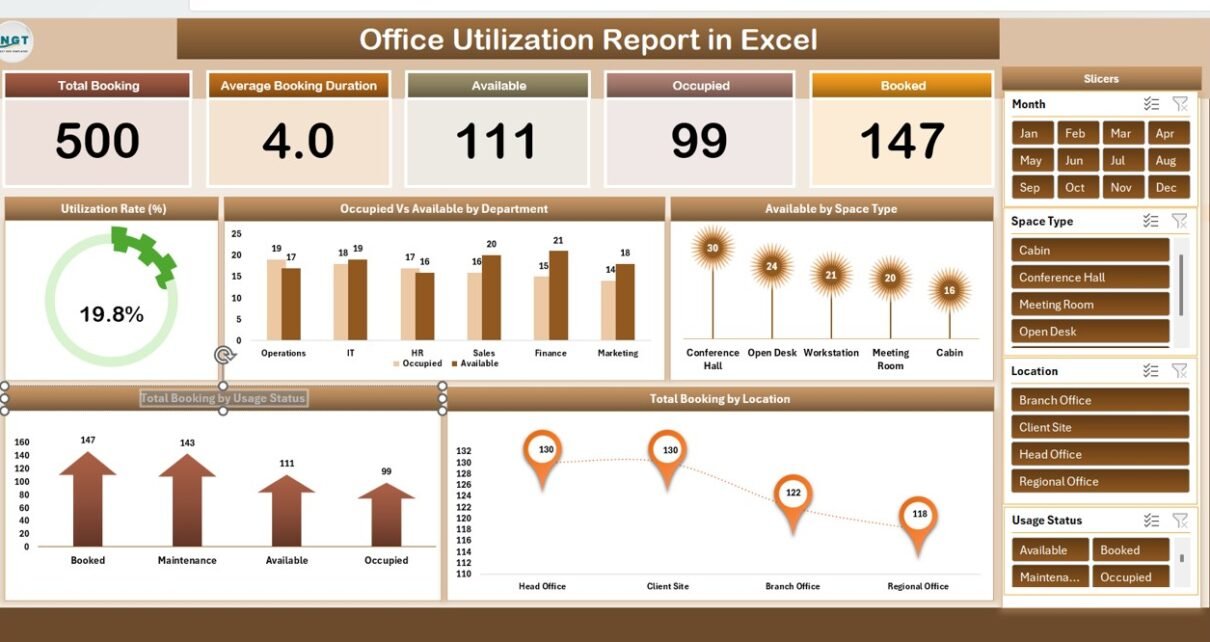
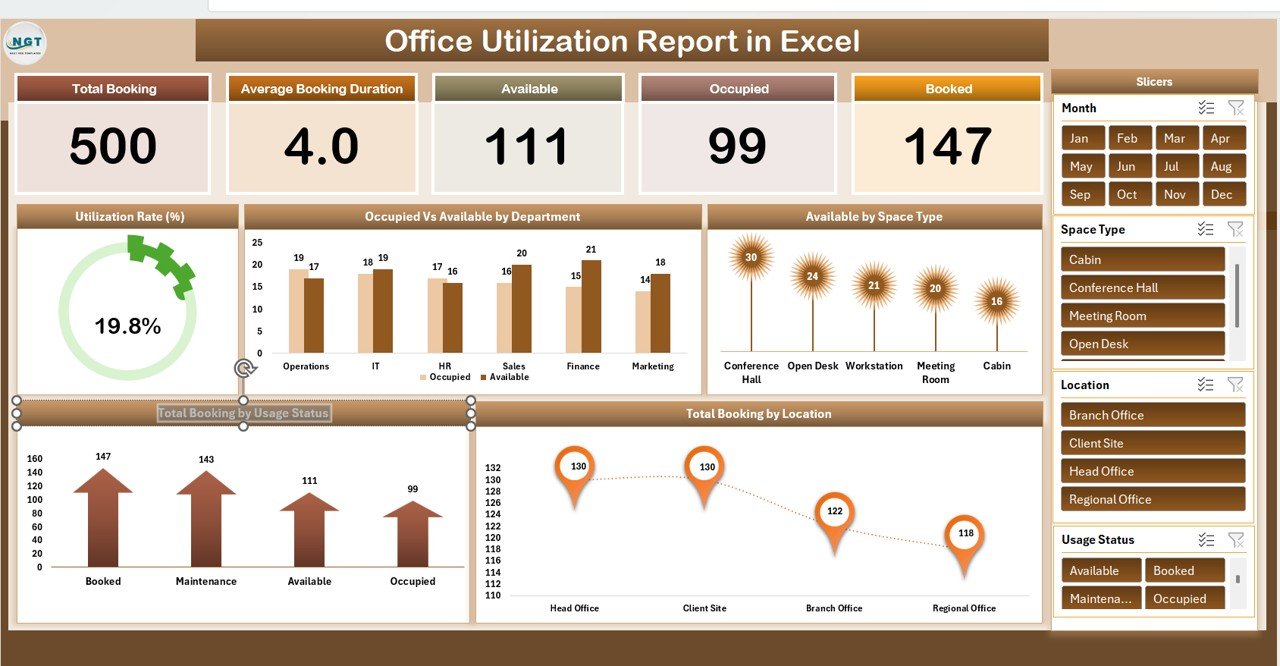
1. Summary Sheet Tab
The Summary Sheet offers a high-level overview with cards and charts:
Cards:
-
Total Booking: Total number of bookings across the office
-
Average Booking Duration: Average duration of each booking
-
Available: Total available office space
-
Occupied: Total occupied space
-
Booked: Number of booked spaces
Charts:
-
Utilization Rate (%): Percentage of office space utilization
-
Occupied vs Available by Department: Visual comparison of occupied and available spaces by department
-
Available by Space Type: Breakdown of available space by type (e.g., meeting rooms, desks)
-
Total Booking by Location: Shows which locations are most frequently booked
-
Total Booking by Usage Status: Breakdown by status such as confirmed, pending, or canceled
Click to Buy Office Utilization Report in Excel
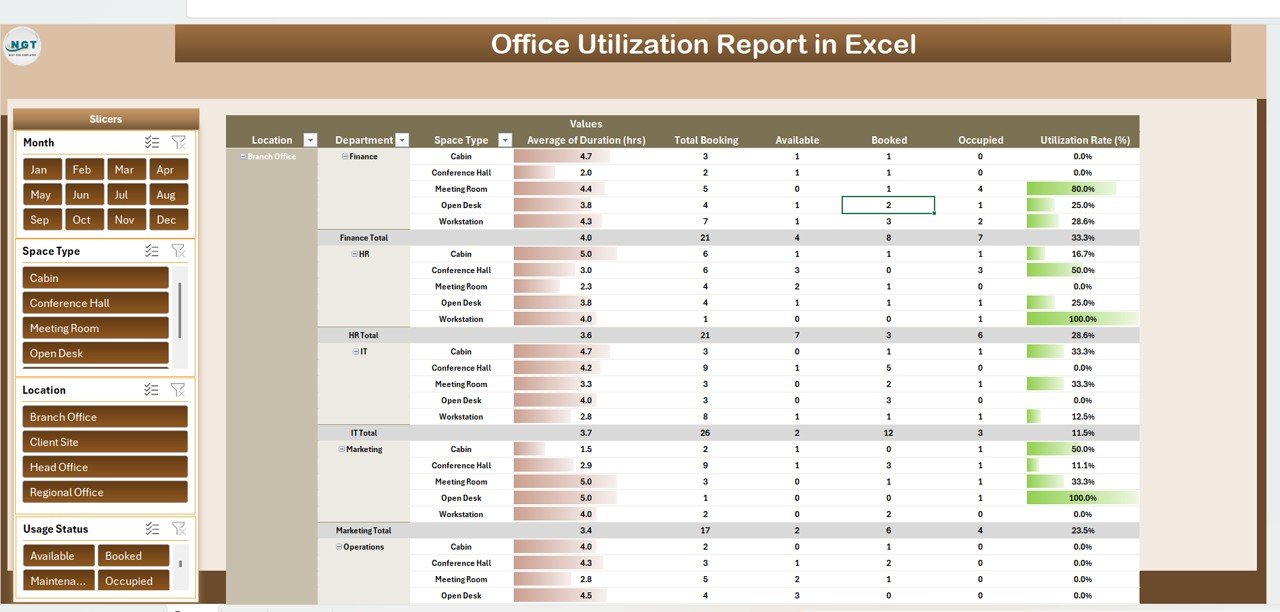
2. Report Sheet Tab
The Report Sheet uses a Power Pivot view to provide:
-
Detailed insights across multiple dimensions such as department, location, and space type
-
Drill-down capabilities to analyze bookings by different metrics
-
Summarized data for management reporting
This sheet is ideal for facility managers or operations teams who require deeper analysis of office utilization.
Click to Buy Office Utilization Report in Excel
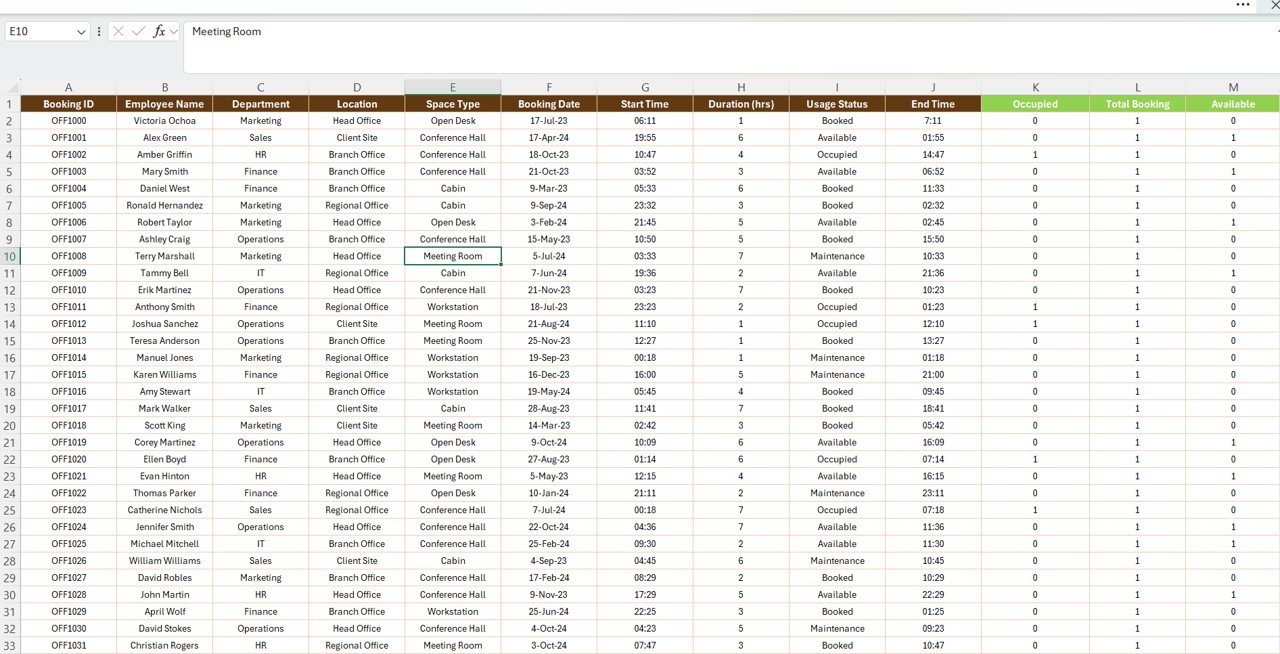
3. Data Sheet Tab
The Data Sheet serves as the input sheet for all bookings and space data:
-
Each booking record includes date, department, space type, location, duration, and status
-
Data updates automatically reflect in the Summary and Report sheets
-
Ensures accurate and consistent tracking of office space usage
This structured approach ensures reliable reporting and avoids errors from scattered data sources.
Click to Buy Office Utilization Report in Excel
Advantages of Using the Office Utilization Report
-
Centralized Data: Combines all office utilization metrics in one Excel file
-
Visual Insights: Cards and charts provide instant understanding of occupancy trends
-
Optimize Space: Identify underused areas and reallocate resources efficiently
-
Monitor Departments: Track utilization by department, location, and space type
-
Data Accuracy: Structured input ensures reliable and actionable insights
-
Time-Saving: Automates calculations and reporting for quick analysis
Best Practices for Using the Office Utilization Report
Click to Buy Office Utilization Report in Excel
-
Update Data Regularly: Input bookings and usage data promptly for accurate reporting
-
Segment by Department or Location: Analyze occupancy to identify high-traffic and low-utilization areas
-
Monitor Utilization Rate: Track percentage utilization to improve space allocation
-
Compare Booked vs Available: Optimize office resources by identifying overbooked or underutilized areas
-
Review Trends Over Time: Use monthly or quarterly data to inform long-term planning
How This Report Helps Organizations
-
Enhance Office Efficiency: Make informed decisions on space usage
-
Improve Resource Allocation: Allocate desks, rooms, and meeting spaces effectively
-
Support Hybrid Work Models: Monitor space utilization for flexible scheduling
-
Cost Savings: Reduce wasted office space and overhead costs
-
Data-Driven Planning: Use utilization insights to plan office expansions or downsizing
Frequently Asked Questions (FAQs)
Click to Buy Office Utilization Report in Excel
Q1: Can I customize the report for different office layouts?
Yes, you can modify departments, locations, or space types in the Data sheet to match your office setup.
Q2: Does the dashboard update automatically when I enter new data?
Yes, updating the Data sheet automatically reflects changes in the Summary and Report sheets.
Q3: Can I track utilization by room type?
Yes, the Summary sheet includes charts for Available by Space Type and departmental occupancy.
Q4: Is this report suitable for large organizations?
Absolutely. With Power Pivot and structured data input, it can handle a large number of bookings efficiently.
Q5: Can I use this report to support hybrid work schedules?
Yes, the dashboard provides insights into occupancy trends, helping plan flexible and hybrid schedules.
Conclusion
Click to Buy Office Utilization Report in Excel
The Office Utilization Report in Excel is a powerful, ready-to-use tool for tracking and analyzing office space usage. With visual dashboards, detailed pivot reports, and structured data input, organizations can optimize resources, improve efficiency, and make informed decisions to enhance workplace management.
Visit our YouTube channel to learn step-by-step video tutorials
Youtube.com/@NeotechNavigators
Watch the step-by-step video Demo:
Click to Buy Office Utilization Report in Excel