In today’s digital-first world, online reputation is one of the most powerful assets for any business. Whether you are running a small startup, a growing brand, or a global enterprise, how customers perceive you online can make or break your success. Positive reviews, high ratings, and strong digital visibility build trust and credibility, while negative feedback can damage growth opportunities.
To monitor, analyze, and improve this vital aspect, businesses need a structured reporting system. That’s where the Online Reputation KPI Dashboard in Excel comes into play. It provides an easy-to-use, interactive, and ready-to-implement tool that allows companies to track reputation metrics, measure progress, and take action.
This article explores the structure, features, benefits, best practices, and practical uses of an Online Reputation KPI Dashboard in Excel. By the end, you’ll know exactly how this tool can help your organization strengthen its online presence and credibility.
Click to buy Online Reputation KPI Dashboard in Excel
What Is an Online Reputation KPI Dashboard?
An Online Reputation KPI Dashboard is a reporting template that consolidates multiple key performance indicators (KPIs) related to brand perception, customer satisfaction, and digital engagement. Built in Excel, this dashboard offers an affordable, flexible, and scalable way to monitor reputation trends.
Instead of relying on scattered data sources or expensive software, managers can track performance at a glance and drill into details when necessary. From review ratings and brand mentions to sentiment analysis and customer feedback, all essential information can be structured and visualized in one place.
Why Use Excel for Online Reputation KPIs?
Many organizations wonder why Excel is still one of the most preferred tools for dashboards when other platforms like Power BI, Tableau, or Google Data Studio exist. The answer is simple:
- Accessibility: Almost every business professional is familiar with Excel.
- Flexibility: It supports custom formulas, charts, pivot tables, and automation.
- Cost-Effectiveness: Unlike premium BI tools, Excel requires no additional licensing fees.
- Ease of Sharing: Dashboards can be emailed, uploaded to shared drives, or integrated into reports.
- Scalability: It works well for small, medium, and even large datasets when properly structured.
Thus, the Online Reputation KPI Dashboard in Excel strikes the perfect balance between functionality and simplicity.
Key Features of the Online Reputation KPI Dashboard in Excel
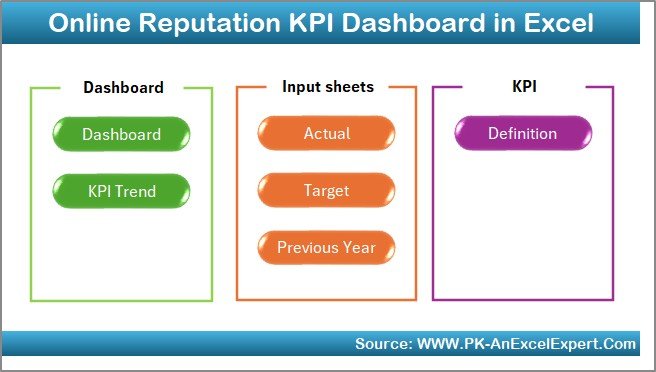
This dashboard template comes with seven well-structured worksheets, each serving a unique purpose. Let’s explore them in detail.
Home Sheet
The Home sheet serves as the index page. It includes six navigation buttons that allow you to jump quickly to different worksheets. This design makes the template user-friendly and professional.
Click to buy Online Reputation KPI Dashboard in Excel
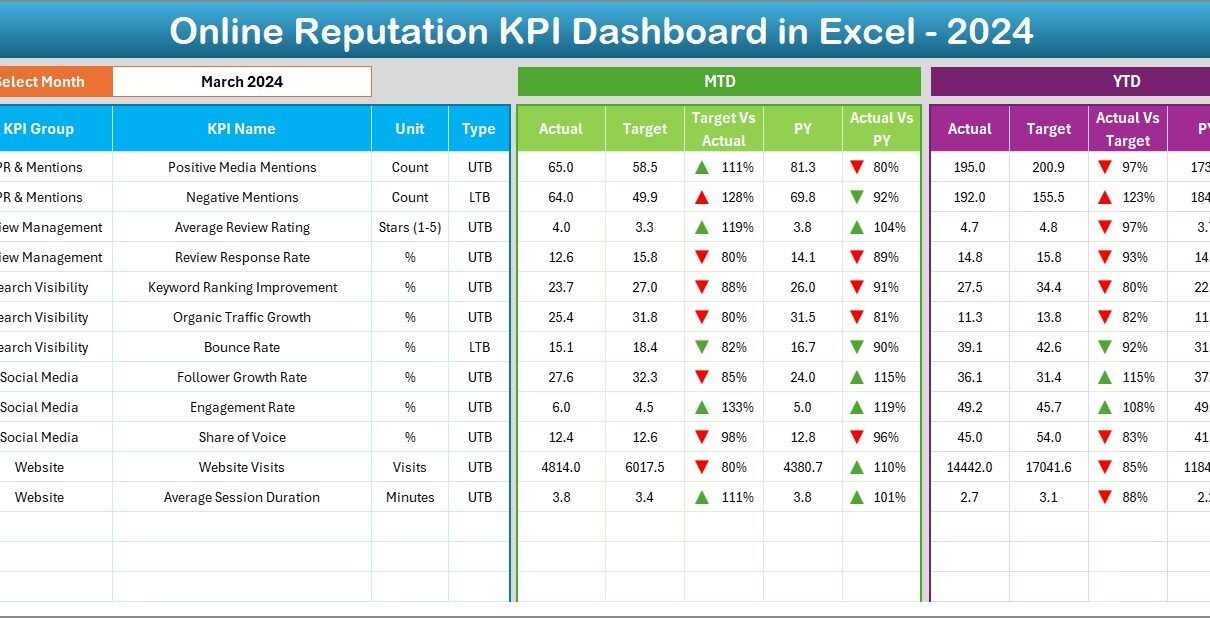
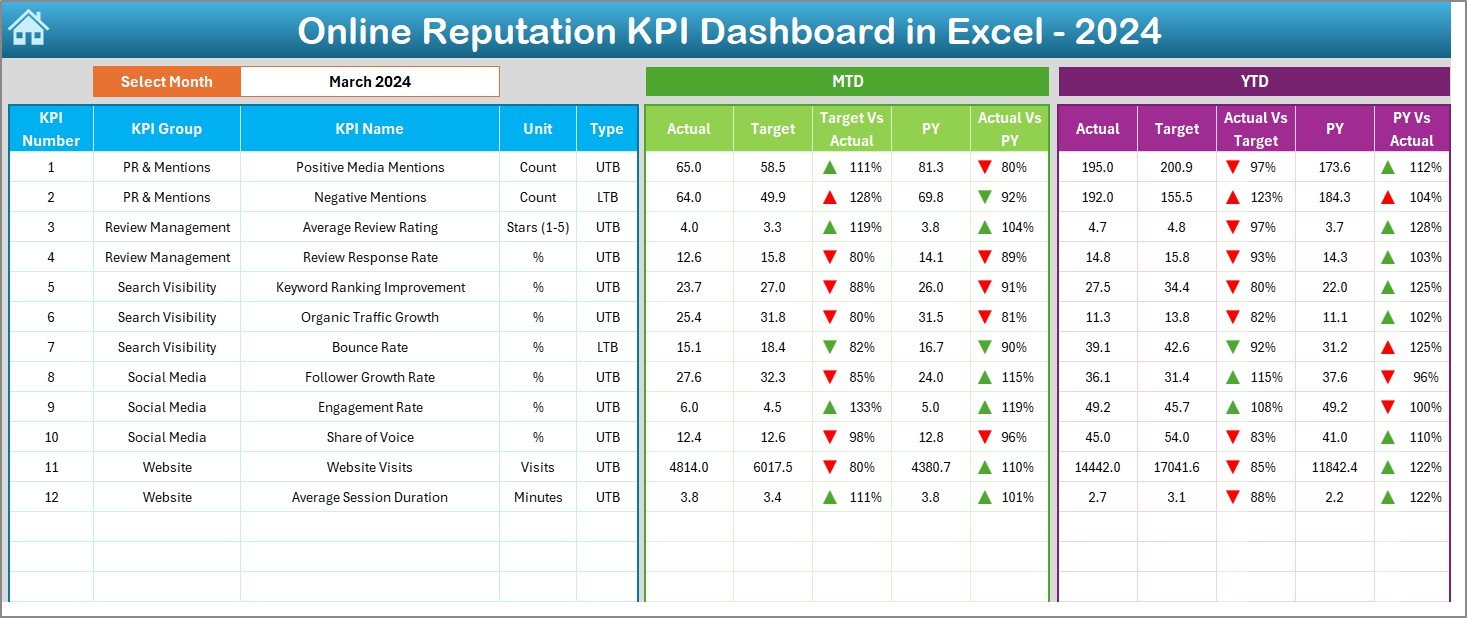
Dashboard Sheet Tab
This is the main visualization sheet where you see all KPIs in a clear format.
- A drop-down in cell D3 lets you choose the month.
- The dashboard updates automatically to show data for the selected month.
- It displays Month-to-Date (MTD) and Year-to-Date (YTD) values for Actual, Target, and Previous Year (PY).
- Conditional formatting with up/down arrows highlights performance improvements or declines.
- Both MTD and YTD comparisons provide a complete picture of reputation performance.
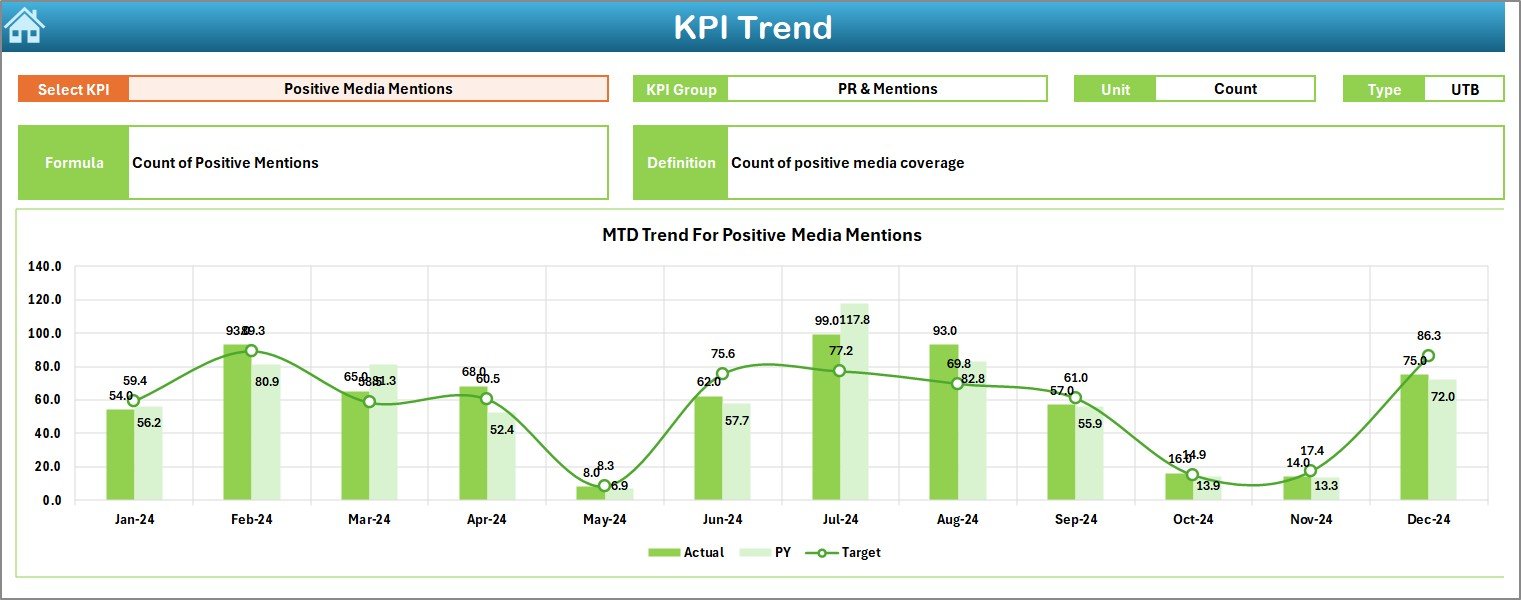
KPI Trend Sheet Tab
Here you can:
- Select a KPI from a drop-down menu (cell C3).
- View its group, unit, formula, and definition.
- See whether it is Lower the Better (LTB) or Upper the Better (UTB).
- Analyze MTD and YTD trend charts for Actual, Target, and PY values.
This sheet is particularly useful for identifying long-term trends and spotting risks early.
Click to buy Online Reputation KPI Dashboard in Excel
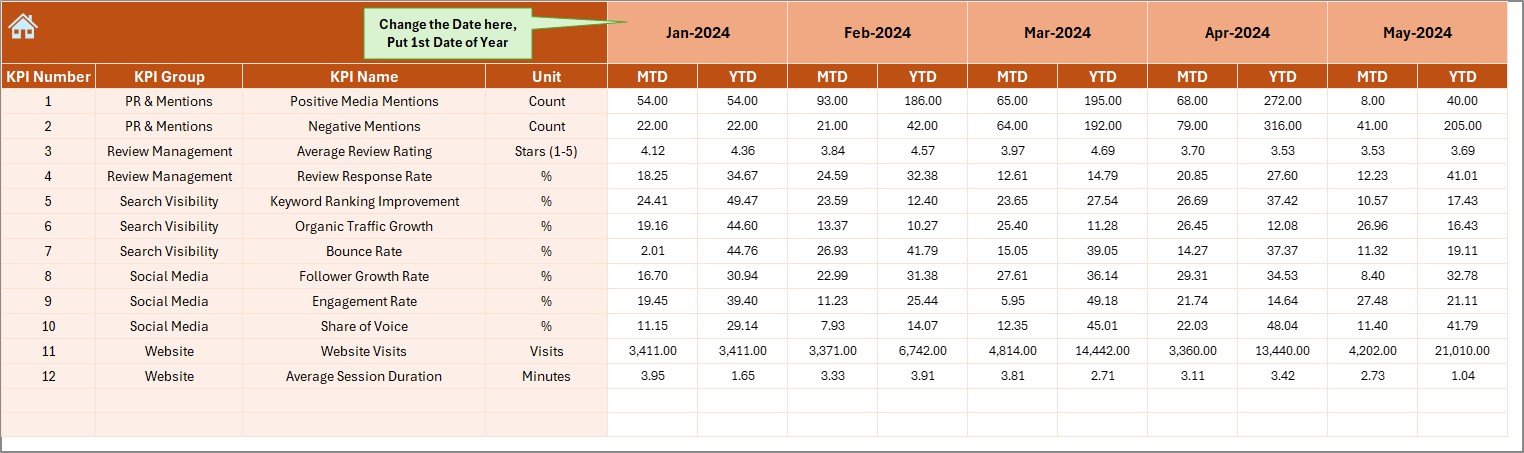
Actual Numbers Input Sheet
This sheet is where you enter MTD and YTD actual data for each month.
- Use cell E1 to set the first month of the year.
- The sheet automatically updates ranges based on this input.
- This design ensures data remains consistent and flexible across different reporting years.
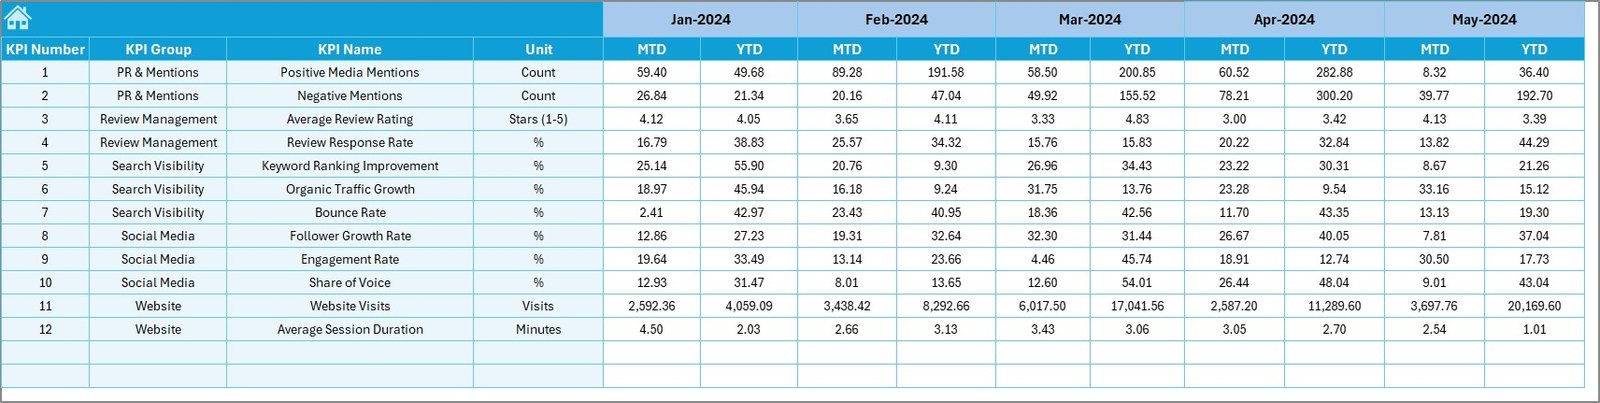
Target Sheet Tab
Here you can input monthly MTD and YTD targets for every KPI. Targets can be adjusted as strategies change, making it easy to compare planned vs. actual performance.
Click to buy Online Reputation KPI Dashboard in Excel
Previous Year Numbers Sheet
To assess year-over-year progress, this sheet allows you to enter last year’s MTD and YTD figures in the same structure as the current year.
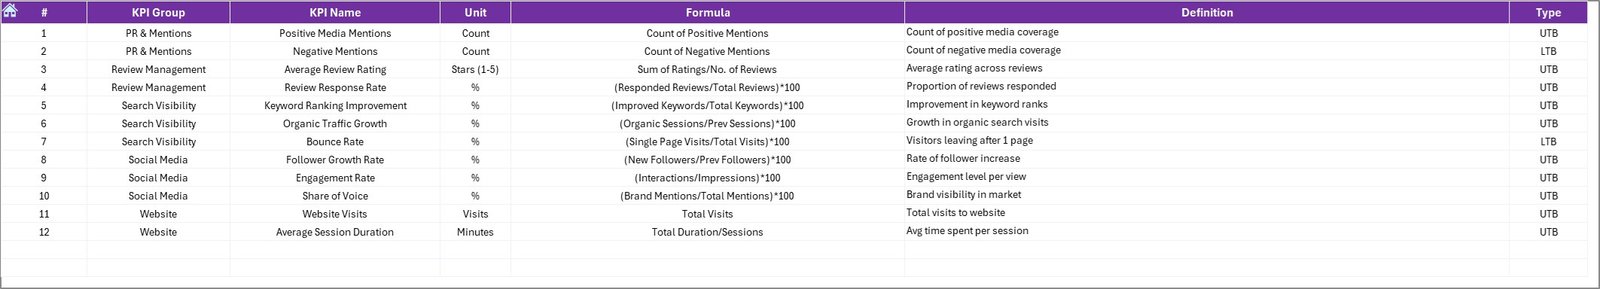
KPI Definition Sheet
This is the reference sheet that contains:
- KPI Names
- KPI Groups
- Units of measurement
- Formulas
- Clear definitions
It ensures clarity and consistency across all users.
Examples of Reputation KPIs to Track
The actual KPIs you include depend on your industry and business model, but some common online reputation KPIs include:
- Average Review Rating (Google, Yelp, Trustpilot, etc.)
- Customer Satisfaction Score (CSAT)
- Sentiment Score (from social media mentions)
- Number of Reviews Collected
- Response Time to Reviews or Complaints
- % of Resolved Negative Reviews
- Net Promoter Score (NPS)
- Brand Mentions across blogs, forums, and social media
- Engagement Rate on reputation-driven campaigns
These KPIs can be adapted and calculated within the Excel dashboard using formulas and conditional formatting.
Advantages of Using an Online Reputation KPI Dashboard in Excel
Let’s explore the key benefits of this dashboard:
- Centralized Data: View all reputation metrics in one place.
- Customizable: Modify KPIs, layouts, and formulas as per your needs.
- Real-Time Tracking: See instant updates when actuals or targets change.
- Better Decisions: Visual comparisons highlight performance gaps.
- Year-over-Year Analysis: Easily compare current vs. previous years.
- User-Friendly: Simple navigation buttons and structured design.
- Cost Savings: No extra software investment needed.
Opportunities for Improvement in Reputation Tracking
Even with a strong dashboard, businesses should consider enhancing their process:
- Automate Data Entry: Link Excel with online data sources or APIs.
- Expand KPIs: Include new metrics such as influencer impact or share of voice.
- Global Tracking: Add multi-language review monitoring.
- Mobile Accessibility: Optimize reports for viewing on mobile devices.
- Cross-Department Integration: Link reputation metrics with sales and marketing KPIs.
Best Practices for Using the Online Reputation KPI Dashboard
To get maximum value from this tool, follow these best practices:
- Update Data Regularly: Ensure MTD and YTD actuals are entered consistently.
- Set Realistic Targets: Align targets with industry benchmarks.
- Standardize Definitions: Use the KPI Definition sheet to avoid confusion.
- Leverage Conditional Formatting: Quickly spot underperforming areas.
- Review Trends Monthly: Use the KPI Trend sheet for early action.
- Integrate Feedback Loops: Share insights with customer service, marketing, and management teams.
How Businesses Can Benefit from Reputation KPI Dashboards
Different teams and stakeholders benefit from using this dashboard:
- Marketing Teams can monitor brand sentiment and campaign impact.
- Customer Service can track response time and resolution rates.
- Sales Teams can align reputation trends with conversion success.
- Executives get a consolidated view for strategic planning.
- SMEs and Startups can access affordable reputation monitoring without expensive tools.
Step-by-Step: How to Implement the Dashboard
- Download the template or build one based on the structure provided.
- Customize KPIs to suit your business needs.
- Enter target values in the Target sheet.
- Add previous year data to the PY sheet.
- Start entering monthly actuals in the Actual Numbers Input sheet.
- Use the Dashboard sheet to monitor performance.
- Review KPI trends regularly and share insights with teams.
Conclusion
Your brand’s online reputation is more valuable than ever before. Customers trust ratings, reviews, and social mentions when making buying decisions. The Online Reputation KPI Dashboard in Excel empowers businesses to track, measure, and improve reputation metrics without expensive tools.
By centralizing data, simplifying reporting, and enabling better decisions, this dashboard becomes a must-have for any business serious about building trust and credibility online.
Frequently Asked Questions (FAQs)
- What is an Online Reputation KPI Dashboard?
It is an Excel-based tool that tracks reputation metrics like review ratings, sentiment, and customer satisfaction to measure brand credibility.
- Who can use this dashboard?
Any organization—startups, SMEs, or enterprises—can use it to monitor and improve their online presence.
- Can I add my own KPIs?
Yes, the template is fully customizable. You can add or remove KPIs depending on your business needs.
- How often should I update the dashboard?
For best results, update it monthly with actual and target data.
- Is Excel better than Power BI for this dashboard?
Excel is cost-effective and user-friendly, while Power BI is more advanced for large-scale analytics. For most SMEs, Excel works perfectly.
- Can this dashboard track social media sentiment?
Yes, you can add KPIs for mentions, likes, and sentiment scores manually or by linking to data imports.
- Does the dashboard support year-over-year comparison?
Yes, the Previous Year Numbers sheet makes it easy to compare performance over time.
Visit our YouTube channel to learn step-by-step video tutorials
Watch the step-by-step video tutorial:
Click to buy Online Reputation KPI Dashboard in Excel