Managing operations in the packaging industry demands accuracy, speed, and clarity. Because raw materials, production efficiency, quality control, and delivery timelines matter deeply, decision-makers cannot rely on scattered spreadsheets or delayed reports. That is exactly why a Packaging Industry KPI Dashboard in Excel plays a critical role in modern packaging businesses.
In this detailed guide, you will clearly understand what a Packaging Industry KPI Dashboard in Excel is, how it works, why it matters, and how each worksheet supports smarter decisions. Moreover, you will learn how this dashboard helps packaging companies track performance, control costs, and improve operational efficiency—without depending on expensive software.
Click to buy Packaging Industry KPI Dashboard in Excel
What Is a Packaging Industry KPI Dashboard in Excel?
A Packaging Industry KPI Dashboard in Excel is a structured, interactive reporting tool designed to track and analyze key performance indicators related to packaging operations.
Instead of switching between multiple sheets or systems, this dashboard brings all operational, financial, and efficiency KPIs into a single Excel file. As a result, plant managers, production heads, quality teams, and senior leaders can monitor performance instantly.
Most importantly, Excel makes this dashboard flexible, affordable, and easy to customize for any packaging business—whether you operate in food packaging, pharma packaging, corrugated boxes, flexible packaging, or industrial packaging.
Why Do Packaging Companies Need KPI Dashboards?
Packaging operations involve several moving parts. Therefore, even small inefficiencies can lead to higher costs and delayed deliveries. Because of that, packaging businesses need clear visibility into performance.
A Packaging Industry KPI Dashboard in Excel helps companies:
- Track production efficiency month-by-month
- Compare actual vs target output
- Monitor quality metrics and waste
- Analyze year-to-date and month-to-date performance
- Identify trends and performance gaps early
Instead of reacting late, managers can act quickly and make data-driven decisions.
What Key KPIs Can You Track in a Packaging Industry Dashboard?
Although KPIs vary by business type, most packaging companies track the following metrics:
- Production Output
- Capacity Utilization
- Waste Percentage
- Rejection Rate
- Cost per Unit
- On-time Delivery Rate
- Machine Downtime
- Energy Consumption
- Quality Compliance Rate
Because this Excel dashboard allows flexible KPI definitions, teams can easily add or modify KPIs based on operational needs.
How Is the Packaging Industry KPI Dashboard Structured in Excel?
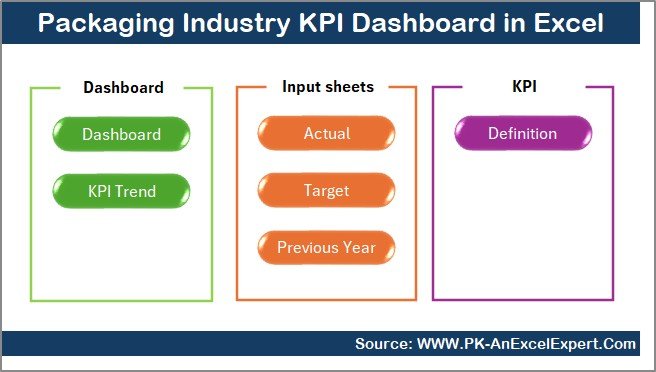
This Packaging Industry KPI Dashboard in Excel includes 7 well-organized worksheets, each serving a specific purpose. Let us break them down clearly.
What Is the Purpose of the Summary Page?
Summary Page (Index Sheet)
The Summary Page acts as the navigation hub for the entire dashboard.
Key Features of the Summary Page:
- Clean index layout
- Six navigation buttons
- Quick jumping to any worksheet
- Improved usability for non-technical users
Because users can move between sheets with a single click, the dashboard becomes easy to use even for first-time users.
Click to buy Packaging Industry KPI Dashboard in Excel
What Makes the Dashboard Sheet the Most Important?
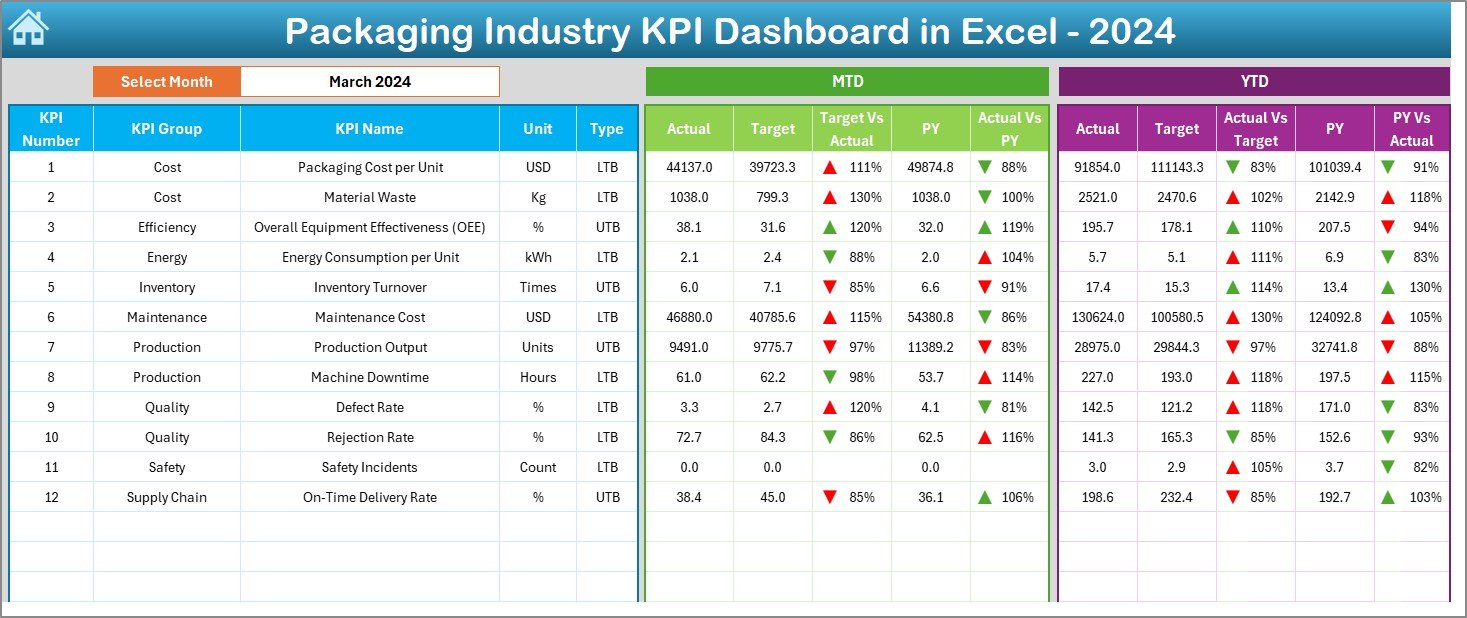
Dashboard Sheet (Main KPI View)
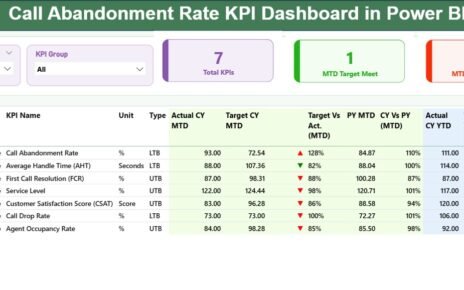
The Dashboard sheet works as the heart of the KPI system. Here, users can view all key KPIs in one consolidated screen.
Key Functionalities of the Dashboard Sheet:
- Month selector (Drop-down in cell D3)
- Dynamic KPI refresh based on selected month
- Clear MTD and YTD comparisons
- Visual indicators for performance gaps
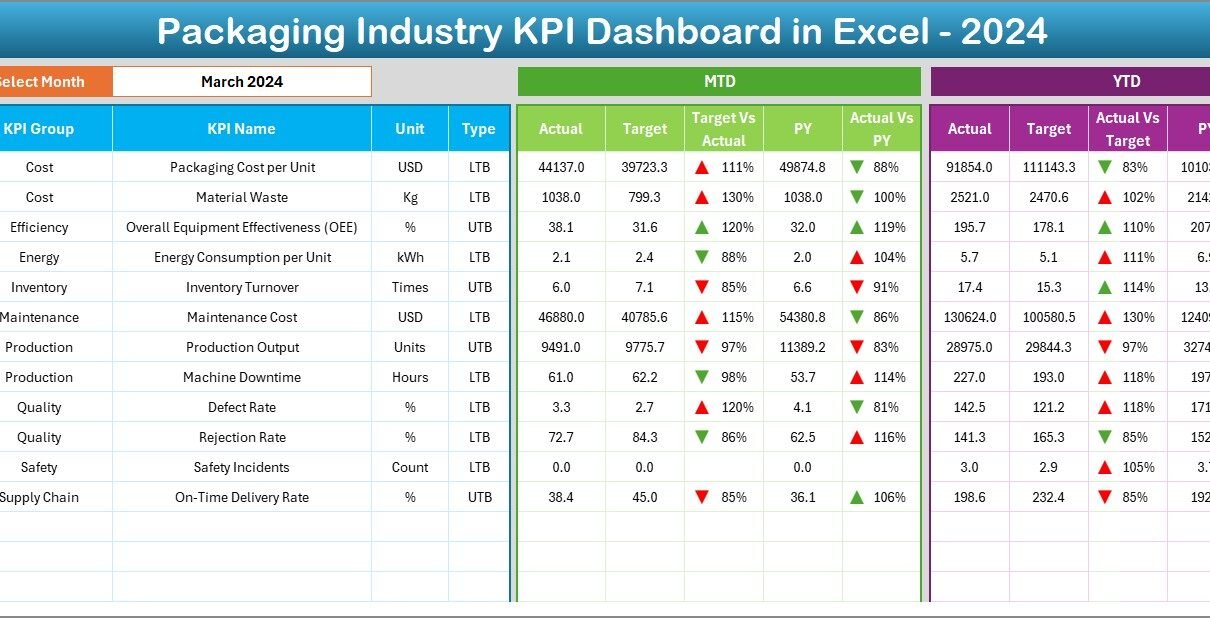
What Data Appears on This Sheet?
For every KPI, the dashboard shows:
Month-to-Date (MTD)
- Actual
- Target
- Previous Year
Year-to-Date (YTD)
- Actual
- Target
- Previous Year
Additionally, it displays:
- Target vs Actual variance
- Previous Year vs Actual variance
Because conditional formatting highlights improvements and declines using up/down arrows, users instantly understand performance trends.
Click to buy Packaging Industry KPI Dashboard in Excel
How Does the Trend Sheet Help in KPI Analysis?
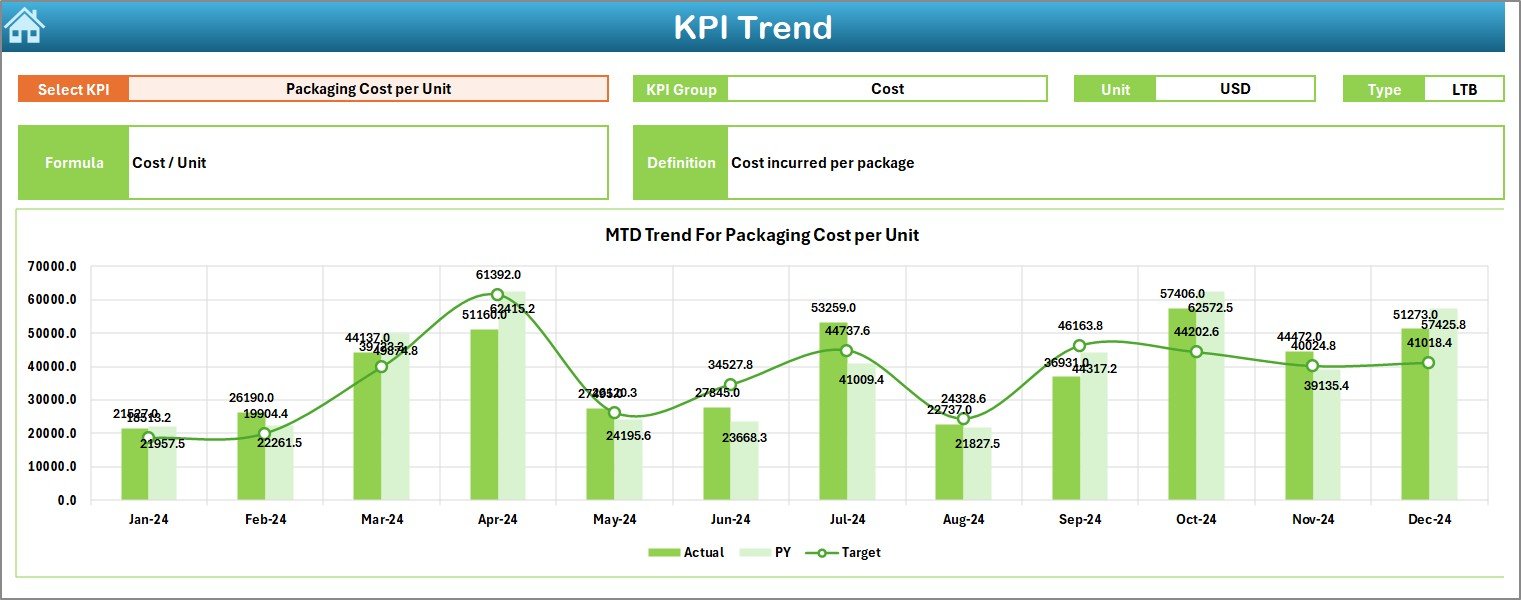
Trend Sheet Tab
The Trend Sheet allows deeper KPI analysis over time. Instead of only viewing summary numbers, users analyze patterns and progress.
What Can You Select on the Trend Sheet?
- KPI Name (Drop-down in cell C3)
Information Displayed Automatically:
- KPI Group
- KPI Unit
- Type of KPI (Upper is Better / Lower is Better)
- KPI Formula
- KPI Definition
Visual Analysis on the Trend Sheet:
- MTD Actual vs Target vs Previous Year trend
- YTD Actual vs Target vs Previous Year trend
Because of these trend charts, managers can identify whether performance improves consistently or fluctuates.
Click to buy Packaging Industry KPI Dashboard in Excel
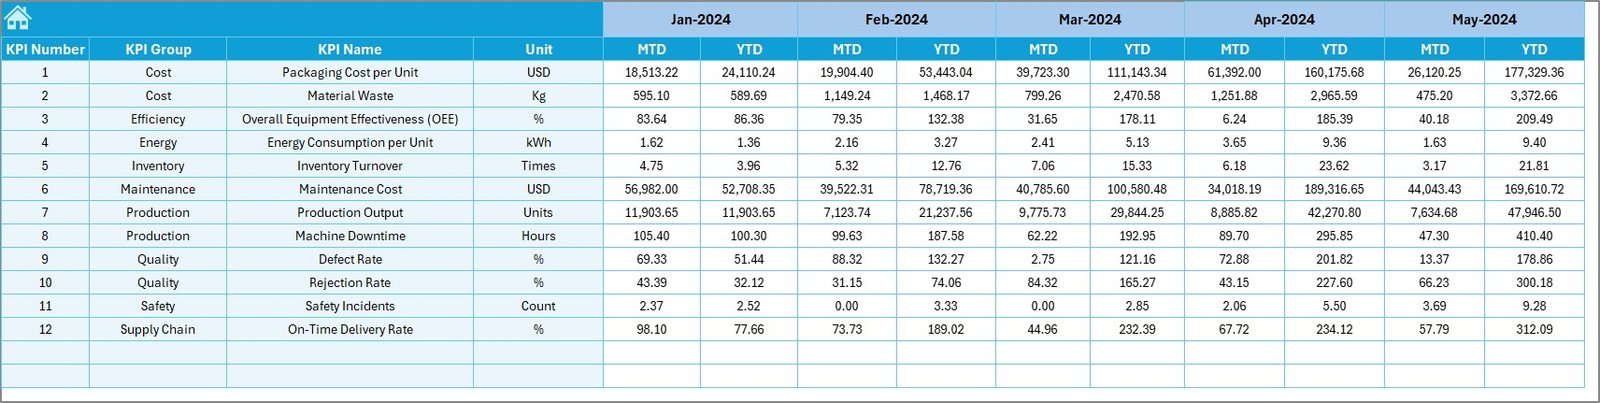
Where Do You Enter Actual Performance Data?
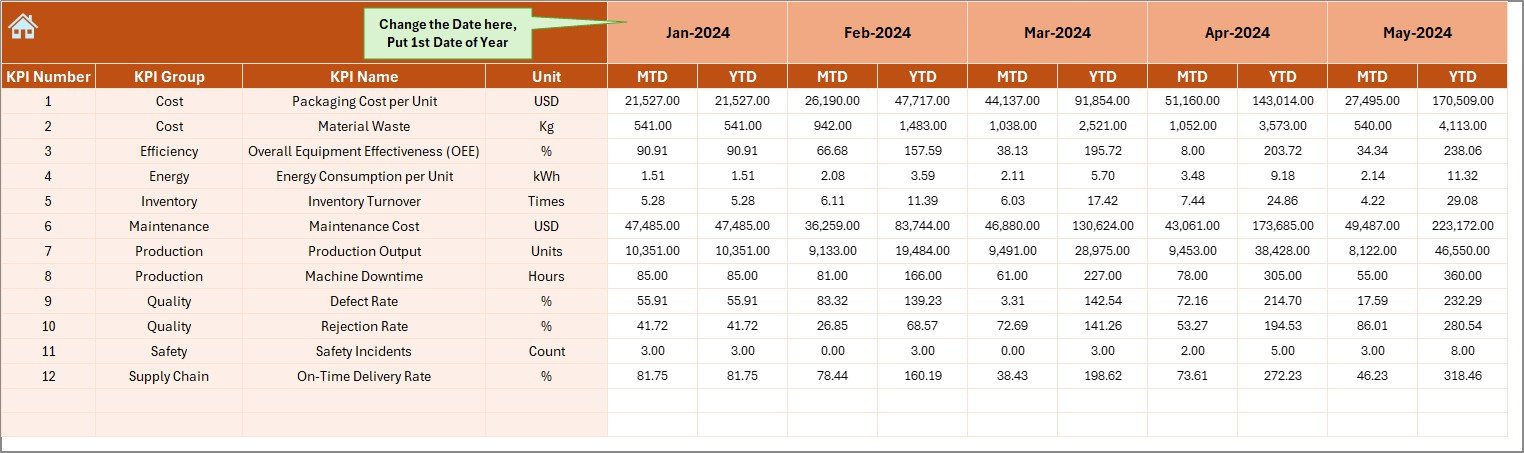
Actual Numbers Input Sheet
The Actual Numbers Input sheet stores real performance values and serves as the backbone of the dashboard.
How Does This Sheet Work?
- Month selector available in cell E1
- Ability to define the first month of the year
- Simple input format for MTD and YTD data
Because data entry stays separate from visualization, users avoid accidental formula issues and maintain data integrity.
Click to buy Packaging Industry KPI Dashboard in Excel
How Are Targets Managed in the Dashboard?
Target Sheet Tab
The Target Sheet allows planners and leadership teams to define expected performance levels.
Key Capabilities:
- Set monthly targets for each KPI
- Maintain both MTD and YTD target values
- Align operational goals with strategic objectives
Because targets remain dynamic, teams can update expectations based on demand, seasonality, or capacity changes.
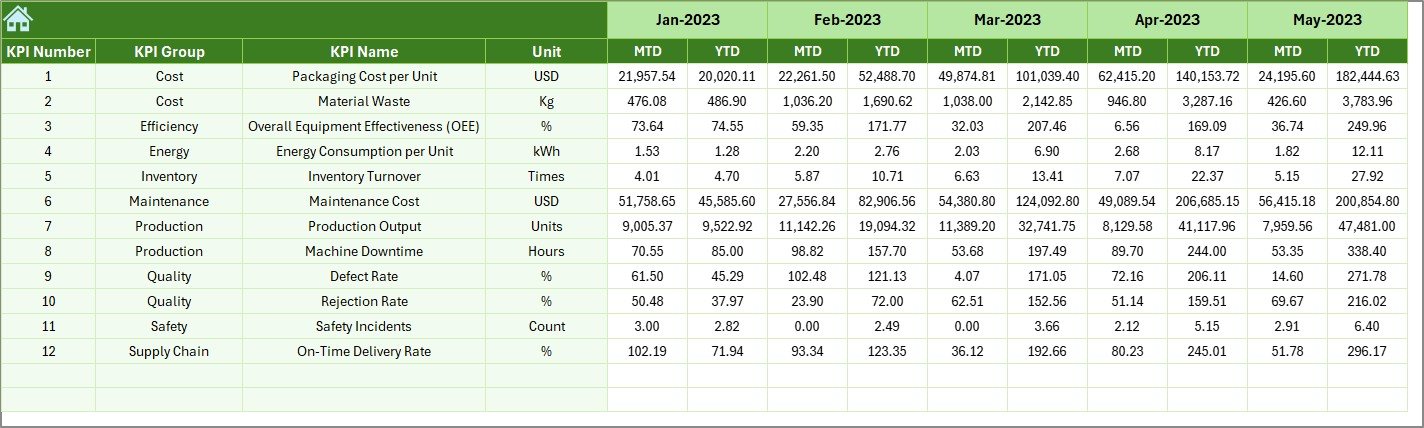
Why Track Previous Year Numbers?
Previous Year Number Sheet
The Previous Year Number sheet helps businesses compare current performance with historical benchmarks.
Why This Matters:
- Identify long-term growth trends
- Measure year-on-year improvement
- Understand seasonal effects
Because comparisons remain consistent with the same KPIs and structure, leadership gains realistic insight into improvement levels.
Click to buy Packaging Industry KPI Dashboard in Excel
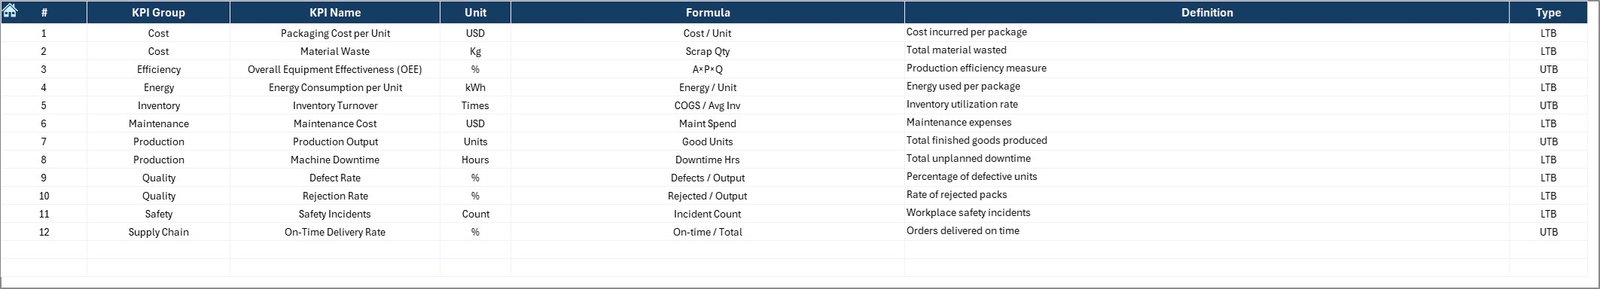
How Does the KPI Definition Sheet Improve Transparency?
KPI Definition Sheet Tab
The KPI Definition sheet acts as a documentation layer for the dashboard.
What Information Does It Store?
- KPI Name
- KPI Group (Production, Quality, Cost, Delivery, etc.)
- KPI Unit
- KPI Formula
- KPI Definition
Because every KPI comes with a clear explanation, teams avoid confusion and maintain consistent reporting standards.
How Does This Dashboard Support Better Decision-Making?
A Packaging Industry KPI Dashboard in Excel does more than present numbers. It enables proactive decisions.
Because the dashboard highlights gaps, trends, and comparisons, managers can:
- Identify underperforming areas instantly
- Prioritize corrective actions
- Align shop-floor operations with targets
- Improve accountability across departments
As a result, decision-making becomes faster, clearer, and data-driven.
Advantages of Packaging Industry KPI Dashboard in Excel
Why Should Packaging Companies Use This Dashboard?
Centralized KPI Management
All KPIs remain organized in a single Excel file, which eliminates confusion and duplication.
Month-Wise and Year-Wise Tracking
Because users can switch months instantly, performance monitoring becomes flexible.
Clear Visual Indicators
Conditional formatting highlights improvements and declines without extra explanation.
Easy Customization
Users can add, remove, or modify KPIs without complex technical work.
Cost-Effective Solution
Excel avoids expensive BI tools while delivering powerful insights.
Improved Accountability
Defined KPIs and targets improve ownership across teams.
Best Practices for the Packaging Industry KPI Dashboard in Excel
To get the maximum value from this dashboard, organizations should follow these proven best practices.
Define KPIs Clearly Before Implementation
Always ensure KPIs reflect actual business objectives and operational realities.
Keep Monthly Data Entry Consistent
Maintain a standard schedule for entering MTD and YTD data.
Review Trends Regularly
Do not focus only on monthly numbers. Analyze trends to identify early warnings.
Align Targets With Capacity
Set realistic targets based on machine capacity and workforce availability.
Train Teams on KPI Definitions
Use the KPI Definition sheet to ensure everyone understands metrics correctly.
Use the Dashboard in Review Meetings
Make the dashboard the center of monthly and quarterly performance reviews.
Who Can Use a Packaging Industry KPI Dashboard?
This dashboard suits a wide range of users, including:
- Packaging Plant Managers
- Production Supervisors
- Quality Control Teams
- Operations Heads
- Finance and Costing Teams
- Business Owners
Because Excel remains familiar, adoption happens quickly across departments.
How Is This Dashboard Different From Regular Excel Reports?
Traditional Excel reports focus on static tables. In contrast, this KPI dashboard:
- Combines visuals with data
- Updates automatically based on month selection
- Shows comparisons instead of raw numbers
- Supports strategic decisions, not just reporting
Because of this structured design, users spend less time analyzing and more time acting.
What Are the Key Use Cases of This Dashboard?
Packaging companies commonly use this dashboard for:
- Monthly performance reviews
- Year-to-date operational tracking
- Target vs actual monitoring
- Continuous improvement initiatives
- Management presentations
As a result, the dashboard becomes a daily management tool instead of a one-time report.
Conclusion: Why Is a Packaging Industry KPI Dashboard in Excel Essential?
In today’s competitive environment, packaging companies cannot afford inefficiency or delayed insights. A Packaging Industry KPI Dashboard in Excel equips teams with clarity, control, and confidence.
Because it brings KPIs, trends, targets, and history into one place, decision-makers gain real-time visibility into performance. Moreover, Excel makes the solution practical, affordable, and scalable.
When used correctly, this dashboard transforms raw numbers into actionable insights and helps packaging businesses improve productivity, quality, and profitability.
Frequently Asked Questions (FAQs)
What is a Packaging Industry KPI Dashboard in Excel?
A Packaging Industry KPI Dashboard in Excel is an interactive reporting tool that tracks operational, financial, and performance KPIs for packaging businesses using Excel.
Can I customize KPIs in this dashboard?
Yes, users can easily add, edit, or remove KPIs using the KPI Definition sheet.
Does the dashboard support monthly and yearly analysis?
Yes, the dashboard supports both Month-to-Date (MTD) and Year-to-Date (YTD) analysis with comparisons.
Do I need advanced Excel skills to use it?
No, basic Excel knowledge is sufficient to operate and update the dashboard.
Can this dashboard work for different packaging segments?
Yes, the structure suits food, pharma, industrial, corrugated, and flexible packaging businesses.
How often should data be updated?
Teams typically update data monthly; however, they can update it more frequently if needed.
Visit our YouTube channel to learn step-by-step video tutorials
Watch the step-by-step video tutorial:
Click to buy Packaging Industry KPI Dashboard in Excel