Managing pension funds always requires accuracy, clarity, and timely insights. As pension fund managers deal with investments, liabilities, contributions, risk assessment, and compliance, they often need a single place to track everything. Because of this strong need, a Pension Funds KPI Dashboard in Excel becomes one of the most useful tools for finance professionals.
In this detailed guide, you will discover everything about this dashboard. You will learn how it works, why it matters, what KPIs you should track, and how you can use Excel effectively to monitor pension performance. You will also explore the best practices, advantages, and expert tips to make your dashboard more powerful.
Let us begin the journey toward smarter pension fund reporting.
Click to buy Pension Funds KPI Dashboard in Excel
What Is a Pension Funds KPI Dashboard in Excel?
A Pension Funds KPI Dashboard in Excel is a structured, interactive, and ready-to-use reporting system. It helps pension administrators, analysts, and managers track monthly and yearly metrics in a clean visual format. Because Excel offers flexibility, this dashboard gives you full control to customize KPIs, enter numbers, compare performance, and evaluate trends.
You can easily monitor:
- Fund performance
- Investment returns
- Contribution levels
- Benefit payouts
- Asset allocation
- Funding ratios
- Risk exposure
- Administrative efficiency
Since everything appears in one place, you save time, reduce errors, and make informed decisions faster.
Why Should You Use a Pension Funds KPI Dashboard in Excel?
When pension operations grow, the workload increases. Data spreads across sheets, emails, and multiple systems. Because of this, tracking KPIs manually becomes confusing and stressful. A structured Excel dashboard solves this problem instantly.
You should use this dashboard because it allows you to:
- Track performance clearly
- Compare Actual vs Target
- Monitor year-over-year growth
- Review fund stability
- Reduce reporting time
- Improve accuracy
- Present insights with visuals
- Strengthen decision-making
Let us explore the structure of this dashboard to understand how everything works together.
How Does the Pension Funds KPI Dashboard in Excel Work?
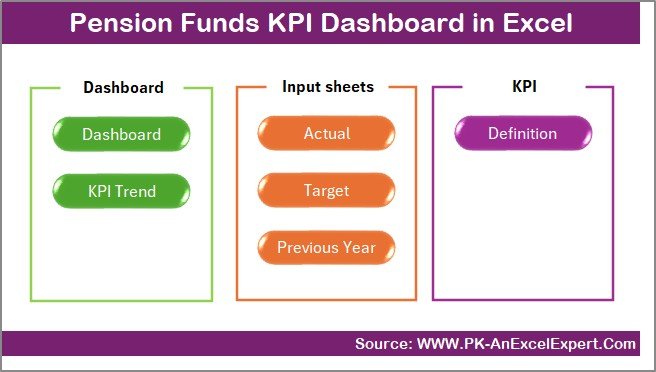
This dashboard includes 7 powerful worksheets, each designed to handle different parts of reporting.
Summary Page – What Does This Sheet Show?
The Summary Page acts as the main index. It displays six buttons that take you directly to the key sheets.
Because navigation becomes simple, you can move across the dashboard quickly without scrolling or searching.
Click to buy Pension Funds KPI Dashboard in Excel
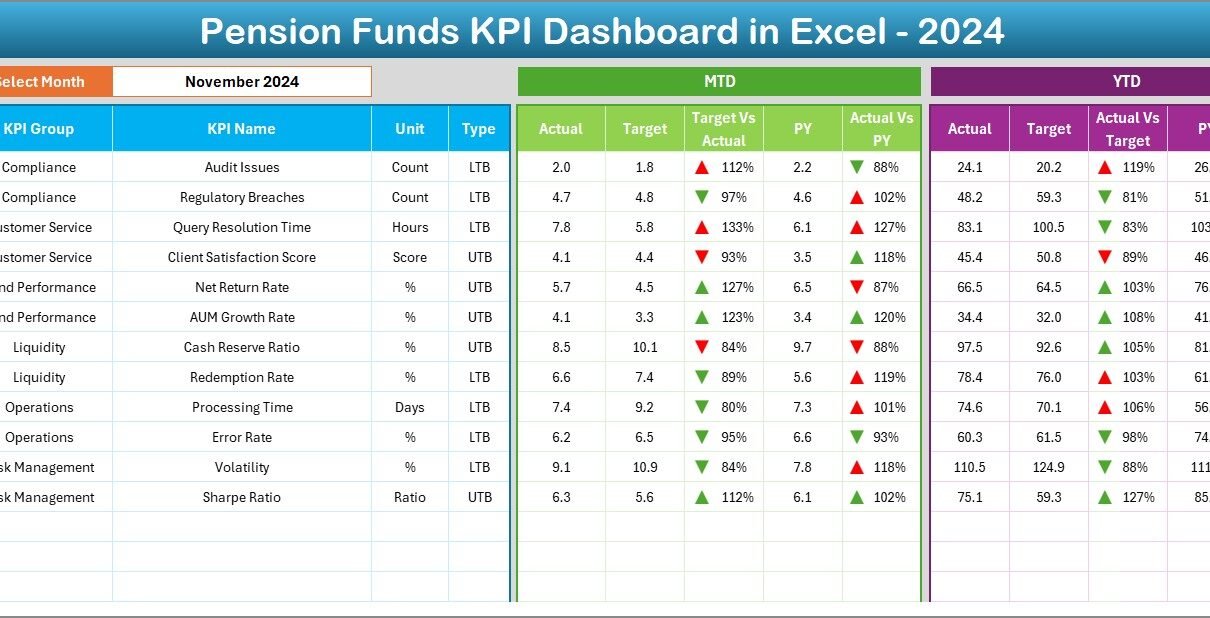
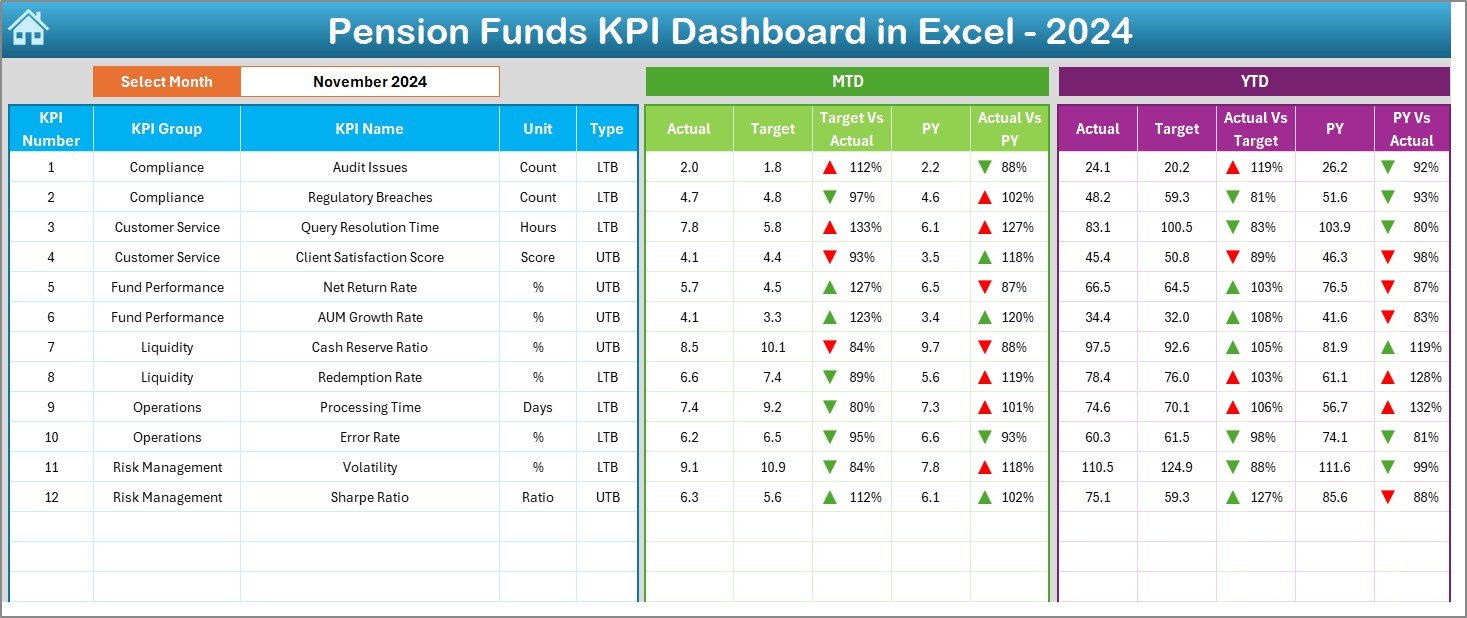
Dashboard Sheet – How Can You View Monthly and Yearly KPIs?
This is the main visual page where all KPIs appear in charts, cards, and tables.
Here is how it works:
- You select the Month from the drop-down in cell D3.
- The entire dashboard updates automatically.
You instantly see:
- MTD Actual
- MTD Target
- MTD Previous Year
- Target vs Actual
- Previous Year vs Actual
- YTD Actual
- YTD Target
- YTD Previous Year
Up and down arrows show performance health with conditional formatting. Because of this, you understand progress at a glance.
Click to buy Pension Funds KPI Dashboard in Excel
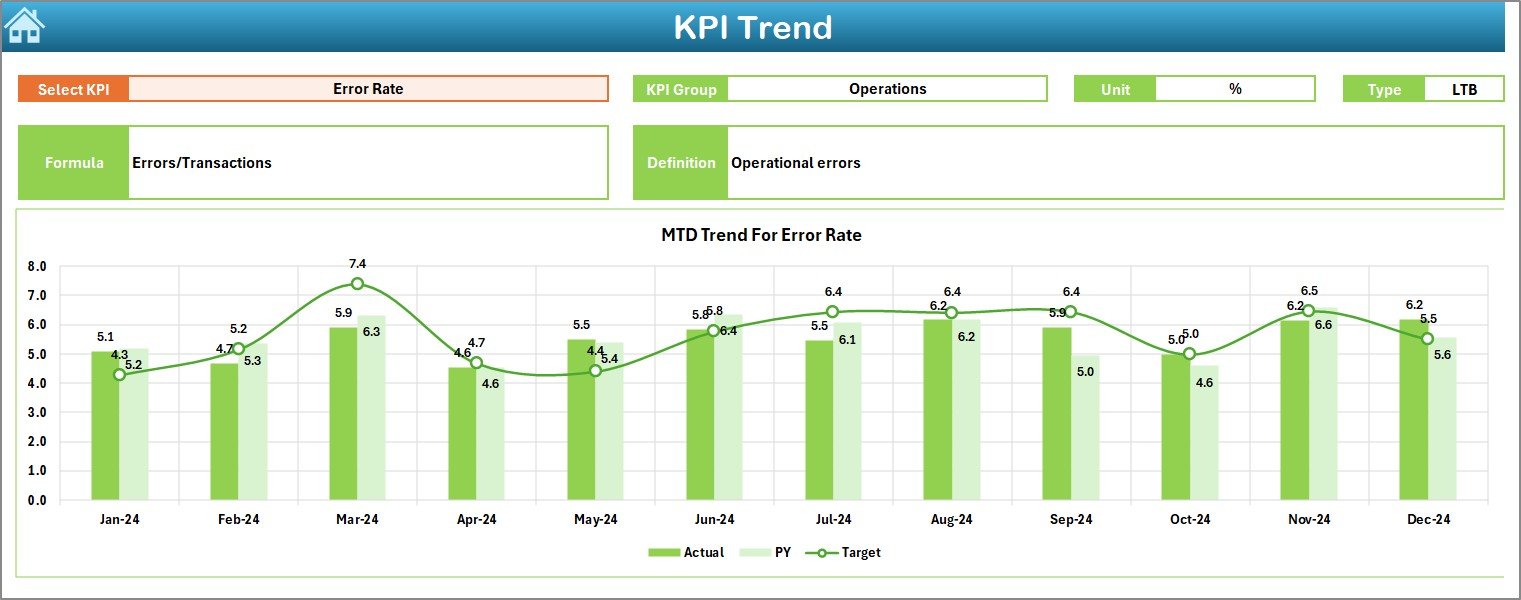
Trend Sheet – How Can You Track KPI Trends?
In the Trend Sheet, you choose the KPI Name from a drop-down in cell C3.
This sheet displays:
- KPI Group
- KPI Unit
- KPI Type (UTB or LTB)
- KPI Formula
- KPI Definition
You also see trend charts for:
- MTD Actual vs Target vs Previous Year
- YTD Actual vs Target vs Previous Year
This makes it easy to measure consistency, improvement, and risk.
Click to buy Pension Funds KPI Dashboard in Excel
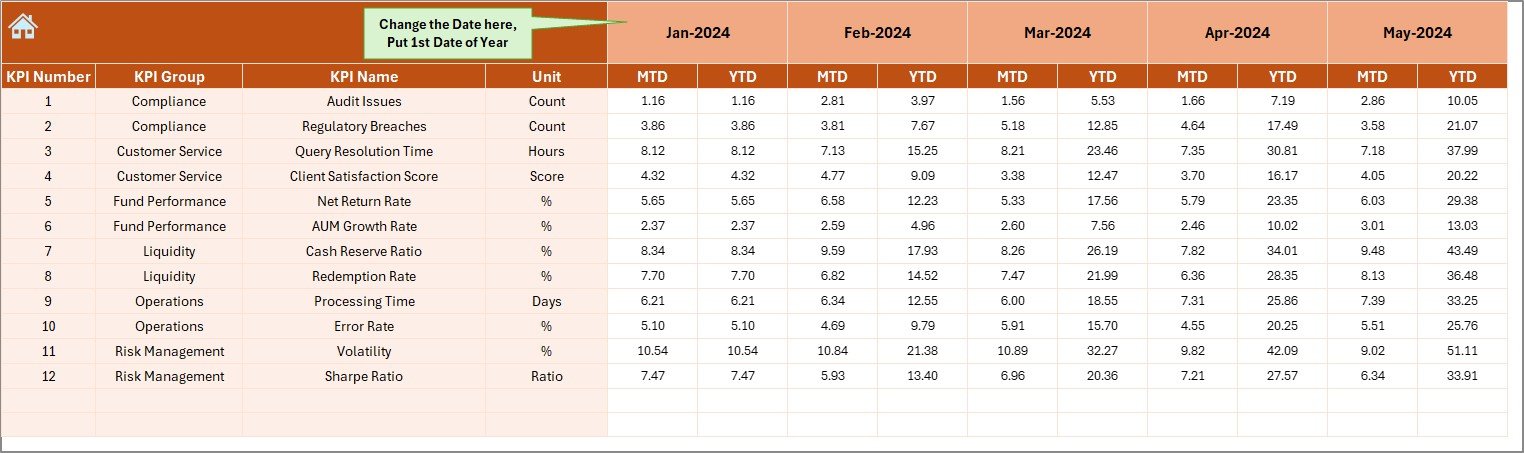
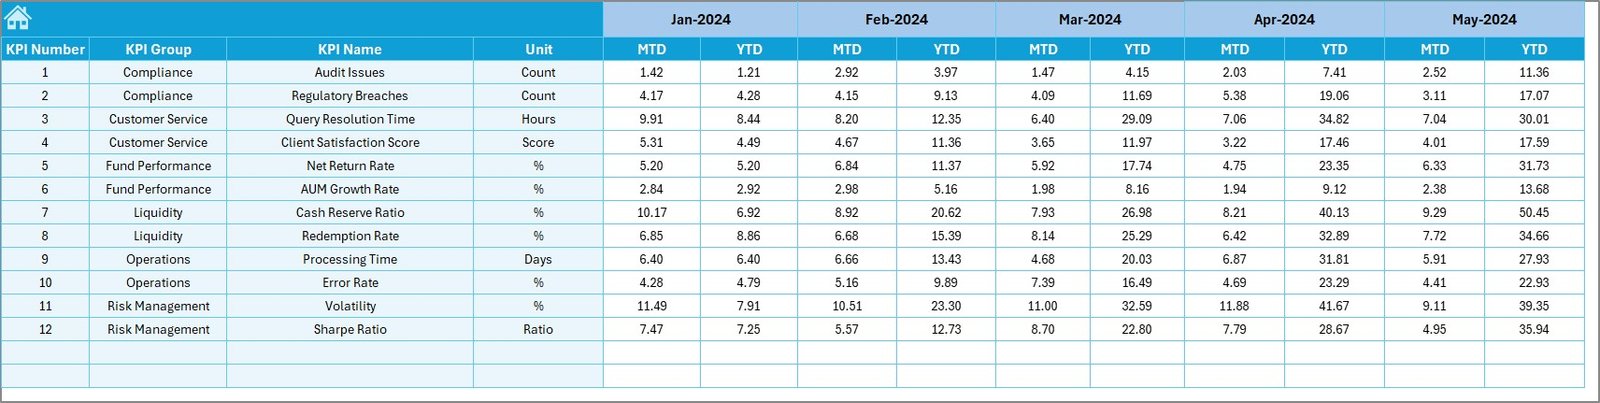
Actual Numbers Input Sheet – How Do You Enter Actual Data?
This sheet lets you enter MTD and YTD numbers for every KPI.
- You select the first month of the financial year in cell E1.
- When you change the month, the sheet updates accordingly.
This structure keeps data clean and avoids duplication.
Click to buy Pension Funds KPI Dashboard in Excel
Target Sheet – How Do You Set Monthly Goals?
In this sheet, you enter Target numbers for:
- Monthly (MTD) goals
- Year-to-date (YTD) goals
These numbers feed the main dashboard and trend charts, helping you evaluate performance easily.
Click to buy Pension Funds KPI Dashboard in Excel
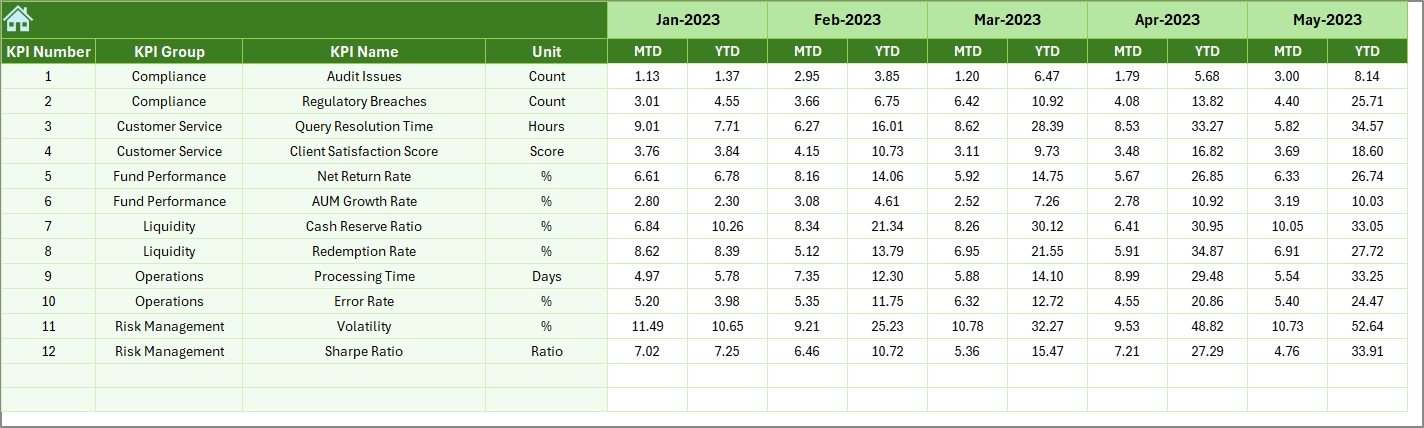
Previous Year Numbers Sheet – Why Do We Compare Past Performance?
This sheet stores the previous year’s data. You enter:
- MTD Actual
- YTD Actual
Since year-over-year comparison improves analysis, this sheet becomes very important.
Click to buy Pension Funds KPI Dashboard in Excel
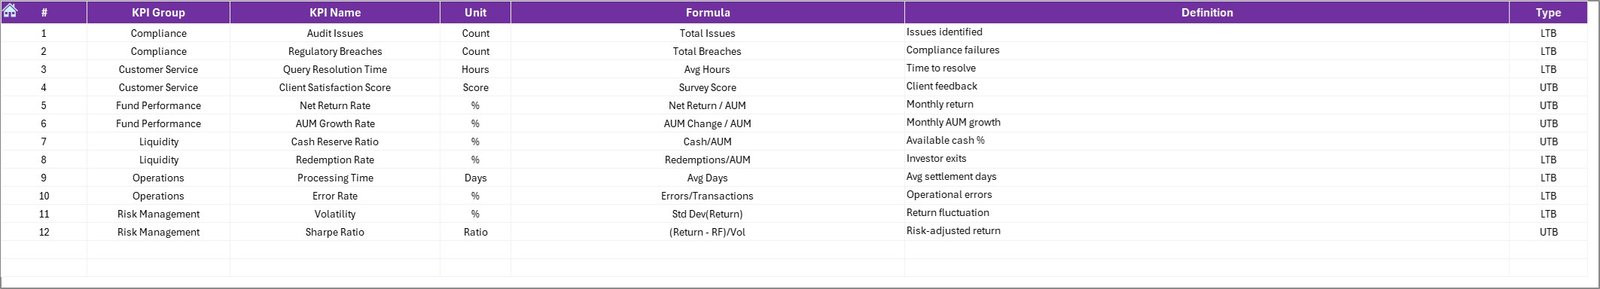
KPI Definition Sheet – How Do You Define KPIs Clearly?
This sheet holds all key details of each KPI:
- KPI Name
- KPI Group
- Unit of Measurement
- Formula
- Definition
- KPI Type
This is especially useful when you share the dashboard with your team.
Click to buy Pension Funds KPI Dashboard in Excel
Which KPIs Should You Track in a Pension Funds Dashboard?
You should always track KPIs that reflect fund performance, compliance, risk, cost, and returns. Below are some of the most common KPIs:
- Funding Ratio
Measures how well the plan can meet future benefit obligations.
- Return on Investments (ROI)
Shows the performance of investment portfolios.
- Contribution Levels
Tracks how much members or employers contribute.
- Benefit Payouts
Monitors the total pension payments released.
- Administrative Cost per Member
Highlights efficiency in operations.
- Asset Allocation Mix
Shows the proportion of stocks, bonds, and other instruments.
- Liquidity Ratio
Checks how quickly assets can convert into cash.
- Risk Score
Measures exposure to market fluctuations.
- Membership Growth
Tracks new members joining the pension fund.
- Claim Processing Time
Shows how fast pension claims receive approval.
Since these KPIs cover performance, financial health, and operations, the dashboard becomes a complete monitoring mechanism.
Advantages of the Pension Funds KPI Dashboard in Excel
When you start using this dashboard, you benefit in many ways.
You Improve Reporting Speed
You see all KPIs in one place, so you save hours every month.
You Reduce Manual Errors
Structured sheets reduce mistakes in calculations and entries.
You Compare Performance Smoothly
You check progress against targets and previous years instantly.
You Make Strong Financial Decisions
Insights help you manage risk and stabilize fund performance.
You Build Transparency
When you share the dashboard, everyone sees the same numbers.
You Enhance Professional Presentation
Beautiful charts and cards make reporting more appealing.
How to Use the Pension Funds KPI Dashboard Effectively?
If you want accurate insights, you must update three sheets regularly:
- Actual Numbers Input
- Target Sheet
- Previous Year Sheet
After updating these sheets, all other pages refresh with a single click.
Here is how you should use it step-by-step:
Step 1: Enter the first month of the financial year
- Update cell E1 in the Actual sheet.
- Step 2: Enter the Actual MTD and YTD numbers
- Fill numbers for each KPI.
- Step 3: Enter the Target numbers
- Update monthly and yearly goals.
- Step 4: Enter Previous Year numbers
- Add last year’s MTD and YTD values.
- Step 5: Select the month on the Dashboard sheet
- View and analyze results instantly.
- Step 6: Review Trends
Use the Trend sheet to understand long-term performance.
When you follow these steps, your reporting becomes smooth and reliable.
Best Practices for the Pension Funds KPI Dashboard in Excel
You can make your dashboard stronger by following these proven practices.
- Update Data on Time
Always enter Actual numbers by the same day every month.
- Keep KPI Definitions Clear
Use simple terms in the KPI Definition sheet to avoid confusion.
- Color-Code Your KPIs Wisely
Use green for good performance, red for risk, and yellow for caution.
- Review Trends Monthly
Regular trend analysis helps you catch issues early.
- Use Simple Units and Short Names
Short KPI names improve readability on dashboards.
- Validate Data Before Updating
Check numbers to avoid wrong inputs.
- Protect Formulas
Lock calculation cells in Excel to prevent accidental edits.
- Create Backups
Always keep a copy of the file before major changes.
How Can a Pension Funds KPI Dashboard Improve Fund Stability?
A pension fund stays stable only when you monitor risks, control expenses, and understand fund health clearly. This dashboard helps because it:
- Shows long-term trends
- Warns you about performance dips
- Highlights increases or decreases in contributions
- Tracks benefits released
- Compares past and present numbers
- Gives clarity on asset management
Therefore, you make decisions based on data rather than assumptions.
How Does the Dashboard Help Pension Fund Managers?
Pension fund managers use this dashboard to:
- Prepare monthly reports
- Present data to management
- Analyze member growth
- Track liabilities
- Check fund sufficiency
- Assess investment performance
- Review administration efficiency
Since all of these tasks appear in one file, the dashboard becomes a key management asset.
Conclusion
A Pension Funds KPI Dashboard in Excel is one of the most powerful tools for any pension management team. It organizes your data, simplifies reporting, and provides real-time insights for better decisions. Because the dashboard includes dedicated sheets for Actual numbers, Targets, KPI definitions, trends, and previous year comparisons, you never lose track of performance.
When you use the dashboard with discipline and regularly update the inputs, you improve fund monitoring, strengthen analysis, and build trust through transparency.
Frequently Asked Questions (FAQ)
- What is a Pension Funds KPI Dashboard in Excel?
It is a structured Excel-based tool that helps you track pension fund KPIs using visuals, formulas, and automated reports.
- Which KPIs should I track?
You should track KPIs like Funding Ratio, ROI, Contribution Levels, Benefit Payouts, Liquidity Ratio, and Asset Allocation.
- Who should use this dashboard?
Pension fund managers, actuaries, accountants, auditors, and finance analysts should use it.
- Can I add new KPIs to the dashboard?
Yes, you can easily add new KPIs through the KPI Definition sheet.
- How often should I update the dashboard?
You should update it monthly for MTD data and yearly for YTD consolidation.
- Does it help in investment analysis?
Yes, trend charts and Actual vs Target comparisons help in investment monitoring.
- Can I use this dashboard for reporting?
Yes, you can share it with your management team to present fund performance clearly.
- Do I need advanced Excel knowledge?
No, you only need basic Excel understanding to use this dashboard smoothly.
Visit our YouTube channel to learn step-by-step video tutorials
Watch the step-by-step video tutorial:
Click to buy Pension Funds KPI Dashboard in Excel