In the ever-evolving pharmaceutical industry, data drives innovation, quality, and growth. From drug development and manufacturing efficiency to sales performance and regulatory compliance, every decision depends on accurate insights. However, managing hundreds of data points across multiple departments can be overwhelming.
That’s where the Pharmaceuticals KPI Dashboard in Power BI becomes a game-changer.
This ready-to-use dashboard empowers pharmaceutical organizations to track, measure, and analyze all key performance indicators (KPIs) in one interactive platform.
Whether you’re monitoring production output, research timelines, sales growth, or compliance metrics, this Power BI dashboard transforms raw data into actionable intelligence — helping you make faster, data-driven decisions.
Click to buy Pharmaceuticals KPI Dashboard in Power BI
What Is a Pharmaceuticals KPI Dashboard in Power BI?
A Pharmaceuticals KPI Dashboard in Power BI is an interactive data visualization tool designed specifically for pharmaceutical companies. Built using Microsoft Power BI and Excel, this dashboard provides a real-time view of operational, research, and sales performance metrics across the entire organization.
It consolidates multiple Excel data sheets into one powerful analytics platform.
Users can monitor Month-to-Date (MTD) and Year-to-Date (YTD) metrics, compare performance with targets and previous year results, and use visual indicators like green/red arrows to identify improvement areas instantly.
How Does the Dashboard Work?
The Pharmaceuticals KPI Dashboard in Power BI connects seamlessly with Excel-based data sources. You simply update the Actual and Target values in Excel, and Power BI automatically refreshes all visuals and metrics.
The dashboard is divided into three major pages:
- Summary Page – A quick snapshot of all KPIs.
- KPI Trend Page – A deeper look into performance trends.
- KPI Definition Page – A drill-through page to view KPI formulas and definitions.
Each page plays a crucial role in transforming data into meaningful stories.
Structure and Pages of the Dashboard
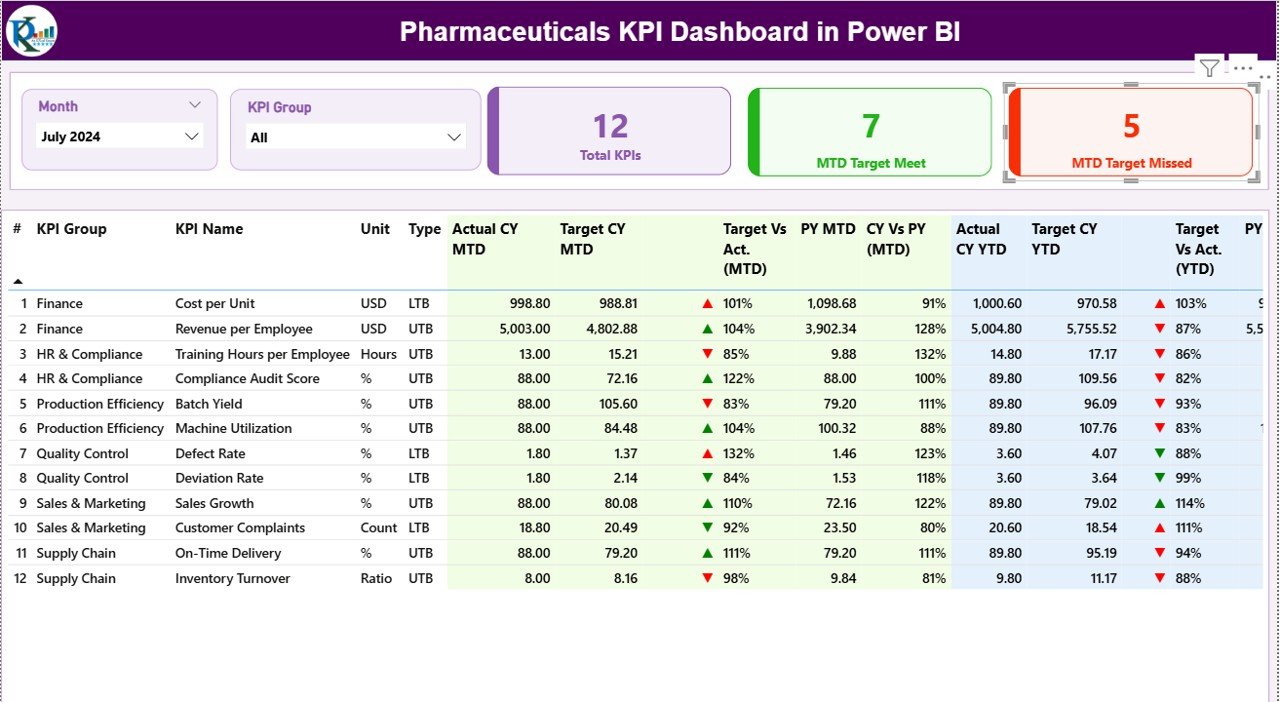
Summary Page
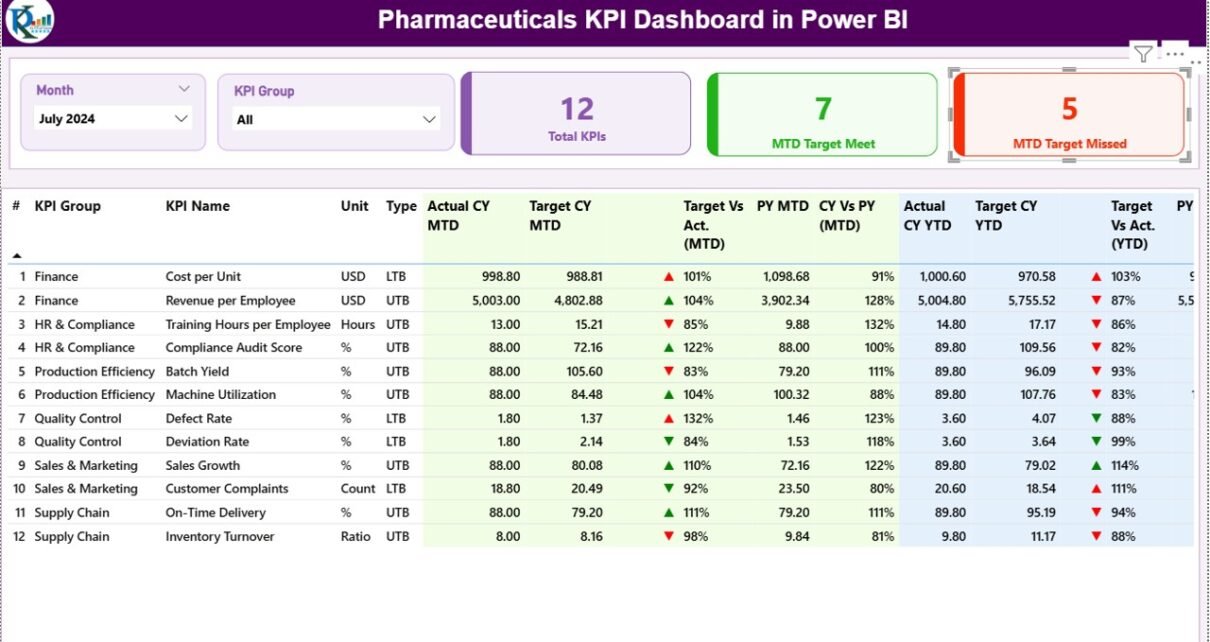
The Summary Page acts as the main control center of the dashboard.
At the top, users can select filters for Month and KPI Group using slicers, allowing dynamic analysis for specific periods or departments.
Key highlights include:
- KPI Overview Cards:
- Total KPIs Count
- MTD Target Met Count
- MTD Target Missed Count
- Detailed KPI Table:
Displays each KPI with real-time metrics including: - KPI Number
- KPI Group
- KPI Name
- Unit
- Type (LTB/UTB)
- Actual CY MTD / Target CY MTD
- Target vs Actual (MTD %)
- Previous Year MTD
- CY vs PY (MTD %)
- Actual CY YTD / Target CY YTD
- Target vs Actual (YTD %)
- Previous Year YTD
- CY vs PY (YTD %)
- Visual Indicators:
Red and green arrow icons (▼ ▲) instantly show whether a KPI is performing below or above target — making it easy to spot problem areas.
This page provides a clear “at-a-glance” overview of organizational performance.
Click to buy Pharmaceuticals KPI Dashboard in Power BI
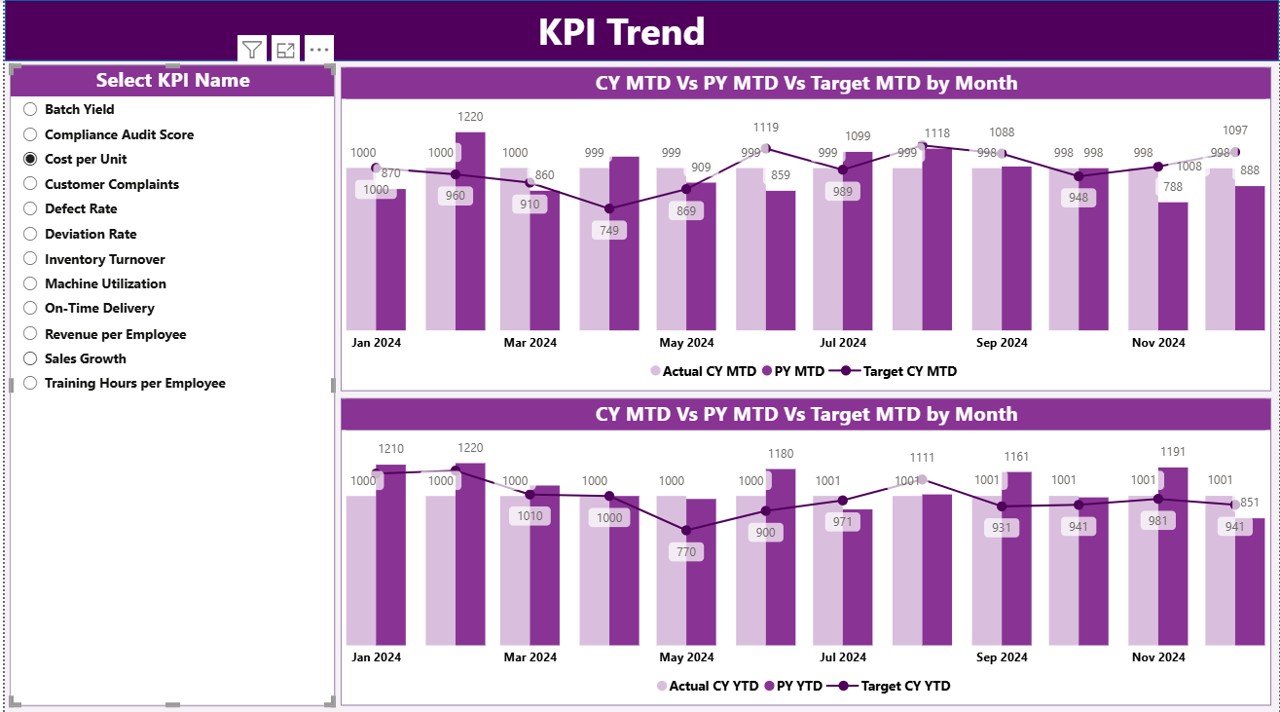
KPI Trend Page
The KPI Trend Page focuses on the visual analysis of performance data.
Here, you can select any KPI from the left-side slicer to see its month-wise comparison.
The page contains two combo charts that show:
- Actual, Target, and Previous Year numbers for MTD
- Actual, Target, and Previous Year numbers for YTD
These visual comparisons help managers identify seasonal trends, growth patterns, and anomalies — essential for strategic planning in pharmaceuticals.
Click to buy Pharmaceuticals KPI Dashboard in Power BI
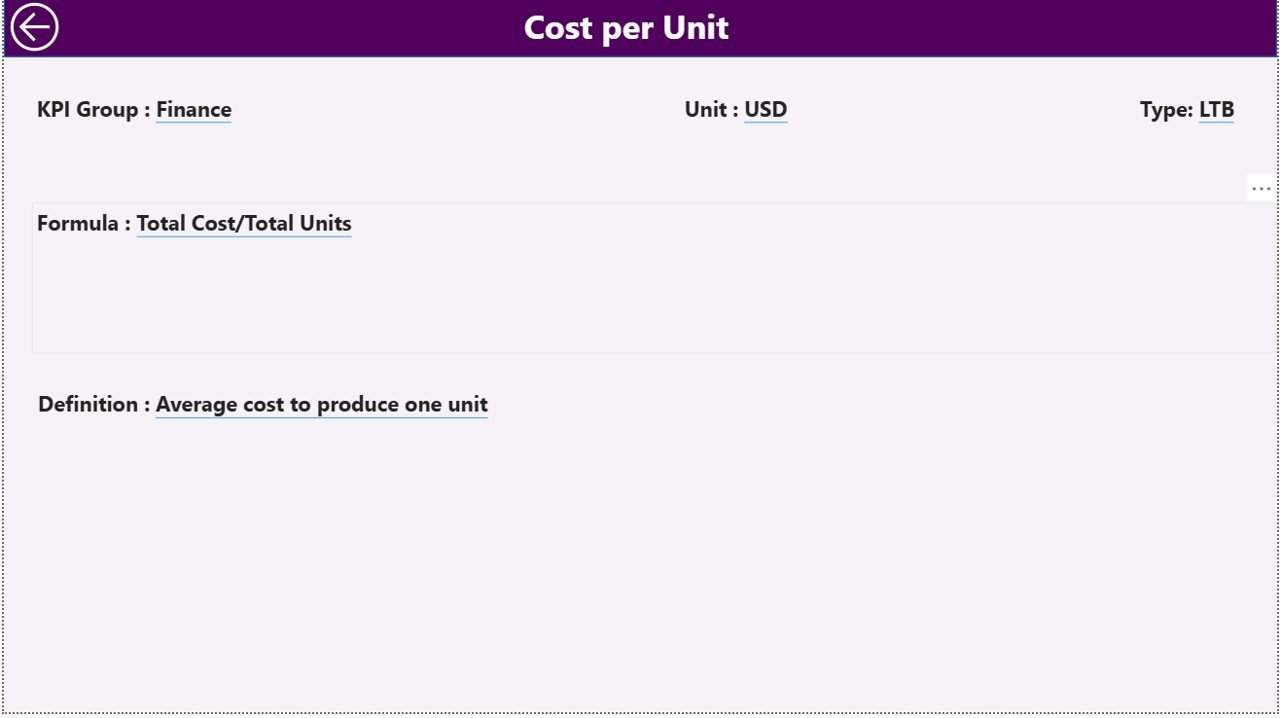
KPI Definition Page
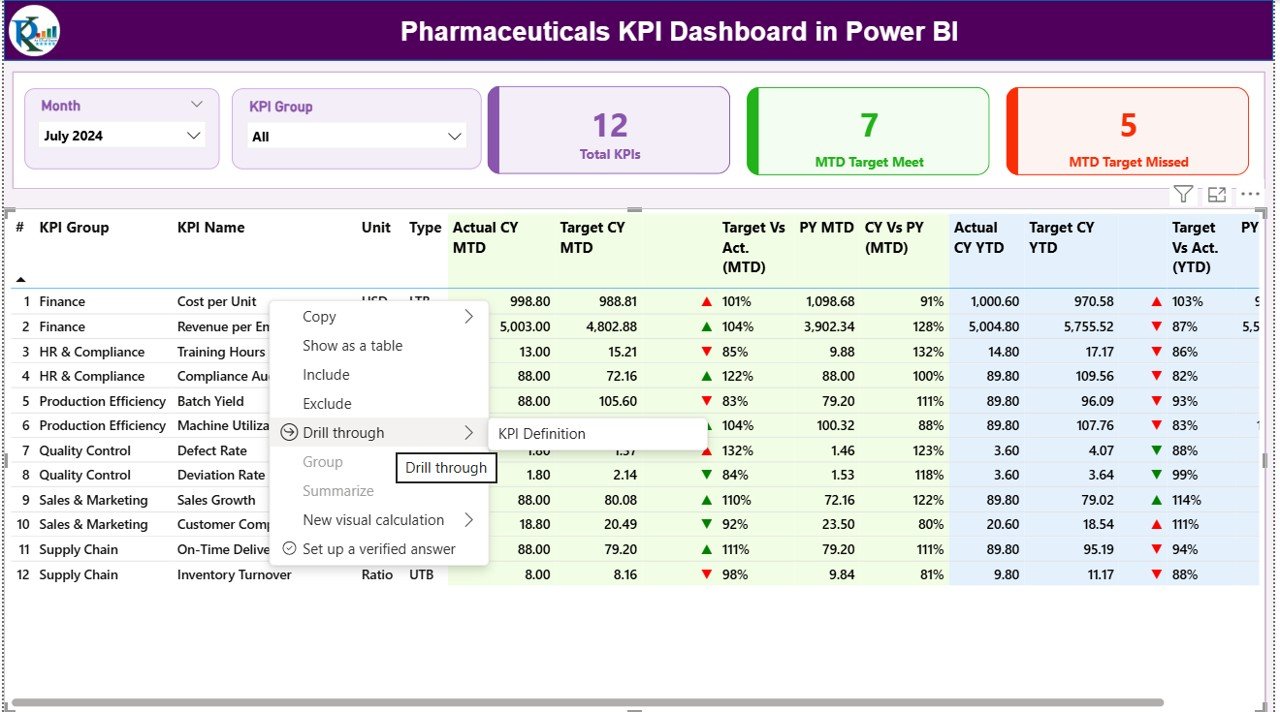
This hidden drill-through page is a reference sheet for analysts.
By right-clicking any KPI on the Summary Page, you can navigate (drill through) to this section.
Here, you’ll find:
- KPI Number
- KPI Group
- KPI Name
- Unit of Measurement
- Formula
- Definition
- Type (LTB/UTB)
This page ensures full transparency by allowing users to understand the logic behind every metric. To return to the Summary Page, you simply click the “Back” button in the top-left corner.
Click to buy Pharmaceuticals KPI Dashboard in Power BI
Input_Actual Sheet
- Contains Actual performance data for each KPI.
- Columns:
- KPI Name
- Month (First day of the month, e.g., 1-Jan-2024)
- MTD Actual Value
- YTD Actual Value
Input_Target Sheet
- Contains Target data for the same KPIs.
- Columns mirror the Actual sheet to ensure consistency.
- Update these numbers monthly to keep your dashboard accurate.
KPI Definition Sheet
- Contains details for all KPIs including:
- KPI Number
- KPI Group
- KPI Name
- Unit
- Formula
- Definition
- Type (LTB or UTB)
This simple and structured format ensures smooth Power BI integration without coding or complex setup.
Click to buy Pharmaceuticals KPI Dashboard in Power BI
Importance of KPI Tracking in the Pharmaceutical Industry
Pharmaceutical companies operate in a high-stakes environment — where compliance, quality, and performance can directly impact human lives.
Tracking KPIs in real time ensures that processes remain efficient, safe, and profitable.
Here are a few critical areas where KPI tracking adds immense value:
Research & Development (R&D)
- Monitors clinical trial progress, research timelines, and approval rates.
- Helps assess R&D expenditure vs. outcomes.
- Tracks innovation success rates for new molecules.
Manufacturing & Production
- Tracks Batch Yield %, Defect Rate %, Downtime, and Cycle Efficiency.
- Ensures Good Manufacturing Practices (GMP) compliance.
- Identifies bottlenecks early through trend analysis.
Sales & Marketing
- Monitors Sales Growth %, Market Share, and Customer Acquisition Cost.
- Tracks Product Launch Performance and Regional Sales Variations.
Quality & Compliance
- Measures Audit Pass %, Recall Rate, and Regulatory Compliance Score.
- Monitors adherence to FDA, EMA, or WHO standards.
Supply Chain & Distribution
- Evaluates On-Time Delivery %, Inventory Turnover, and Stockout Frequency.
By monitoring these indicators collectively, the dashboard ensures that every function aligns with the company’s strategic goals.
Advantages of the Pharmaceuticals KPI Dashboard in Power BI
Implementing a Power BI dashboard for pharmaceutical KPIs offers numerous advantages:
Real-Time Visibility
Get instant access to updated MTD and YTD metrics. Make faster decisions using live data from your Excel source.
Enhanced Performance Monitoring
Visual icons, color coding, and charts make it easy to see which KPIs are meeting or missing targets.
Error-Free Data Management
Eliminate manual report generation. Power BI automates data refresh, reducing human error and saving time.
Improved Compliance Tracking
Track regulatory metrics across facilities, ensuring quality standards and reducing compliance risks.
Streamlined Reporting
Generate comprehensive visual reports for management meetings in minutes, not hours.
Cost and Time Efficiency
Centralized tracking reduces duplication of effort and ensures teams focus on actions that improve outcomes.
Best Practices for Using the Pharmaceuticals KPI Dashboard in Power BI
To maximize the value of your dashboard, follow these best practices:
Define KPIs Clearly
Ensure every KPI has a clear definition, formula, and owner. Use the KPI Definition page to maintain consistency.
Update Data Monthly
Regularly update Actual and Target Excel sheets with the latest performance numbers.
Use Slicers for Quick Insights
Apply filters like Month and KPI Group to analyze data across different business areas.
Focus on Color Indicators
Use green arrows for positive performance (UTB) and red for areas needing attention (LTB).
Maintain Data Quality
Validate Excel entries to prevent errors. Accurate data equals reliable insights.
Automate Refresh Schedule
Use Power BI’s automatic refresh to update visuals daily or weekly without manual intervention.
Drill Down for Details
Leverage the drill-through functionality to understand the cause of KPI variations.
Why Use Power BI for Pharmaceutical KPIs?
Power BI stands out as the ideal platform for pharmaceutical analytics due to its:
- Ease of Integration: Connects with Excel, ERP, CRM, and databases seamlessly.
- Dynamic Visualization: Displays complex data through interactive charts and visuals.
- Scalability: Suitable for both small pharmaceutical labs and global enterprises.
- Data Security: Supports role-based access, ensuring sensitive data remains protected.
- Cost Efficiency: Affordable compared to traditional BI software.
In short, Power BI empowers pharma companies to turn data into decisions.
Conclusion
The Pharmaceuticals KPI Dashboard in Power BI is more than a reporting tool — it’s a strategic asset.
By combining Excel’s simplicity with Power BI’s intelligence, this dashboard enables pharmaceutical companies to monitor every operational dimension — from R&D and production to sales and compliance — in one unified system.
With automated updates, visual storytelling, and clear KPI tracking, decision-makers can act faster, allocate resources better, and maintain compliance with ease.
In short, this dashboard brings clarity to complexity, helping your pharmaceutical organization stay ahead in a competitive, data-driven world.
Frequently Asked Questions (FAQs)
What is the purpose of a Pharmaceuticals KPI Dashboard in Power BI?
It helps pharmaceutical companies track key performance indicators like research efficiency, production yield, sales performance, and compliance metrics in one interactive platform.
How often should I update my dashboard data?
You should update your Excel data monthly or set up automatic refreshes in Power BI to maintain real-time accuracy.
Can I customize KPIs based on my company’s needs?
Yes. You can modify, add, or remove KPIs easily by updating the KPI Definition sheet in Excel.
Do I need coding knowledge to use this dashboard?
No. The dashboard is fully ready-to-use and designed for professionals without coding experience.
What are UTB and LTB in KPI types?
- UTB (Upper the Better): Higher values indicate better performance (e.g., Sales Growth %).
- LTB (Lower the Better): Lower values indicate better performance (e.g., Defect Rate %).
Can I share this dashboard with my team?
Absolutely. You can publish it to Power BI Service and grant secure access to specific team members.
Is this dashboard suitable for small pharmaceutical firms?
Yes. It scales easily and can be used by small labs, mid-sized companies, or multinational pharmaceutical enterprises.
Visit our YouTube channel to learn step-by-step video tutorials
Watch the step-by-step video tutorial:
Click to buy Pharmaceuticals KPI Dashboard in Power BI