Managing procurement activities in port operations requires accuracy, transparency, and continuous cost control. Ports deal with large purchase volumes, multiple vendors, strict delivery timelines, and complex cost structures. However, when procurement data remains scattered across spreadsheets or manual reports, decision-making becomes slow and error-prone.
That is exactly why a Port Procurement Dashboard in Excel becomes an essential tool for modern port authorities, procurement teams, and operations managers.
This ready-to-use dashboard converts raw procurement data into clear, visual, and actionable insights. It helps teams track planned costs, actual costs, delivery performance, vendor efficiency, and risk indicators—all from a single Excel file.
In this article, we will explain the Port Procurement Dashboard in Excel, its structure, key metrics, charts, advantages, best practices, and real-world use cases.
What Is a Port Procurement Dashboard in Excel?
A Port Procurement Dashboard in Excel is a structured reporting solution designed to monitor and analyze procurement performance in port operations. It consolidates procurement data such as planned cost, actual cost, delivery status, vendor performance, and delays into a centralized dashboard.
Because the dashboard is built in Microsoft Excel, it offers:
-
Familiar and user-friendly interface
-
Automated calculations and visuals
-
Month-wise and category-wise analysis
-
Easy customization
-
No dependency on expensive BI tools
As a result, procurement teams gain faster insights and better control over port purchasing activities.
Why Do Ports Need a Procurement Dashboard?
Click to Buy Port Procurement Dashboard in Excel
Port procurement involves high-value contracts and time-sensitive deliveries. Without a proper dashboard, teams face challenges such as:
-
Cost overruns
-
Delivery delays
-
Poor vendor accountability
-
Lack of visibility into procurement status
-
Inefficient risk management
A Port Procurement Dashboard solves these problems by offering real-time visibility, structured analysis, and data-driven insights.
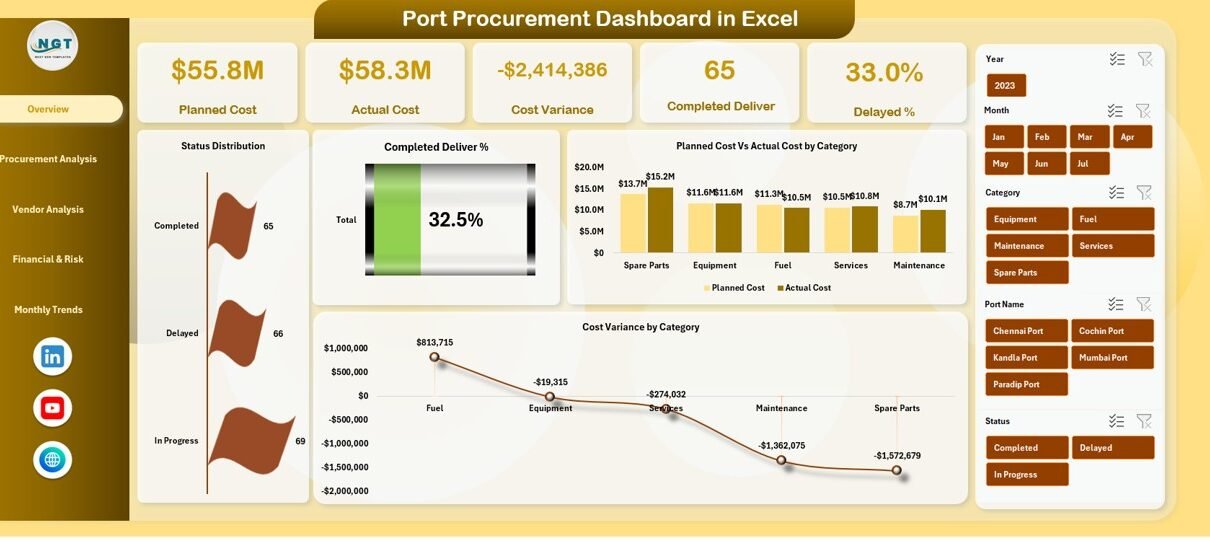
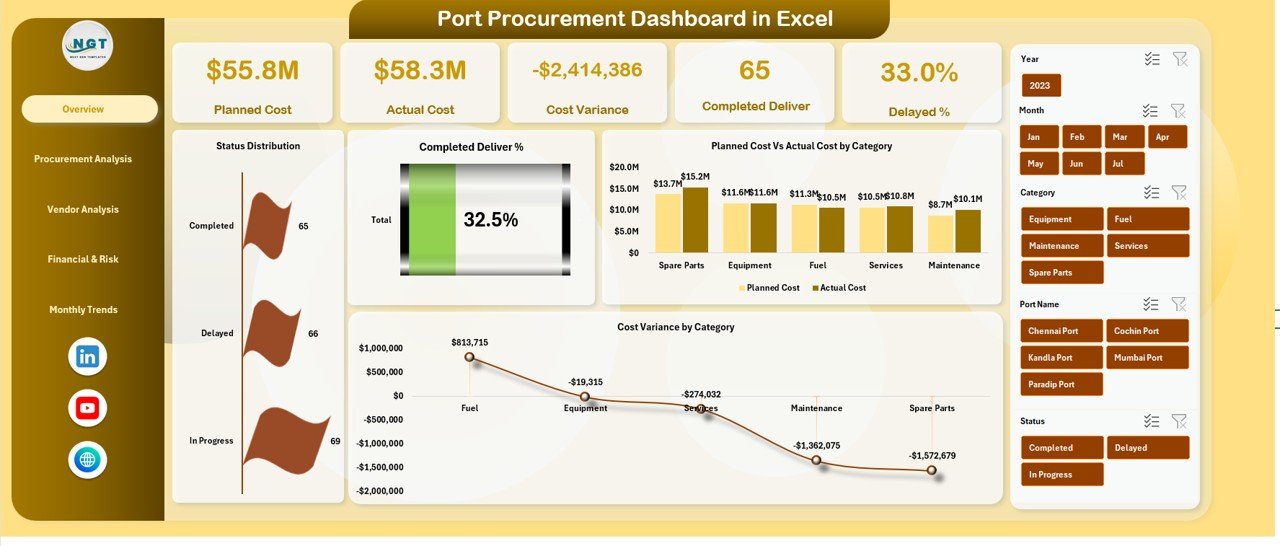
Overview Sheet Tab – Dashboard Structure
The Overview Sheet acts as the main control panel of the dashboard. It presents key procurement KPIs using cards and charts, allowing stakeholders to understand performance at a glance.
Key KPI Cards
The dashboard displays the following summary cards:
-
Planned Cost – Total estimated procurement cost
-
Actual Cost – Real cost incurred so far
-
Cost Variance – Difference between planned and actual cost
-
Completed Deliver – Percentage of completed deliveries
-
Delayed % – Percentage of delayed procurement deliveries
These KPIs immediately highlight financial health and delivery performance.
Overview Charts
The Overview tab includes the following charts:
1. Status Distribution
Shows the distribution of procurement orders by status (Completed, In Progress, Delayed).
2. Completed Deliver %
Visualizes the overall delivery completion rate.
3. Planned Cost vs Actual Cost by Category
Helps identify cost overruns or savings across procurement categories.
4. Cost Variance by Category
Highlights categories where spending deviates from the plan.
These charts allow managers to identify issues quickly and take corrective action.
Click to Buy Port Procurement Dashboard in Excel
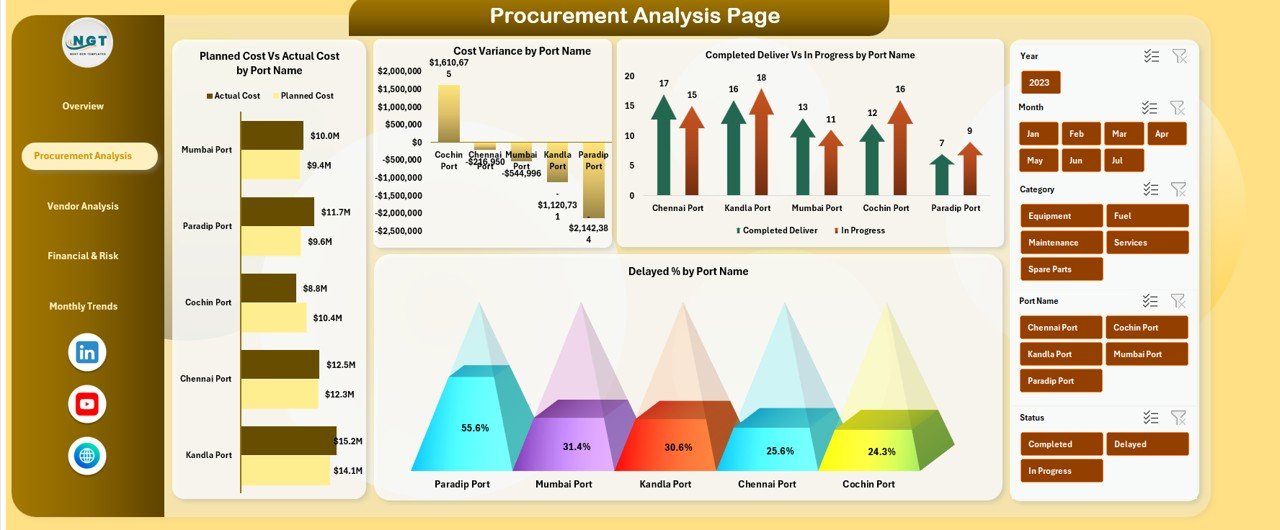
Port Performance Analysis
This section focuses on performance across different ports.
Charts Included
-
Planned Cost vs Actual Cost by Port Name
-
Cost Variance by Port Name
-
Completed Deliver vs In Progress by Port Name
-
Delayed % by Port Name
Through this analysis, procurement teams can:
-
Compare procurement efficiency across ports
-
Identify ports with higher delays
-
Track cost discipline port-wise
-
Allocate resources more effectively
Click to Buy Port Procurement Dashboard in Excel
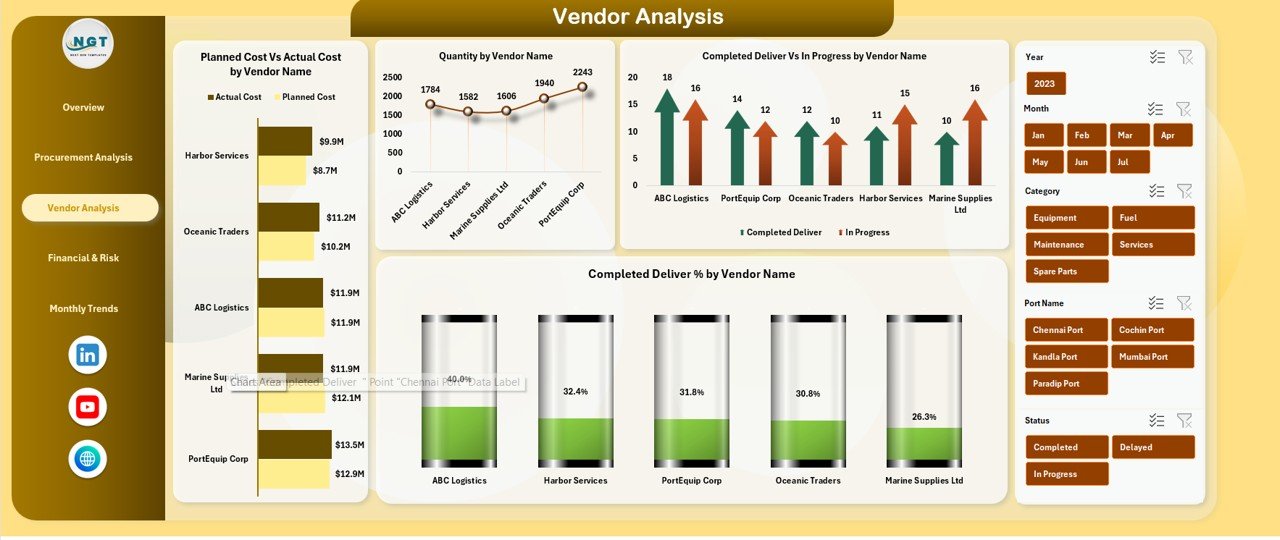
Vendor and Bidder Analysis
Vendor performance directly impacts procurement success. This section evaluates vendors based on cost, quantity, and delivery.
Charts Included
-
Planned Cost vs Actual Cost by Vendor Name
-
Quantity by Vendor Name
-
Completed Deliver vs In Progress by Vendor
-
Completed Deliver % by Vendor Name
These insights help teams:
-
Identify reliable suppliers
-
Detect vendors causing delays
-
Improve negotiation strategies
-
Strengthen vendor accountability
Click to Buy Port Procurement Dashboard in Excel
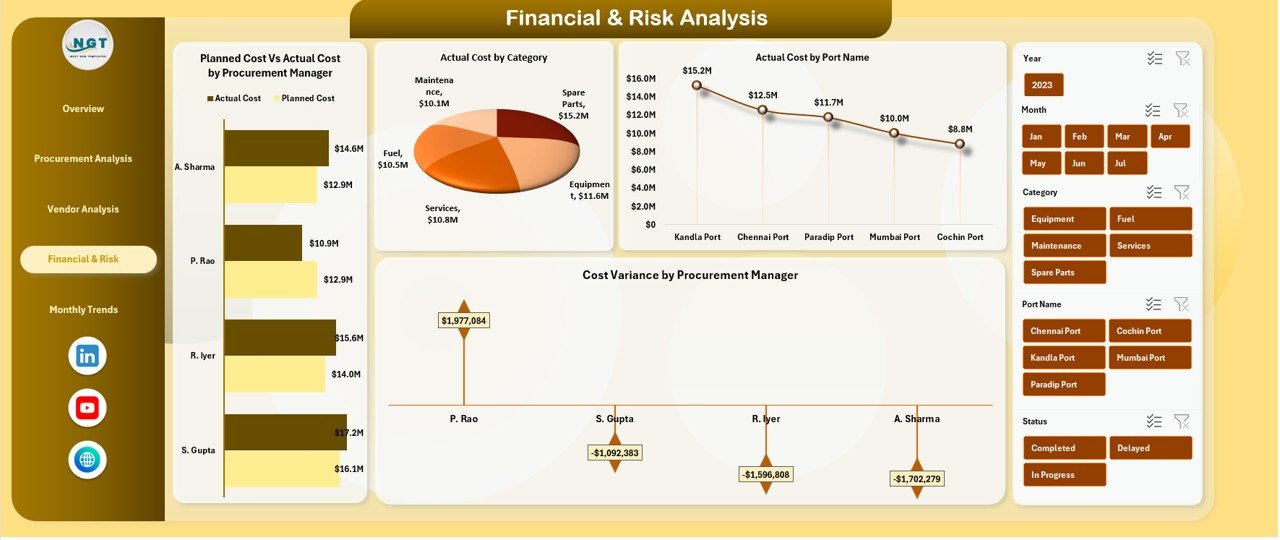
Financial & Risk Analysis
This section highlights financial exposure and procurement risks.
Charts Included
-
Planned Cost vs Actual Cost by Procurement Manager
-
Actual Cost by Category
-
Actual Cost by Port Name
-
Cost Variance by Procurement Manager
With this view, management can:
-
Monitor procurement manager performance
-
Control financial risks
-
Identify overspending trends
-
Improve internal accountability
Click to Buy Port Procurement Dashboard in Excel
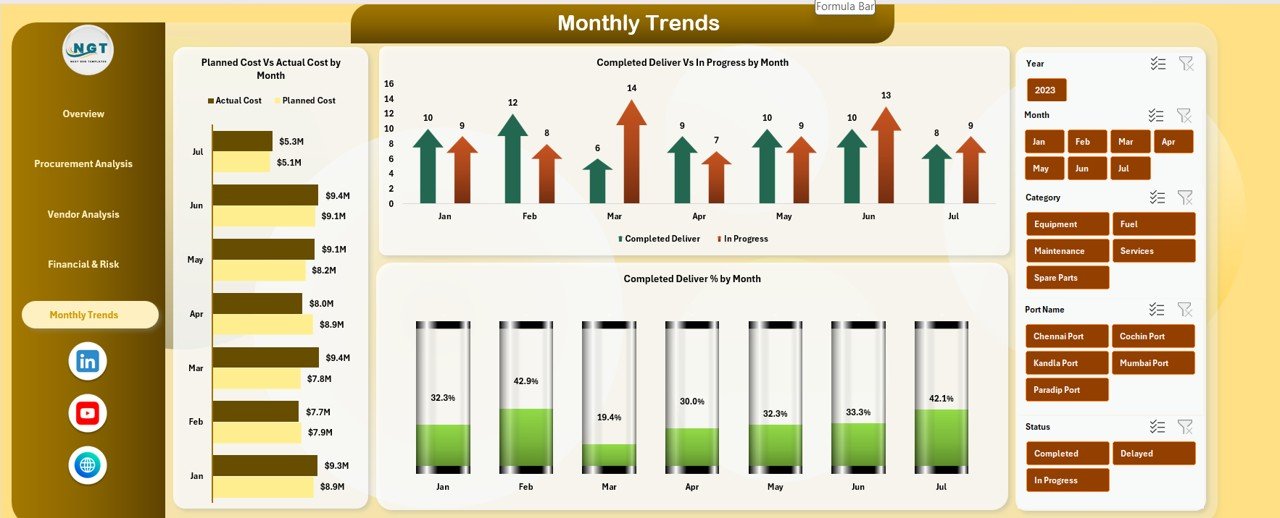
Monthly Trends Analysis
Understanding trends over time is critical for long-term improvement.
Charts Included
-
Planned Cost vs Actual Cost by Month
-
Completed Deliver vs In Progress by Month
-
Completed Deliver % by Month
These trends help organizations:
-
Identify seasonal procurement patterns
-
Improve monthly planning
-
Forecast future procurement needs
-
Reduce recurring delays
Click to Buy Port Procurement Dashboard in Excel
Advantages of Using a Port Procurement Dashboard in Excel
1. Centralized Procurement Visibility
All procurement metrics remain in one place, eliminating data silos.
2. Better Cost Control
Real-time cost variance tracking prevents overspending.
3. Improved Delivery Performance
Delay analysis helps teams act before issues escalate.
4. Vendor Accountability
Vendor-wise insights improve supplier management.
5. Faster Decision-Making
Visual dashboards replace time-consuming manual reports.
6. Easy Customization
Users can add new ports, vendors, or categories easily.
Opportunities for Improvement in Port Procurement Dashboards
Click to Buy Port Procurement Dashboard in Excel
Even a powerful dashboard can evolve further. Some improvement opportunities include:
-
Adding automated data imports from ERP systems
-
Introducing SLA tracking for vendors
-
Implementing alert systems for high cost variance
-
Adding forecast and budget planning modules
-
Including contract compliance metrics
These enhancements make the dashboard more predictive and strategic.
Best Practices for Using a Port Procurement Dashboard
Click to Buy Port Procurement Dashboard in Excel
-
Update procurement data regularly
-
Maintain consistent naming for categories and vendors
-
Review cost variance weekly
-
Use monthly trends for planning meetings
-
Share dashboard insights with stakeholders
-
Combine dashboard insights with procurement policies
Following these practices ensures maximum value from the dashboard.
Who Can Use This Dashboard?
-
Port Authorities
-
Procurement Managers
-
Supply Chain Teams
-
Finance Departments
-
Operations Managers
-
Risk & Compliance Teams
The dashboard supports both operational and strategic decision-making.
Conclusion
Click to Buy Port Procurement Dashboard in Excel
A Port Procurement Dashboard in Excel transforms complex procurement data into actionable insights. It enables ports to control costs, improve delivery performance, manage vendors effectively, and reduce financial risks. Because it is built in Excel, it remains accessible, flexible, and cost-effective.
Visit our YouTube channel to learn step-by-step video tutorials
Watch the step-by-step video tutorial:
Click to Buy Port Procurement Dashboard in Excel