Port authorities, logistics operators, and maritime infrastructure companies manage complex tender processes every year. These tenders involve large financial values, multiple ports, cargo types, vendors, and long bid cycles. However, when tender data stays scattered across Excel files, emails, and PDFs, decision-making becomes slow and risky.
That is exactly why a Port Tender Dashboard in Excel becomes a powerful and practical solution.
This ready-to-use Port Tender Dashboard transforms raw tender data into clear, visual, and actionable insights. It helps management track tender performance, monitor profitability, evaluate vendors, analyze risk, and identify trends—all from one centralized Excel dashboard.
In this article, you will learn what a Port Tender Dashboard in Excel is, how it works, its complete dashboard structure, key charts, business advantages, improvement opportunities, best practices, and frequently asked questions.
What Is a Port Tender Dashboard in Excel?
A Port Tender Dashboard in Excel is a structured reporting and analytics tool designed to track and analyze port-related tenders in one place. Instead of manually reviewing tender lists and financial statements, this dashboard converts tender data into interactive charts and KPI cards.
It helps users track:
- Total number of tenders
- Estimated tender value
- Profit and profit margin
- Awarded vs under-evaluation tenders
- Vendor and bidder performance
- Cargo-wise financial exposure
- Monthly tender trends
Because the dashboard is built in Excel, it works without expensive BI tools and supports quick updates and easy customization.
Overview Sheet Tab – Executive Summary
Click to Buy Port Tender Dashboard in Excel
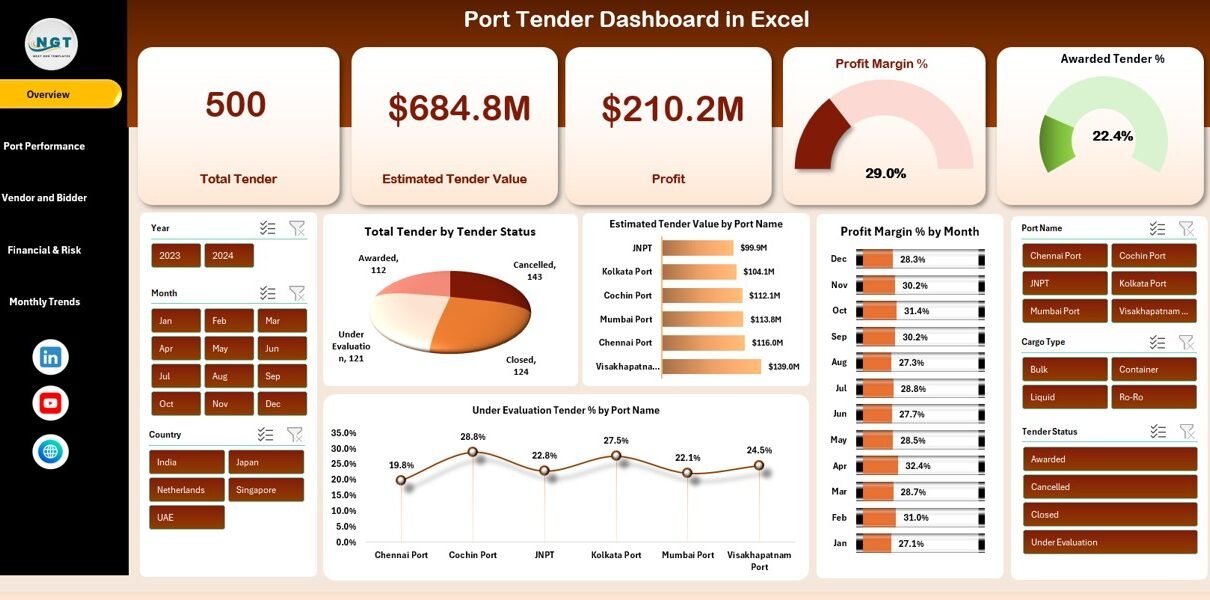
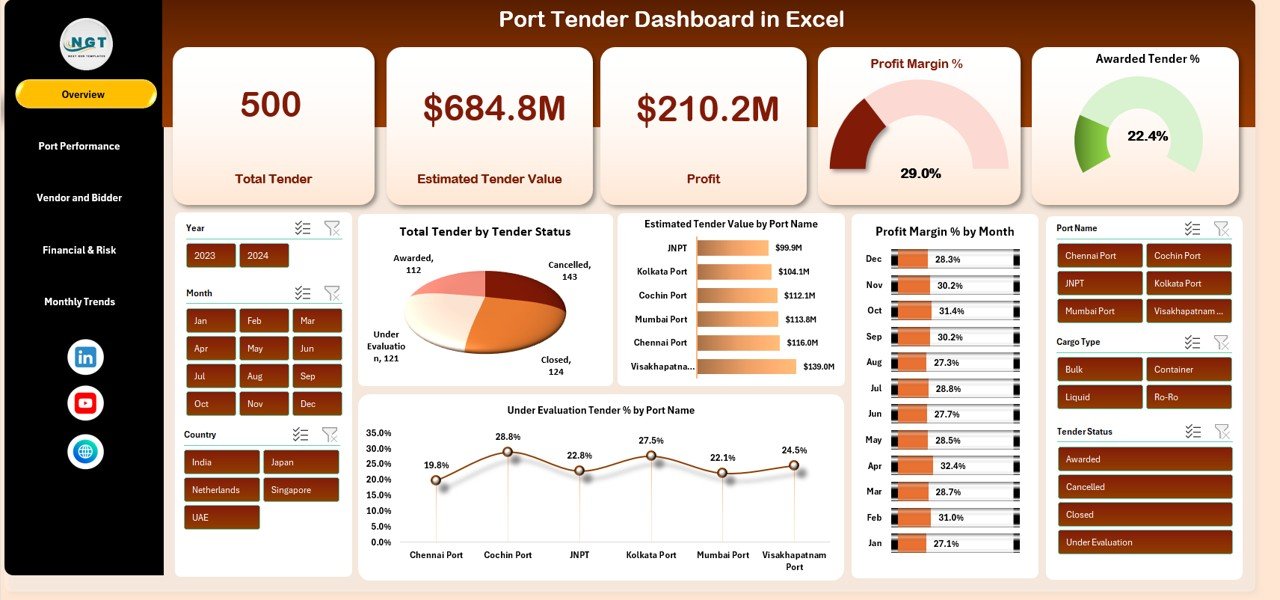
The Overview Sheet is the main landing page of the dashboard. It gives senior management an instant snapshot of overall tender performance.
KPI Cards on Overview Page
The dashboard displays the following KPI cards:
-
Total Tenders – Total number of tenders tracked
-
Estimated Tender Value – Total estimated value of all tenders
-
Profit – Expected profit from awarded and potential tenders
-
Profit Margin % – Overall profitability ratio
-
Awarded Tender % – Percentage of tenders successfully awarded
These cards provide quick clarity on scale, profitability, and success rate.
Charts on Overview Page
Total Tender by Tender Status
Shows the number of tenders by status such as:
- Awarded
- Under Evaluation
- Open
- Closed
This chart helps track tender pipeline health.
Estimated Tender Value by Port Name
Displays how tender value distributes across different ports.
It helps identify high-value ports and strategic focus areas.
Profit Margin % by Month
Tracks monthly profitability trends.
It helps management understand seasonality and cost efficiency.
Under Evaluation Tender % by Port Name
Highlights ports where tenders remain under evaluation.
It supports faster follow-ups and risk mitigation.
Port Performance Analysis
Click to Buy Port Tender Dashboard in Excel
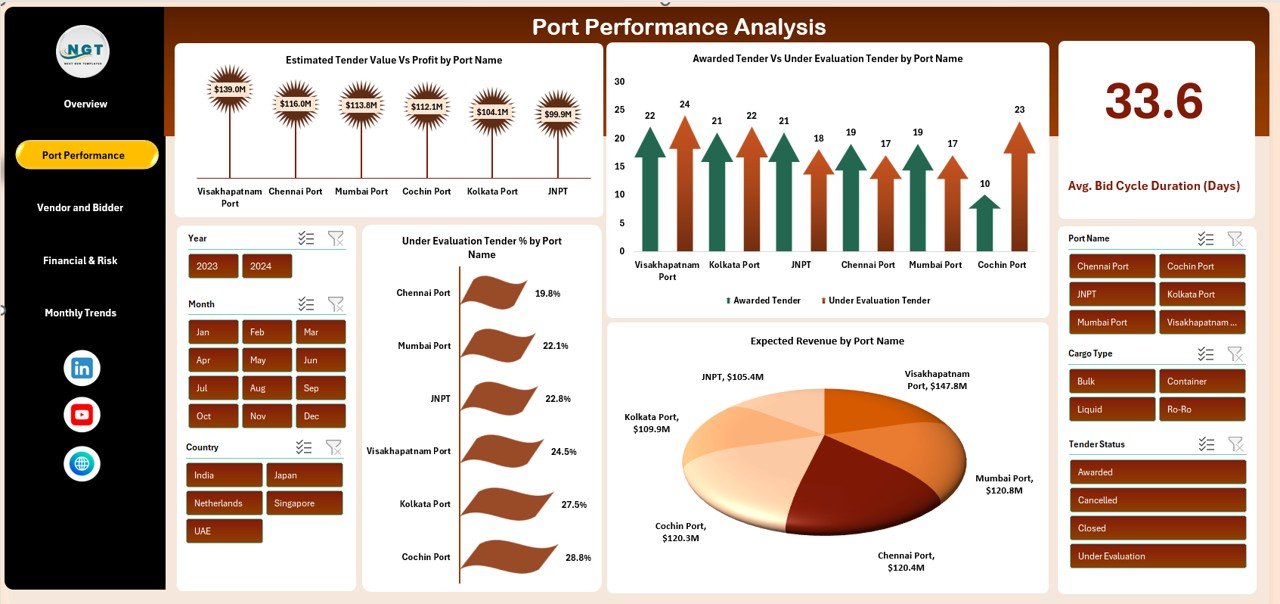
This section evaluates how each port performs in terms of value, revenue, and tender success.
Charts in Port Performance Analysis
Estimated Tender Value vs Profit by Port Name
Compares tender size against expected profit.
It helps identify ports that generate high value but low margins.
Awarded Tender vs Under Evaluation Tender by Port Name
Shows tender conversion performance at each port.
Expected Revenue by Port Name
Highlights ports with the highest revenue potential.
Under Evaluation Tender % by Port Name
Identifies bottlenecks in tender approval processes.
Click to Buy Port Tender Dashboard in Excel
Vendor and Bidder Analysis
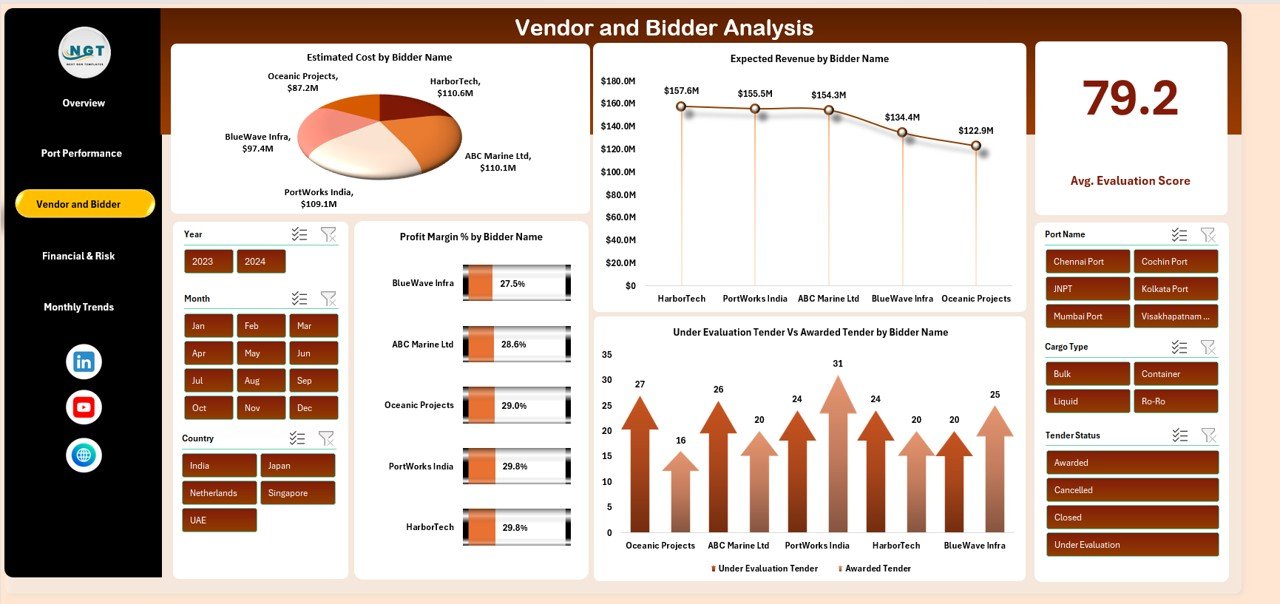
Vendor performance plays a critical role in tender success. This section evaluates bidders from financial and operational angles.
📊 Charts in Vendor and Bidder Analysis
Estimated Cost by Bidder Name
Helps compare cost competitiveness among bidders.
Expected Revenue by Bidder Name
Identifies vendors that bring higher revenue opportunities.
Under Evaluation vs Awarded Tender by Bidder Name
Shows vendor success rates in tender awards.
Profit Margin % by Bidder Name
Highlights bidders who deliver higher margins.
Click to Buy Port Tender Dashboard in Excel
Financial & Risk Analysis
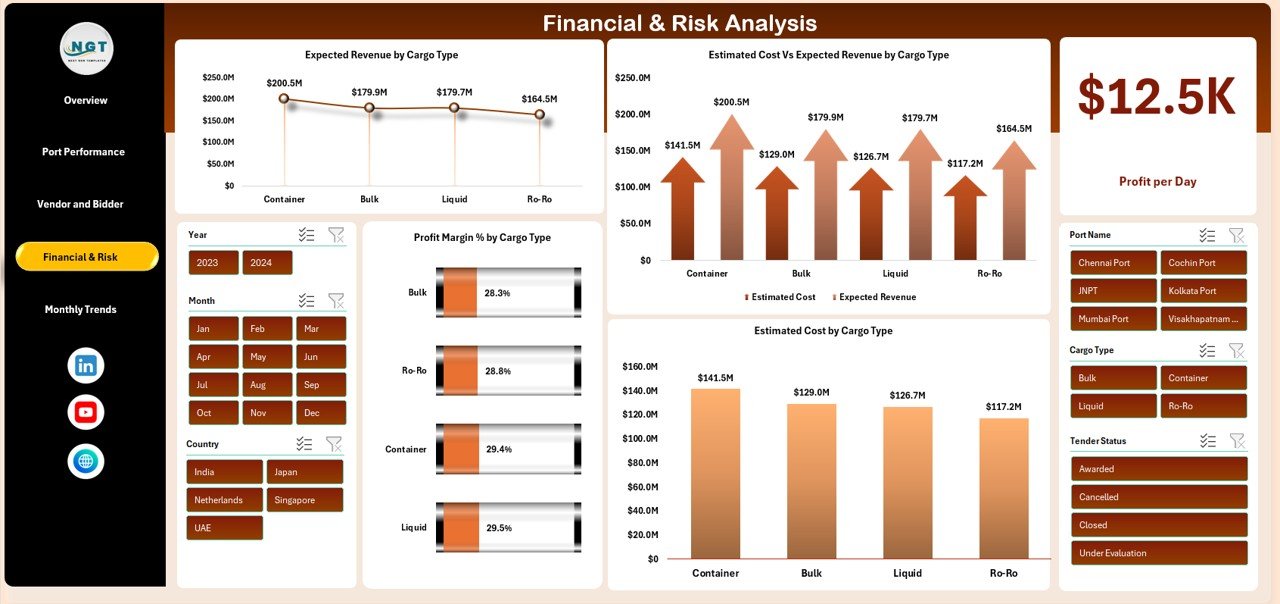
This section focuses on cargo-wise financial exposure and profitability.
📊 Charts in Financial & Risk Analysis
Expected Revenue by Cargo Type
Shows which cargo types generate the most revenue.
Estimated Cost vs Expected Revenue by Cargo Type
Helps analyze profitability and cost efficiency by cargo.
Estimated Cost by Cargo Type
Tracks operational cost exposure.
Profit Margin % by Cargo Type
Identifies high-margin and low-margin cargo segments.
Click to Buy Port Tender Dashboard in Excel
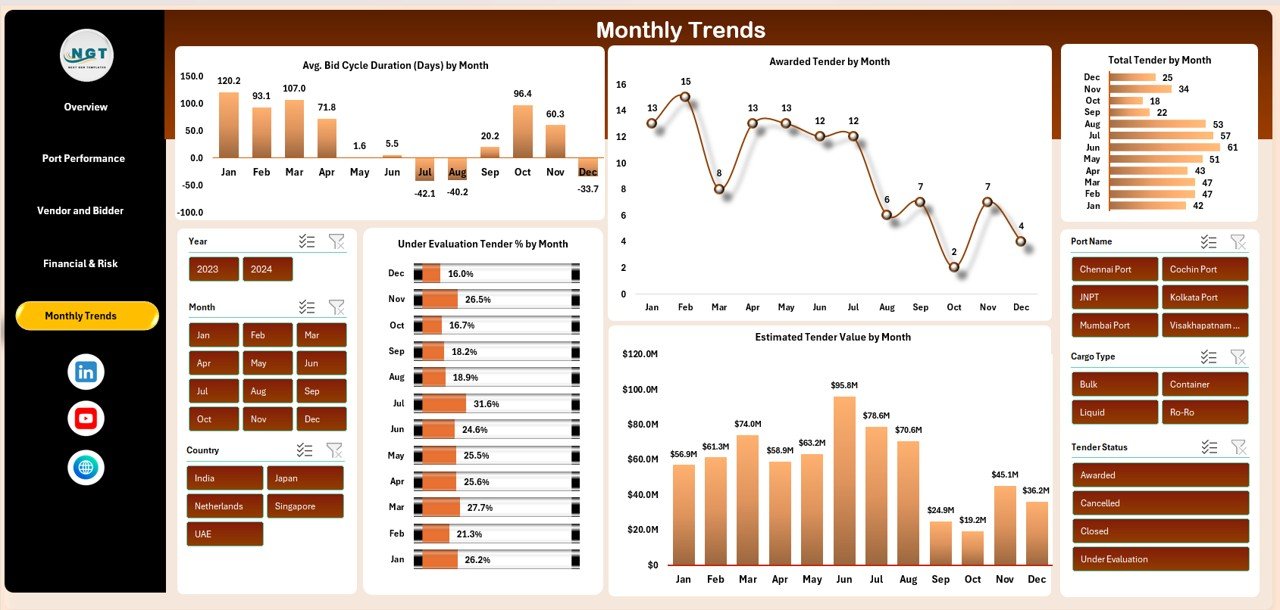
Monthly Trends Analysis
This section tracks tender performance over time.
📊 Charts in Monthly Trends
Average Bid Cycle Duration (Days) by Month
Helps measure how long tenders take to close.
Awarded Tender by Month
Shows monthly tender success trends.
Estimated Tender Value by Month
Tracks changes in tender size across months.
Under Evaluation Tender % by Month
Helps identify delays and approval bottlenecks.
Click to Buy Port Tender Dashboard in Excel
Advantages of Using a Port Tender Dashboard in Excel
Centralized Tender Visibility
All tender data stays in one structured dashboard.
Faster Decision-Making
Visual insights replace manual data reviews.
Improved Profitability Tracking
Margins and profit trends remain visible at all times.
Better Vendor Evaluation
Data-driven vendor selection becomes easier.
Risk Reduction
Early identification of under-evaluation and low-margin tenders.
No Additional Software Cost
Works fully in Excel.
Opportunities for Improvement in the Dashboard
Click to Buy Port Tender Dashboard in Excel
Although the dashboard is powerful, you can enhance it further:
-
Add tender SLA tracking
-
Include country-wise port analysis
-
Add forecasted revenue and profit
-
Integrate Power Query for automation
-
Add year-over-year comparisons
-
Track tender rejection reasons
Best Practices for Using the Port Tender Dashboard
-
Update tender data regularly
-
Standardize tender status definitions
-
Review profit margins before bidding
-
Analyze vendor performance quarterly
-
Monitor bid cycle duration monthly
-
Use charts during management reviews
Conclusion
Click to Buy Port Tender Dashboard in Excel
A Port Tender Dashboard in Excel gives port authorities and logistics companies complete control over tender performance, profitability, and risk. It transforms complex tender data into simple visuals that support faster decisions, smarter bidding, and stronger financial outcomes.
Because it is easy to use, fully customizable, and built in Excel, this dashboard becomes an essential tool for tender managers, finance teams, and senior leadership involved in port operations.
Frequently Asked Questions (FAQs)
1. Who should use a Port Tender Dashboard?
Port authorities, shipping companies, logistics firms, and infrastructure contractors.
2. Can I add more ports or cargo types?
Yes, the dashboard supports easy customization.
3. Does it require Excel macros?
No, it works with standard Excel features.
4. Can it handle large tender datasets?
Yes, with proper data structure.
5. Is this dashboard suitable for presentations?
Absolutely, charts are presentation-ready.
Visit our YouTube channel to learn step-by-step video tutorials
Youtube.com/@NeotechNavigators
Watch the step-by-step video tutorial:
Click to Buy Port Tender Dashboard in Excel