Efficient procurement management is crucial for businesses looking to streamline their supply chain, track costs, and manage vendor relationships. The Procurement Analysis Dashboard in Excel is a ready-to-use tool that provides deep insights into procurement performance, payment statuses, and vendor relationships. By using this dashboard, organizations can optimize procurement processes, monitor orders, and ensure timely payments, ultimately improving overall efficiency and profitability.
What is the Procurement Analysis Dashboard?
The Procurement Analysis Dashboard is an interactive tool designed to help businesses track and analyze procurement performance. By consolidating key metrics like ordered quantities, total costs, payment statuses, and vendor performance into a single dashboard, this tool helps procurement teams make data-driven decisions, improve processes, and optimize supplier relationships. The dashboard is fully customizable and designed to be used in Google Sheets.
Key Features of the Procurement Analysis Dashboard
The Procurement Analysis Dashboard includes several pages and charts that give a comprehensive view of procurement performance:
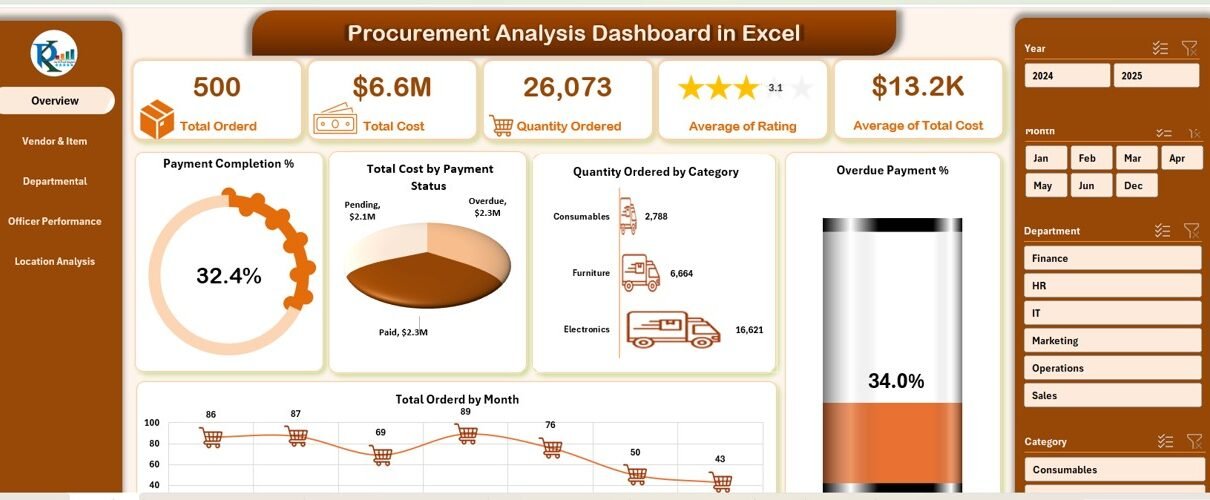
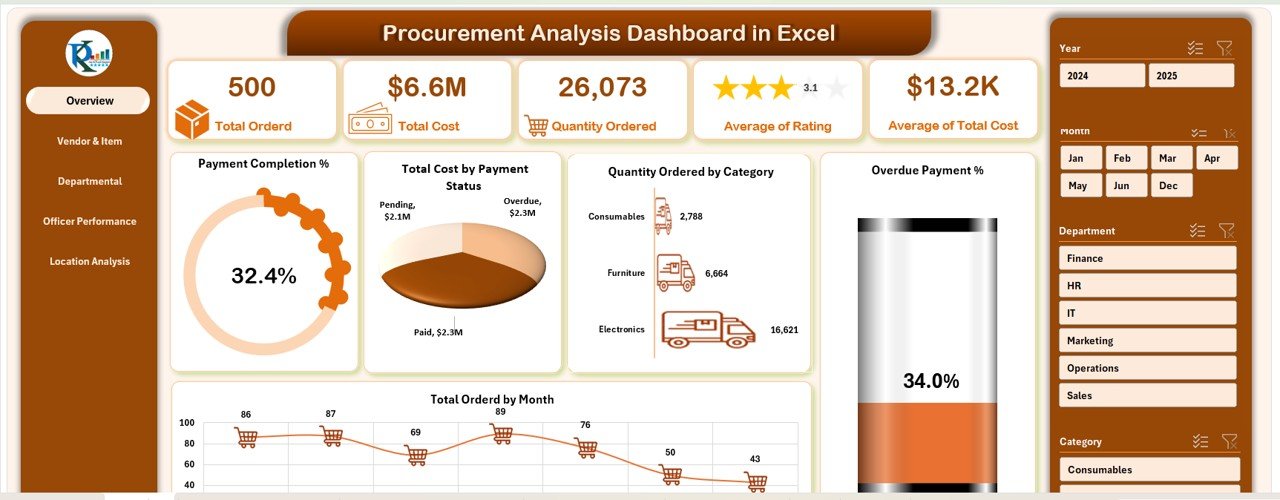
1. Overview Sheet Tab
The Overview sheet provides a high-level snapshot of key procurement metrics, including:
Cards:
- Total Ordered: Displays the total number of orders placed.
- Total Cost: Shows the total expenditure on procurement.
- Quantity Ordered: Displays the total quantity of items ordered.
- Average of Rating: Tracks the average rating given to suppliers or items.
- Average of Total Cost: Displays the average total cost of procurement orders.
Charts:
- Payment Completion %: Displays the percentage of payments completed versus pending.
- Total Cost by Payment Status: Compares the total cost of orders by their payment status (e.g., Paid, Pending).
- Quantity Ordered by Category: Visualizes how much quantity was ordered by item category.
- Overdue Payment %: Tracks the percentage of payments that are overdue.
- Total Ordered by Month: Displays the number of orders placed per month.
Click to buy Procurement Analysis Dashboard in Excel
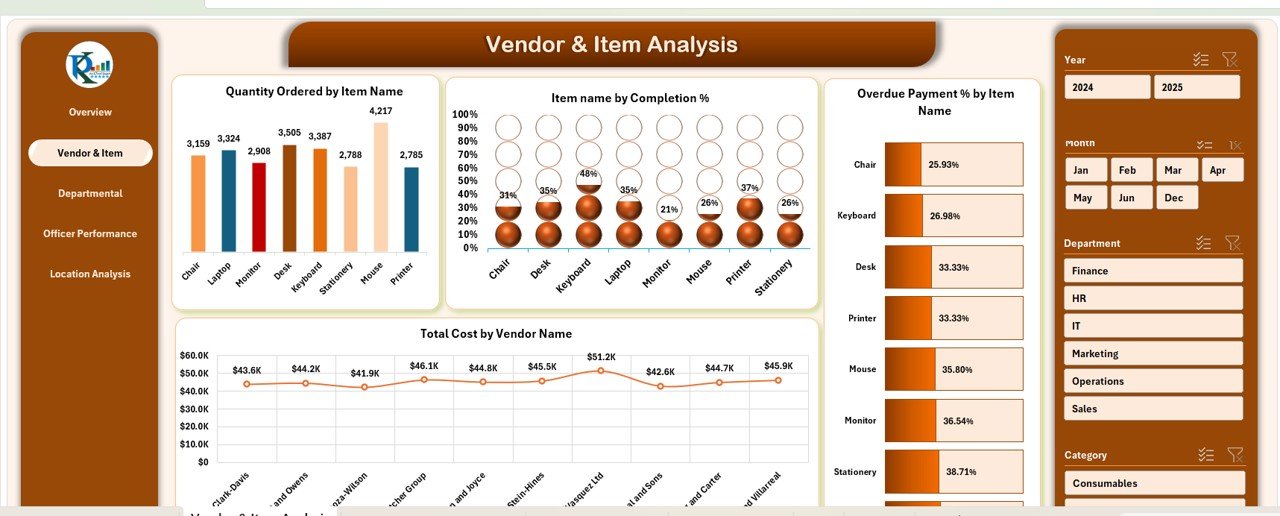
2. Vendor & Item Analysis Sheet Tab
The Vendor & Item Analysis page focuses on tracking item and vendor performance, including:
Charts:
- Quantity Ordered by Item Name: Displays the quantity of each item ordered.
- Item Name by Completion %: Shows the percentage of completion for each item order.
- Overdue Payment % by Item Name: Displays overdue payment percentage by item.
- Total Cost by Vendor Name: Visualizes the total procurement cost by vendor.
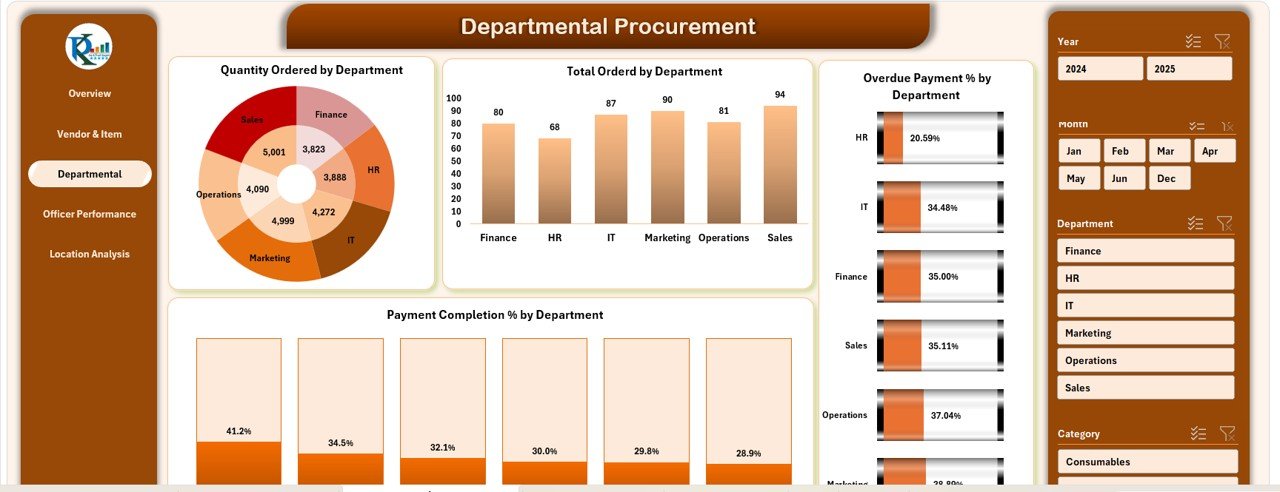
3. Departmental Procurement Sheet Tab
The Departmental Procurement page tracks procurement performance by department:
Charts:
- Quantity Ordered by Department: Displays how many items each department has ordered.
- Total Ordered by Department: Shows the total number of orders placed by each department.
- Payment Completion % by Department: Tracks payment completion percentage by department.
- Overdue Payment % by Department: Displays the percentage of overdue payments by department.
Click to buy Procurement Analysis Dashboard in Excel
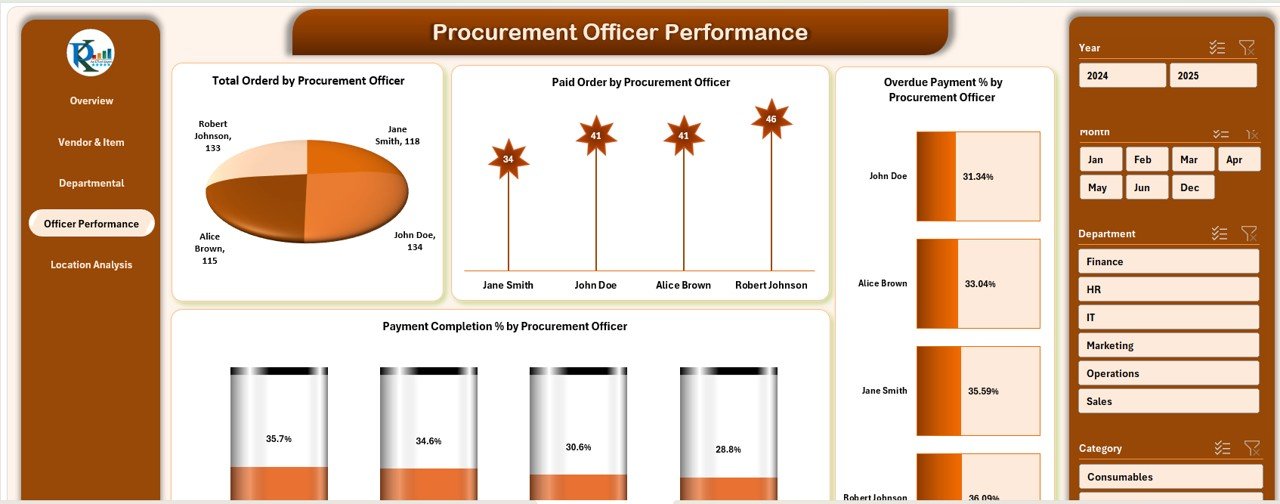
4. Officer Performance Sheet Tab
The Officer Performance page tracks the performance of procurement officers:
Charts:
- Total Ordered by Procurement Officer: Displays the total number of orders handled by each officer.
- Paid Order by Procurement Officer: Shows the number of paid orders processed by each officer.
- Overdue Payment % by Procurement Officer: Tracks overdue payments by officer.
- Payment Completion % by Procurement Officer: Displays payment completion percentage by officer.
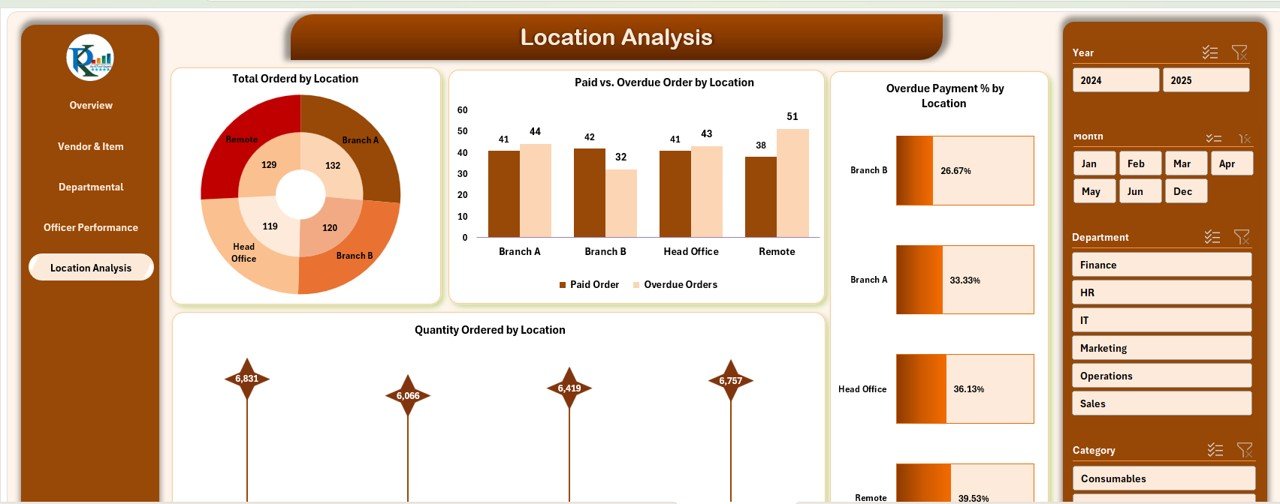
5. Location Analysis Sheet Tab
The Location Analysis page tracks procurement performance by location:
- Chart:
- Total Ordered by Location: Displays the total number of orders placed by location.
- Paid vs. Overdue Order by Location: Compares paid orders versus overdue orders by location.
- Overdue Payment % by Location: Shows the percentage of overdue payments by location.
- Quantity Ordered by Location: Displays the quantity of items ordered by location.
Click to buy Procurement Analysis Dashboard in Excel
6. Data Sheet Tab
The Data Sheet is where all procurement data is entered. This is the input sheet for order details, including:
Benefits of Using the Procurement Analysis Dashboard
- Improved Decision-Making: With detailed charts and data, procurement managers can make informed decisions based on real-time data.
- Cost Optimization: By tracking total costs, overdue payments, and vendor performance, businesses can identify cost-saving opportunities.
- Efficient Resource Allocation: The dashboard helps identify which departments and officers are managing procurement efficiently, allowing for better resource allocation.
- Vendor and Item Performance Monitoring: By analyzing performance by vendor and item, businesses can make strategic decisions about supplier relationships.
- Timely Payments: The dashboard’s payment tracking features ensure that overdue payments are flagged, helping to improve payment cycles and relationships with suppliers.
Best Practices for Using the Procurement Analysis Dashboard
Click to buy Procurement Analysis Dashboard in Excel
- Regular Updates: Regularly input data into the Data Sheet to ensure that the dashboard reflects up-to-date information.
- Monitor Trends: Use the charts to monitor trends in order volume, payment completion, and vendor performance, identifying opportunities for improvement.
- Evaluate Officer and Department Performance: Track the performance of procurement officers and departments to optimize operations and ensure accountability.
- Set Clear Targets: Use the data to set targets for departments, officers, and vendors to improve procurement efficiency and reduce delays.
- Analyze Supplier Relationships: Use the Vendor & Item Analysis to identify high-performing suppliers and renegotiate contracts with underperforming ones.
Conclusion
The Procurement Analysis Dashboard is a powerful tool for businesses looking to optimize their procurement processes. By tracking key metrics such as order volume, cost, payment status, and vendor performance, this dashboard allows procurement teams to make informed decisions, improve efficiency, and reduce costs. Whether you are managing procurement at the departmental level or overseeing the entire process, this dashboard provides the insights you need to streamline operations and drive success.
Frequently Asked Questions (FAQs)
Click to buy Procurement Analysis Dashboard in Excel
1. How do I enter data into the Procurement Analysis Dashboard?
Data is entered into the Data Sheet tab, where you can input order details, payment status, and other relevant information for each procurement request.
2. Can I customize the Procurement Analysis Dashboard?
Yes, the dashboard is fully customizable. You can adjust the charts, add new metrics, or change the layout to suit your specific procurement needs.
3. How does the Vendor & Item Analysis page help me?
The Vendor & Item Analysis page helps track procurement costs, overdue payments, and performance by item and vendor, enabling you to optimize supplier relationships.
4. How can I improve payment completion tracking?
By regularly reviewing the Payment Completion % chart, you can identify overdue payments and take proactive steps to resolve them, improving cash flow.
5. Can this dashboard handle large amounts of data?
Yes, the dashboard is scalable and can handle large volumes of procurement data, making it suitable for both small and large organizations.
Visit our YouTube channel to learn step-by-step video tutorials
Youtube.com/@NeotechNavigators
Click to buy Procurement Analysis Dashboard in Excel
Watch the step-by-step video tutorial: