In any organization, procurement plays a vital role in managing expenses and ensuring smooth operations. Efficient tracking and analysis of procurement costs help businesses stay within budget and optimize spending. The Procurement Cost Analysis Dashboard in Excel is a powerful tool designed to provide real-time insights into procurement activities, helping organizations make informed decisions and control their costs.
This article will walk you through the key features of the Procurement Cost Analysis Dashboard in Excel, explaining how it works and how it can help streamline procurement cost management.
What is the Procurement Cost Analysis Dashboard in Excel?
The Procurement Cost Analysis Dashboard in Excel is an interactive, ready-to-use tool that enables procurement teams to track, manage, and analyze procurement activities. The dashboard provides insights into key procurement metrics, such as total procurement spend, vendor performance, department spending, and more.
Key Features of the Procurement Cost Analysis Dashboard in Excel
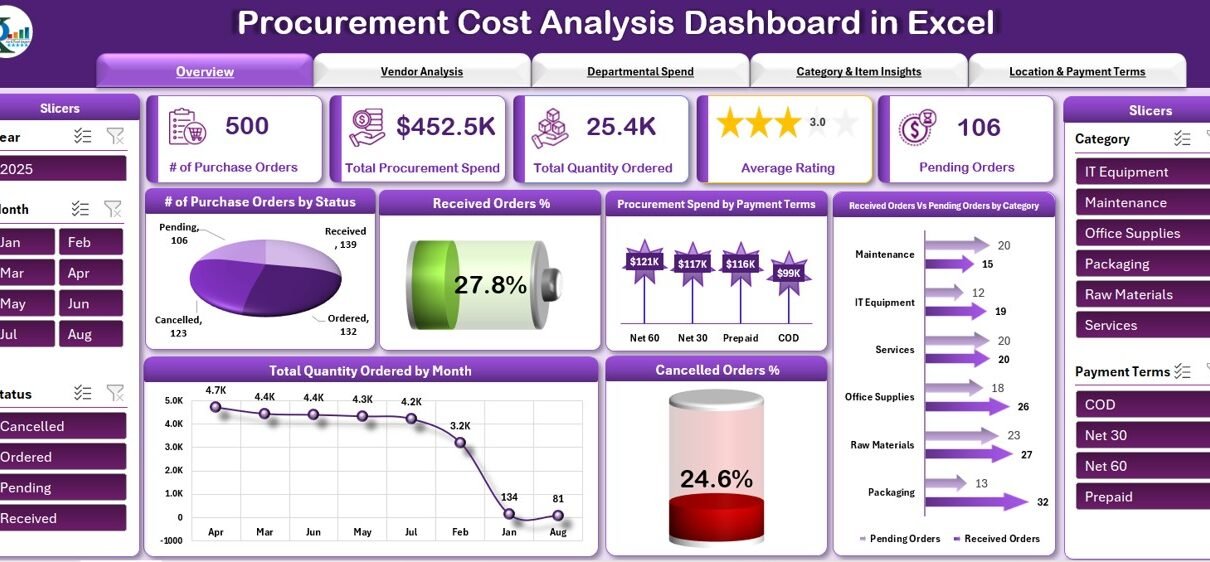
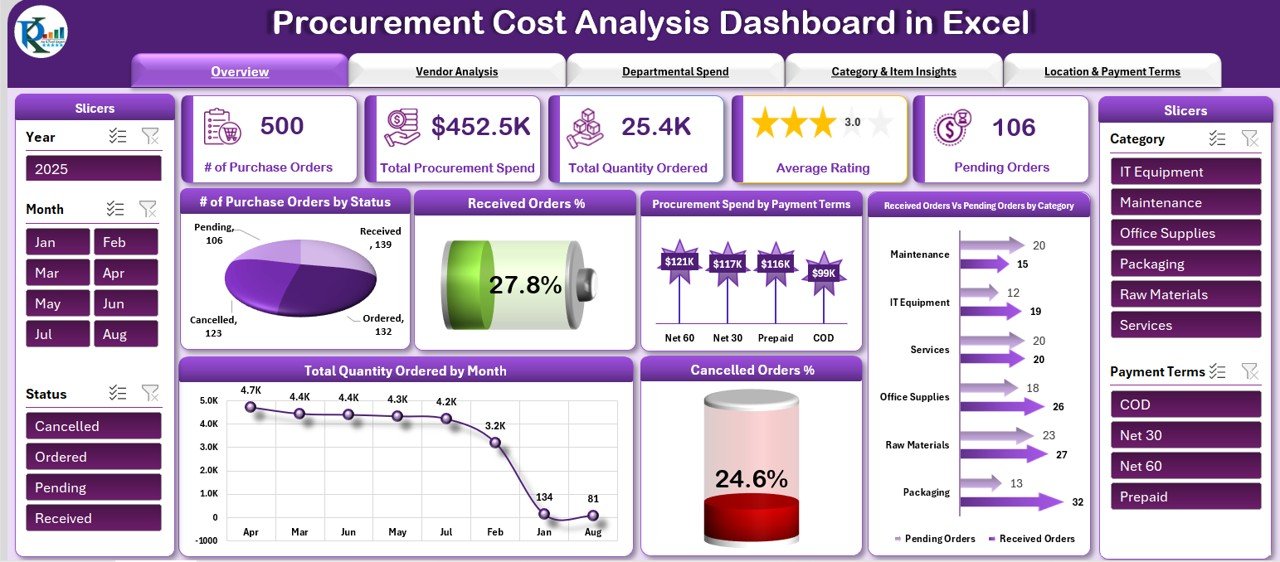
1) Overview Sheet: High-Level Summary of Procurement Performance
The Overview Sheet provides a comprehensive view of the overall procurement activities. Key features include:
Cards for Key Metrics:
- # of Purchase Orders: Total number of purchase orders placed.
- Total Procurement Spend: The total amount spent on procurement.
- Total Quantity Ordered: Total number of items ordered across all purchase orders.
- Average Rating: An average rating (possibly based on vendor performance or procurement satisfaction).
- Pending Orders: The total number of purchase orders that are still pending.
Charts for Procurement Insights:
- # of Purchase Orders by Status: Displays the distribution of purchase orders by status (e.g., completed, pending, canceled).
- Received Orders %: Shows the percentage of orders that have been received versus those that are still pending.
- Procurement Spend by Payment Terms: Breakdown of spend by payment terms (e.g., net 30, net 60).
- Received Orders Vs Pending Orders by Category: Shows the comparison of received orders versus pending orders, categorized by item or service type.
- Total Quantity Ordered by Month: Displays the quantity of items ordered each month.
- Cancelled Orders %: The percentage of orders that were canceled.
The Overview Sheet acts as the primary dashboard for procurement monitoring, offering a snapshot of the key metrics.
Click to buy Procurement Cost Analysis Dashboard in Excel
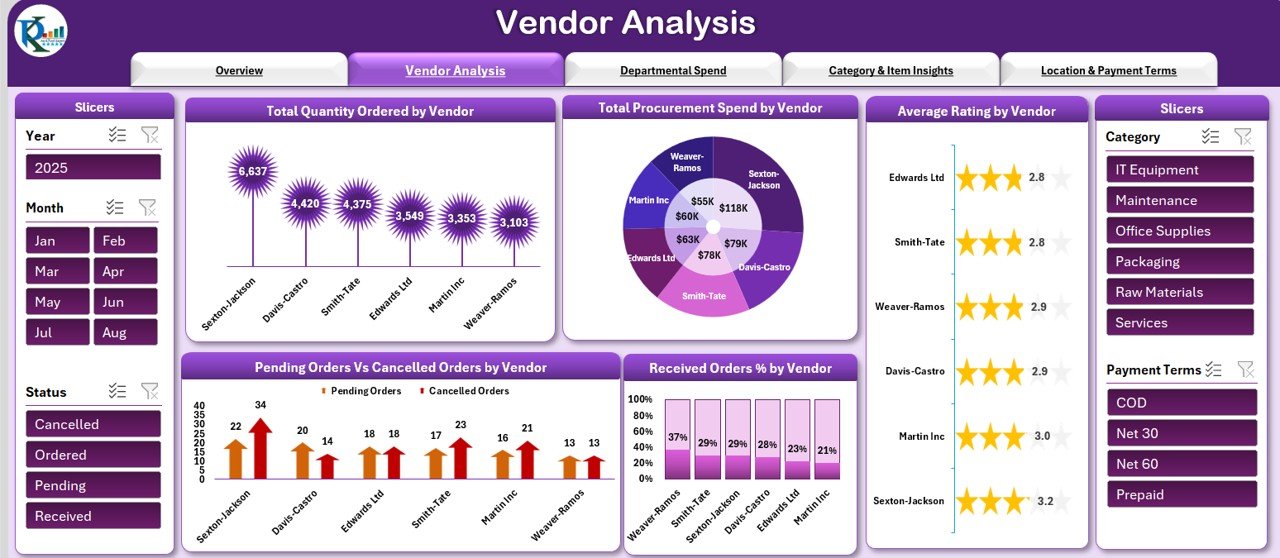
2) Vendor Analysis: Evaluating Vendor Performance
The Vendor Analysis sheet helps assess the performance of individual vendors. Key features include:
Charts for Vendor Insights:
- Total Quantity Ordered by Vendor: Displays the quantity of items ordered from each vendor.
- Total Procurement Spend by Vendor: Shows how much has been spent with each vendor.
- Average Rating by Vendor: Displays the average rating of each vendor (possibly based on quality, delivery time, or service).
- Received Orders % by Vendor: Indicates the percentage of orders from each vendor that have been received versus pending or canceled.
- Pending Orders Vs Cancelled Orders by Vendor: A comparison of pending orders and canceled orders by each vendor.
This sheet helps procurement managers assess vendor performance, identify reliable suppliers, and optimize vendor relationships.
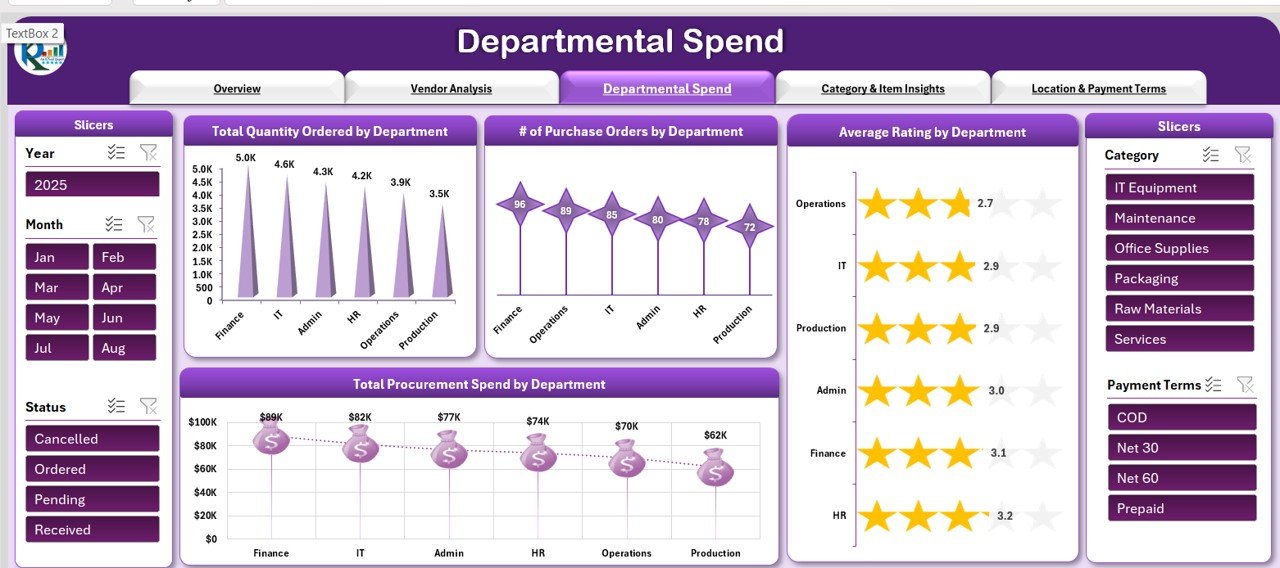
3) Departmental Spend: Tracking Procurement by Department
The Departmental Spend sheet helps track procurement spending by department. Key features include:
Charts for Departmental Insights:
- Total Quantity Ordered by Department: Displays the number of items ordered by each department.
- # of Purchase Orders by Department: Shows how many purchase orders were placed by each department.
- Average Rating by Department: Provides the average rating of procurement performance by department.
- Total Procurement Spend by Department: Shows how much each department has spent on procurement.
This sheet is especially useful for tracking departmental procurement budgets and ensuring that departments are adhering to their financial targets.
Click to buy Procurement Cost Analysis Dashboard in Excel
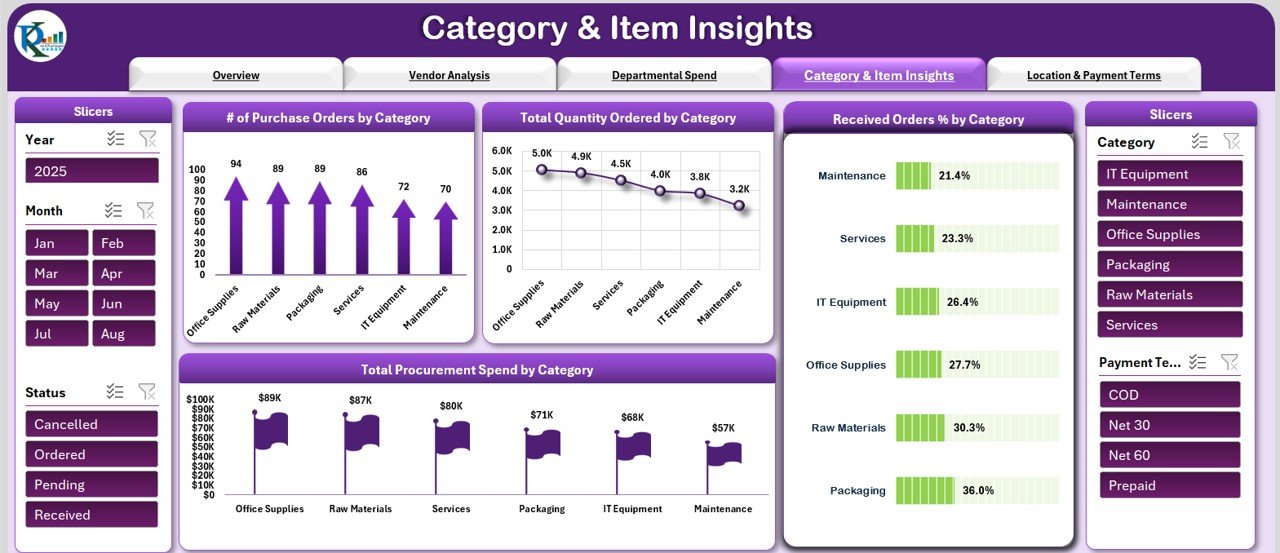
4) Category & Item Insights: Understanding Procurement Categories
The Category & Item Insights sheet allows you to analyze procurement data by category and item type. Key features include:
Charts for Category Insights:
- # of Purchase Orders by Category: Displays the number of purchase orders for each procurement category (e.g., office supplies, IT equipment, etc.).
- Total Quantity Ordered by Category: Shows the total quantity of items ordered per category.
- Received Orders % by Category: Indicates the percentage of orders received versus those pending or canceled by category.
- Total Procurement Spend by Category: Shows how much has been spent in each category.
This sheet allows procurement managers to identify which categories are consuming the most resources and prioritize spending.
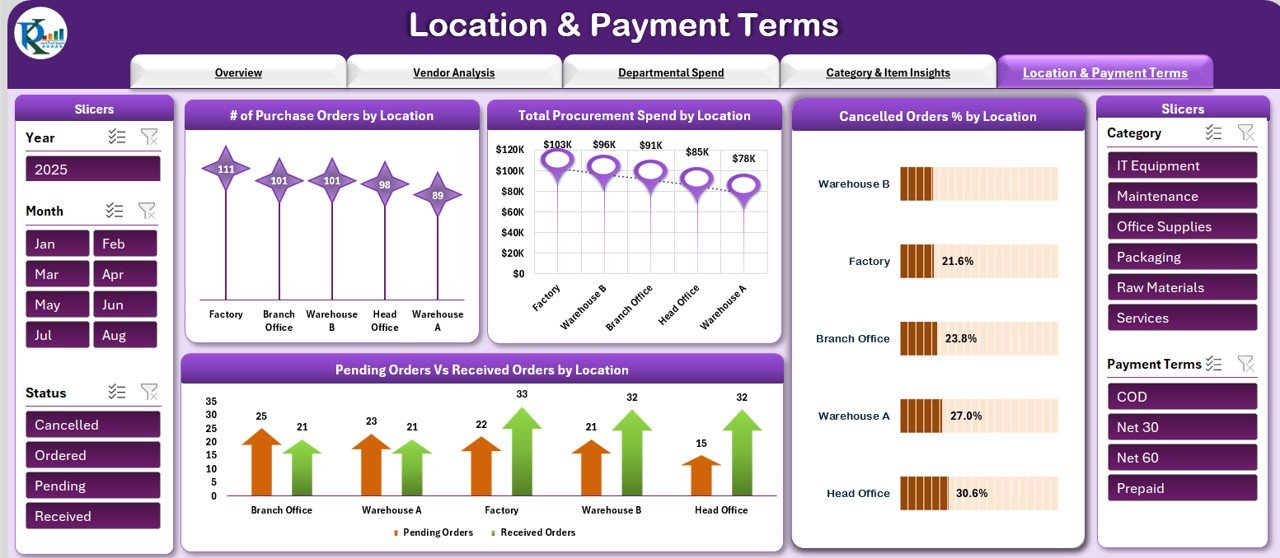
5) Location & Payment Terms: Monitoring Location-Based Procurement
The Location & Payment Terms sheet focuses on tracking procurement by geographical location and payment terms. Key features include:
Charts for Location Insights:
- # of Purchase Orders by Location: Displays the number of orders placed from each location (e.g., regional offices, warehouses).
- Total Procurement Spend by Location: Shows the total amount spent at each location.
- Cancelled Orders % by Location: Displays the percentage of canceled orders by location.
- Pending Orders Vs Received Orders by Location: A comparison of pending orders and received orders by location.
Charts for Payment Term Insights:
- # of Purchase Orders by Payment Term: Shows the number of orders based on different payment terms (e.g., net 30, net 60, immediate payment).
- Total Procurement Spend by Payment Term: Displays the amount spent on procurement by payment term.
This sheet helps businesses monitor procurement activities based on location and payment terms, providing insights into cash flow management and regional procurement trends.
Click to buy Procurement Cost Analysis Dashboard in Excel
6) Data Input Sheet: Centralized Data Management
This sheet serves as the foundation for all the analysis and charts in the dashboard, ensuring that all procurement data is accurately captured and updated.
Benefits of Using the Procurement Cost Analysis Dashboard
- Streamlined Procurement Monitoring: Track key metrics such as spend, order status, and vendor performance in one centralized dashboard.
- Enhanced Vendor Insights: Analyze vendor performance to identify reliable suppliers and improve negotiation strategies.
- Improved Budgeting and Planning: Monitor departmental spending and ensure procurement activities stay within budget.
- Data-Driven Decision Making: Use detailed charts and metrics to make informed decisions about procurement strategies, vendor selection, and cost optimization.
- Optimized Resource Allocation: By tracking procurement spending by category, department, and location, you can ensure resources are allocated efficiently.
Conclusion
Click to buy Procurement Cost Analysis Dashboard in Excel
The Procurement Cost Analysis Dashboard in Excel is a comprehensive tool that simplifies the process of monitoring and analyzing procurement activities. With detailed insights into spend, vendor performance, and procurement efficiency, this dashboard is an invaluable resource for procurement professionals looking to optimize their procurement processes and improve cost management.
Frequently Asked Questions (FAQs)
1. How do I update the procurement data?
You can update the procurement data in the Data Input Sheet. This is where all new orders, vendor information, and payment details are entered.
2. Can I track procurement by region or department?
Yes, the dashboard includes charts that track procurement spend and activities by both region and department.
3. How do I track vendor performance?
The Vendor Analysis sheet allows you to track vendor performance by looking at metrics like total spend, average rating, and on-time delivery rate.
4. Can I customize the dashboard to suit my needs?
Yes, the dashboard is customizable. You can adjust the categories, charts, and filters to suit your organization’s specific procurement needs.
Visit our YouTube channel to learn step-by-step video tutorials
Watch the step-by-step video Demo:
Click to buy Procurement Cost Analysis Dashboard in Excel