Managing procurement effectively is no longer optional—it is a critical success factor for every business. Companies today operate in highly competitive environments, and even a small gap in procurement processes can lead to delays, increased costs, or loss of valuable opportunities. This is where a Procurement Efficiency KPI Dashboard in Excel becomes a game-changing tool.
Instead of juggling multiple spreadsheets, manual reports, and disconnected data, this ready-to-use dashboard brings everything together in a single interactive platform. By tracking Key Performance Indicators (KPIs) for procurement, organizations can gain clear visibility, make informed decisions, and improve efficiency across the supply chain.Procurement Efficiency KPI Dashboard in Excel
Click to buy Procurement Efficiency KPI Dashboard in Excel
In this article, we will explore:
- What the Procurement Efficiency KPI Dashboard in Excel is.
- Its structure and detailed features.
- Why businesses need it.
- The advantages of using this dashboard.
- The best practices for implementation.
- Real-world applications to maximize value.
- A helpful FAQ section to clarify common questions.
What Is a Procurement Efficiency KPI Dashboard in Excel?
A Procurement Efficiency KPI Dashboard is an Excel-based performance tracking tool designed to monitor and evaluate procurement processes. It consolidates multiple procurement KPIs—such as cost savings, supplier performance, purchase cycle time, and compliance—into one centralized dashboard.
The dashboard makes it easy to analyze performance Month-to-Date (MTD) and Year-to-Date (YTD), compare results with targets, and review historical data against previous years. With interactive slicers, charts, and conditional formatting, decision-makers can identify gaps, highlight improvements, and take corrective actions instantly.Procurement Efficiency KPI Dashboard in Excel
Why Do You Need a Procurement Efficiency KPI Dashboard?
Procurement teams often face challenges such as:
- Lack of visibility across suppliers and contracts.
- Difficulty in tracking targets versus actuals.
- Delays in reporting due to manual data handling.
- Limited ability to identify risks or inefficiencies.
Without a structured dashboard, procurement decisions rely on guesswork rather than data. With this Excel dashboard, however, leaders can:
- Monitor key metrics in real time.
- Benchmark performance against targets and previous years.
- Standardize procurement processes with clear KPI definitions.
- Optimize supplier management for better efficiency.
- Control costs by identifying variances early.
This makes the dashboard not just a reporting tool, but a strategic enabler for procurement excellence.
Structure of the Procurement Efficiency KPI Dashboard
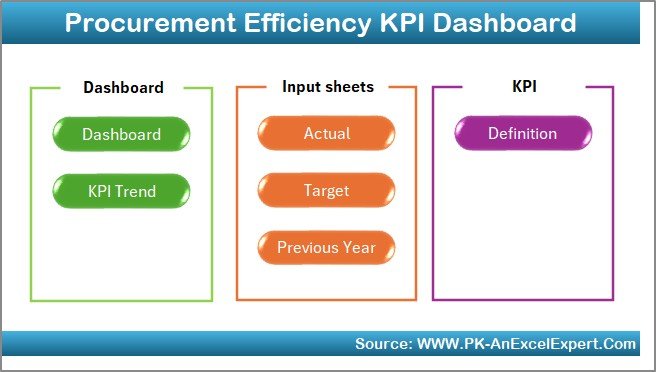
The dashboard comes with 7 well-organized worksheet tabs, each serving a specific purpose. Let’s walk through them:
Home Sheet
- Functions as an index page.
- Provides six navigation buttons for quick access to the respective sheets.
- Offers a user-friendly entry point for managers and analysts.Procurement Efficiency KPI Dashboard in Excel
Click to buy Procurement Efficiency KPI Dashboard in Excel
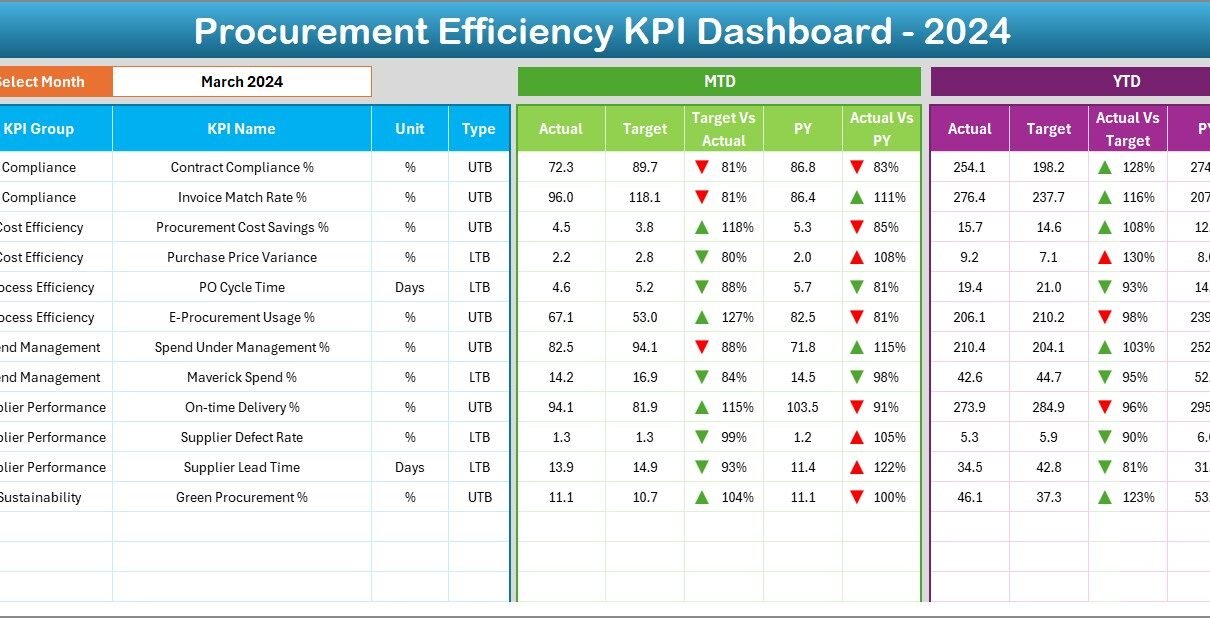
Dashboard Sheet
- The main analysis hub of the tool.
- Displays all KPI information in a single view.
- Includes a drop-down in D3 to select a specific month.
- Updates MTD and YTD values instantly when a month is chosen.
- Shows MTD Actual, Target, and Previous Year (PY) values with conditional formatting (up and down arrows).
- Displays YTD Actual, Target, and PY values with the same smart indicators.
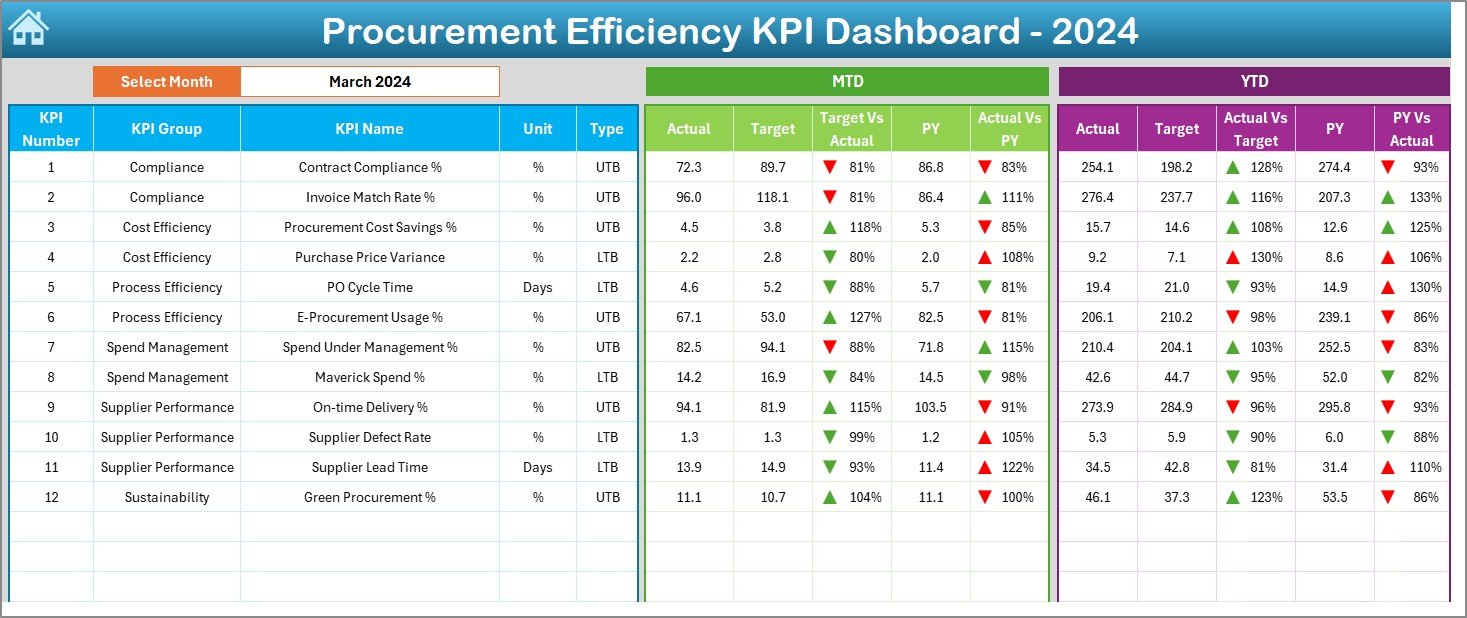
This sheet provides a visual, at-a-glance performance overview for decision-making.
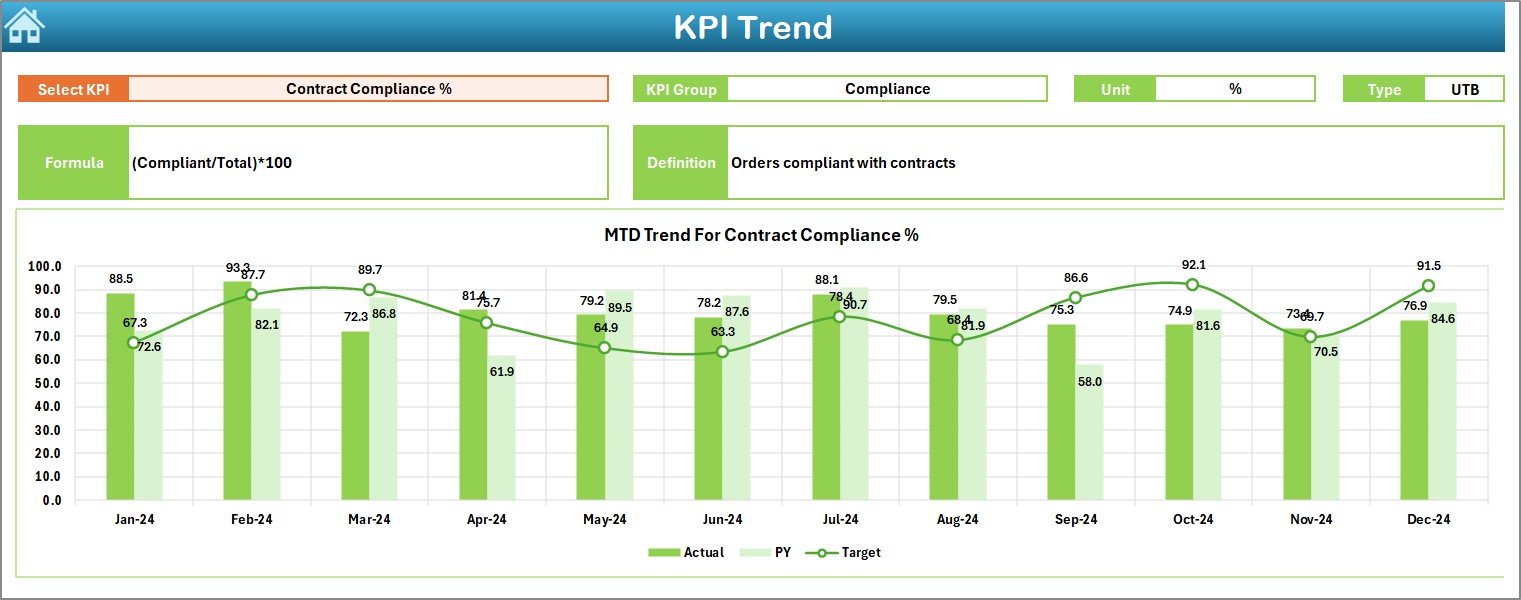
KPI Trend Sheet
- Allows users to select a KPI from a drop-down (cell C3).
- Displays:
- KPI Group
- KPI Unit
- KPI Type (Lower the Better or Upper the Better)
- Formula
- KPI Definition
- Provides trend charts for MTD and YTD Actual, Target, and PY.
- Helps in identifying performance patterns and spotting deviations early.
Click to buy Procurement Efficiency KPI Dashboard in Excel
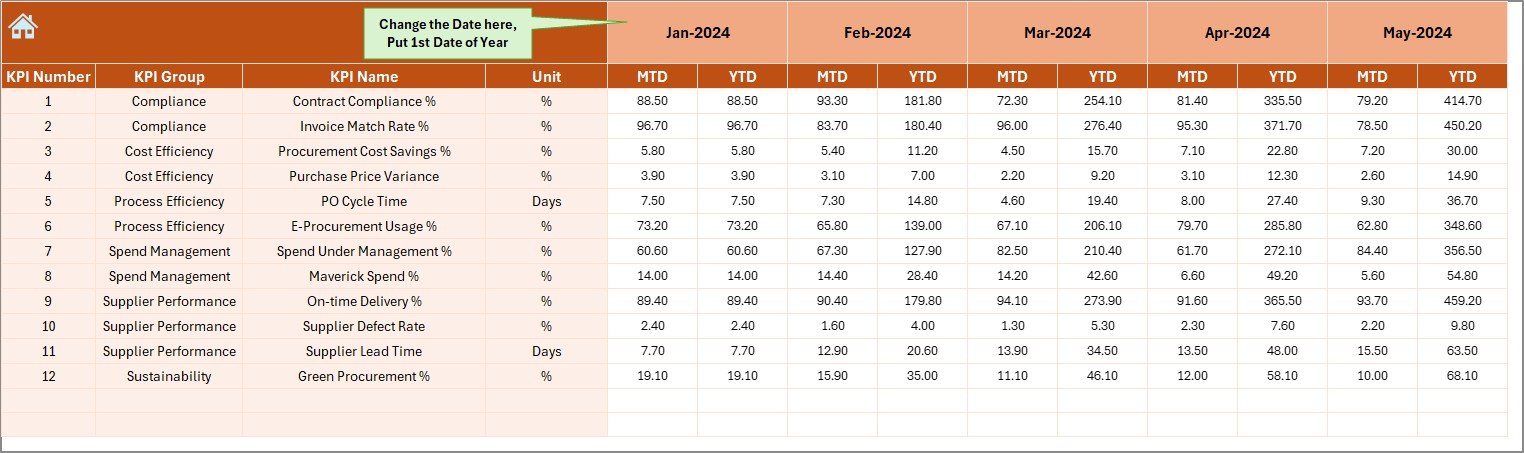
Actual Numbers Input Sheet
- Used to enter actual performance numbers for MTD and YTD.
- A month selector (E1) ensures data is aligned with the chosen year.
- Serves as the data entry hub, ensuring accurate reporting.
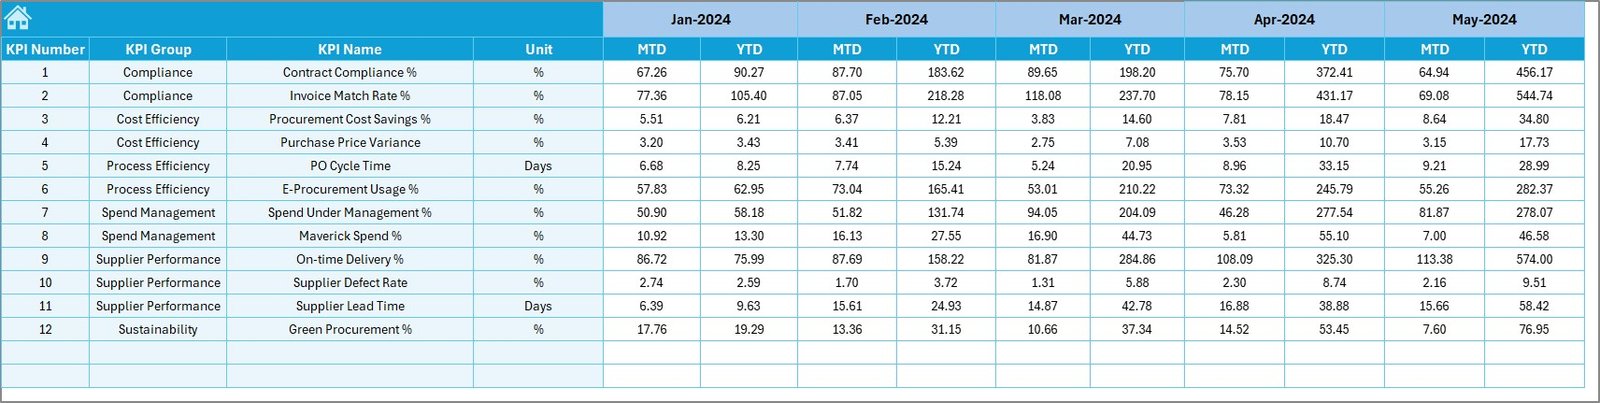
Target Sheet
- Dedicated to defining target values for each KPI.
- Records both MTD and YTD targets for every month.
- Supports transparent goal-setting and accountability.
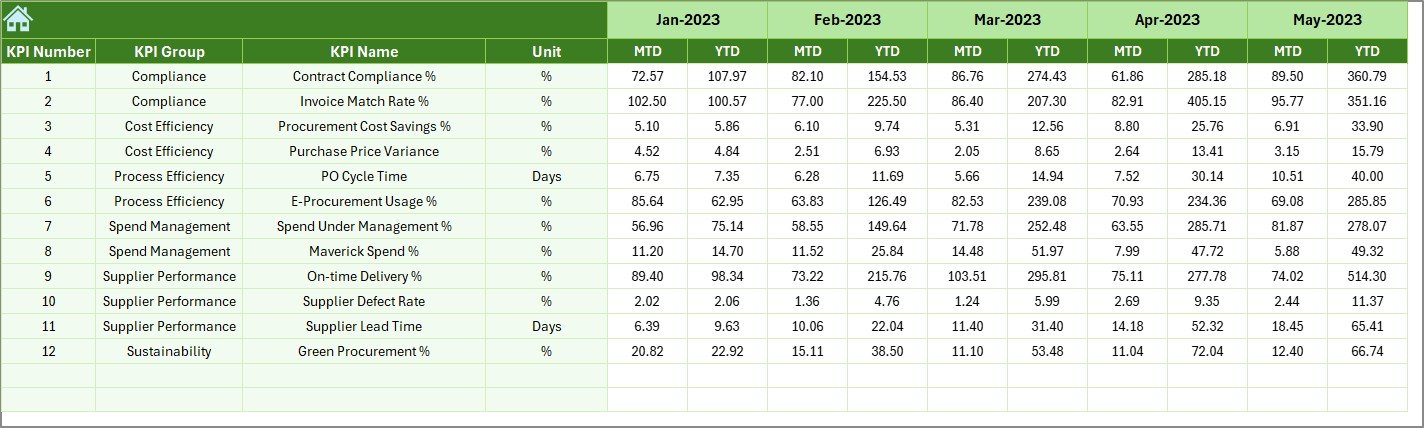
Previous Year Number Sheet
- Stores historical KPI data for comparison.
- Helps evaluate progress over time by comparing current year versus last year.
Click to buy Procurement Efficiency KPI Dashboard in Excel
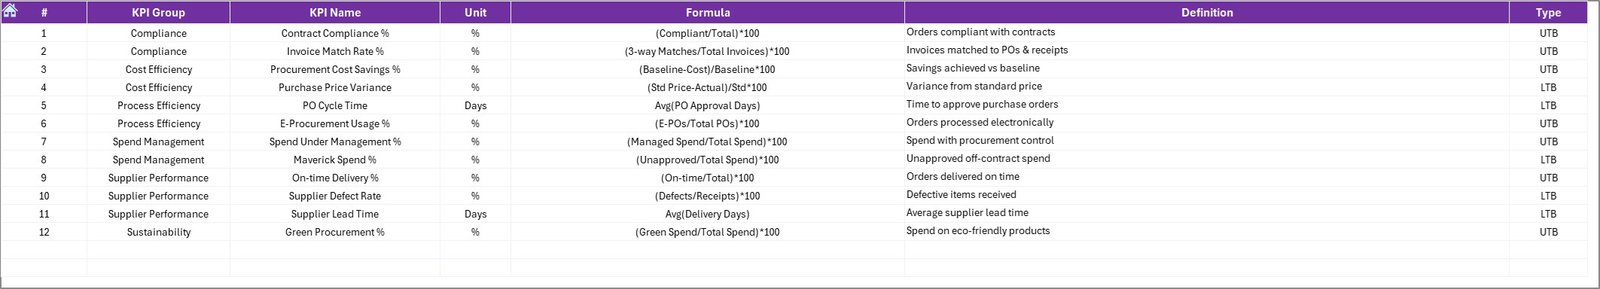
KPI Definition Sheet
- Contains all details of KPIs in one place.
- Includes: KPI Name, Group, Unit, Formula, and Definition.
- Acts as a reference guide to standardize reporting across the organization.
Key Benefits of Using the Dashboard
The Procurement Efficiency KPI Dashboard offers several benefits:
- Centralized Reporting – All procurement KPIs in one place.
- Real-Time Analysis – Track progress instantly with slicers and charts.
- Improved Accuracy – Eliminate manual reporting errors.
- Informed Decisions – Compare actual vs. target vs. previous year.
- Enhanced Supplier Management – Identify top-performing and underperforming vendors.
- Efficiency Tracking – Monitor cycle times, compliance, and savings.
- Scalable – Can be adapted for small teams or large enterprises.
Advantages of Procurement Efficiency KPI Dashboard in Excel
Let’s break down the specific advantages:
- Enhanced Visibility
You gain a clear picture of procurement performance across all KPIs. Instead of relying on scattered reports, you can monitor everything in one interactive view.
- Improved Cost Control
By comparing actuals with targets and historical performance, the dashboard highlights overspending and savings opportunities.
- Supplier Performance Monitoring
Track vendor reliability, delivery times, and compliance to build stronger supplier relationships.
- Better Decision-Making
Interactive charts and conditional formatting provide instant insights, helping leaders act quickly.
- Time-Saving Automation
Prebuilt formulas, structured inputs, and automated charts reduce manual work and save hours each month.
Best Practices for Procurement Efficiency KPI Dashboard
To make the most of this dashboard, follow these best practices:
- Define Clear KPIs: Start with measurable KPIs aligned with your organizational goals.
- Standardize Data Entry: Always use the dedicated input sheets to avoid errors.
- Review Trends Regularly: Check monthly and yearly trends to identify early warnings.
- Use Conditional Formatting Wisely: Let arrows and colors highlight what needs attention.
- Compare with Benchmarks: Look at both targets and historical numbers for context.
- Train Teams: Ensure all procurement staff know how to input and interpret data.
- Update Targets Annually: Keep targets aligned with changing business needs.
Real-World Applications
This dashboard can be applied across various scenarios, such as:
- Corporate Procurement: Monitor purchase orders, cycle times, and compliance.
- Manufacturing: Track raw material costs, supplier efficiency, and stock levels.
- Retail: Analyze vendor delivery times and cost savings.
- Public Sector: Ensure compliance with procurement policies and budget allocations.
- Healthcare: Monitor medical supplies procurement, supplier reliability, and cost efficiency.
Conclusion
Procurement is no longer a back-office function—it is a strategic driver of business efficiency. The Procurement Efficiency KPI Dashboard in Excel empowers organizations to move from guesswork to data-driven decision-making. With real-time tracking, clear KPI definitions, and actionable insights, businesses can control costs, optimize supplier relationships, and improve overall procurement performance.
By adopting this tool, your procurement team will save time, improve accuracy, and stay ahead of challenges. In today’s competitive landscape, that edge can make all the difference.
Frequently Asked Questions (FAQs)
- What is the main purpose of a Procurement Efficiency KPI Dashboard in Excel?
The main purpose is to track, measure, and improve procurement performance using defined KPIs for better decision-making.
- Can this dashboard be used by small businesses?
Yes, the dashboard is highly scalable and can be customized for small, medium, or large organizations.
- What types of KPIs can be tracked?
You can track cost savings, supplier performance, compliance rate, cycle time, and procurement ROI, among others.
- How often should the data be updated?
Ideally, you should update it monthly for both MTD and YTD performance. However, it can also support weekly or quarterly updates if needed.
- Do I need advanced Excel skills to use it?
Not at all. The dashboard is designed to be user-friendly, with drop-down menus, slicers, and clear instructions.
- How does it help in supplier management?
It helps identify high-performing and low-performing suppliers, allowing procurement teams to make strategic decisions about vendor relationships.
- Can I modify the KPIs in the dashboard?
Yes, you can customize the KPI Definition Sheet to add or modify KPIs based on your business needs.
Visit our YouTube channel to learn step-by-step video tutorials
Watch the step-by-step video tutorial:
Click to buy Procurement Efficiency KPI Dashboard in Excel