Running a business involves constant monitoring of key performance indicators (KPIs). Among them, the product return rate stands out as a critical metric. It tells you how many products come back from customers after purchase. A high return rate may indicate issues in product quality, order accuracy, or customer satisfaction.
Manually tracking returns across multiple reports can be time-consuming and confusing. That is where a Product Return Rate
KPI Dashboard in Excel becomes a game-changer. This ready-to-use dashboard simplifies complex data, provides a clear visual overview, and helps decision-makers identify improvement areas quickly.
Click to buy Product Return Rate KPI Dashboard in Excel
In this article, you will learn:
- What a Product Return Rate KPI Dashboard is.
- Why businesses need it.
- How this Excel-based dashboard works.
- Its advantages, opportunities for improvement, and best practices.
- Frequently asked questions to guide you in using it effectively.
What Is a Product Return Rate KPI Dashboard?
A Product Return Rate KPI Dashboard in Excel is a structured reporting tool that tracks, analyzes, and visualizes all metrics related to returned products. Instead of sifting through scattered spreadsheets, managers can view important KPIs in one place.
The dashboard highlights:
- Monthly return rates compared to targets.
- Trends in returns across months.
- Comparisons with previous year’s performance.
- The difference between target and actual returns.
By consolidating this information, businesses can quickly understand return behavior, identify recurring problems, and take action.
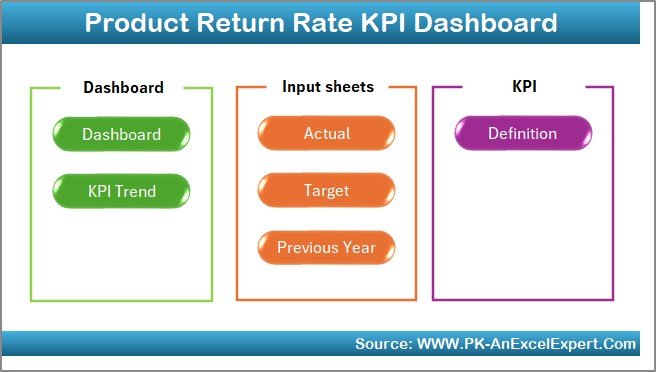
Key Features of the Product Return Rate KPI Dashboard
This dashboard is built with seven worksheets, each with a specific purpose. Let’s break them down:
Home Sheet
- Works as an index page.
- Contains navigation buttons to jump to different sheets quickly.
- Saves time and improves usability.
Click to buy Product Return Rate KPI Dashboard in Excel
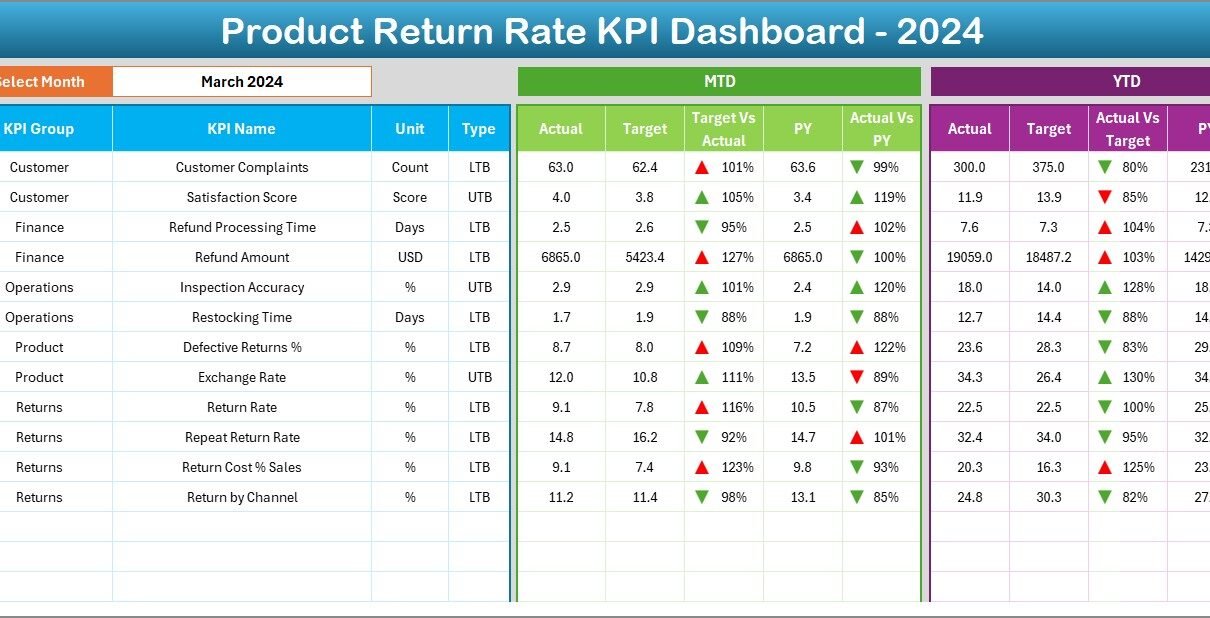
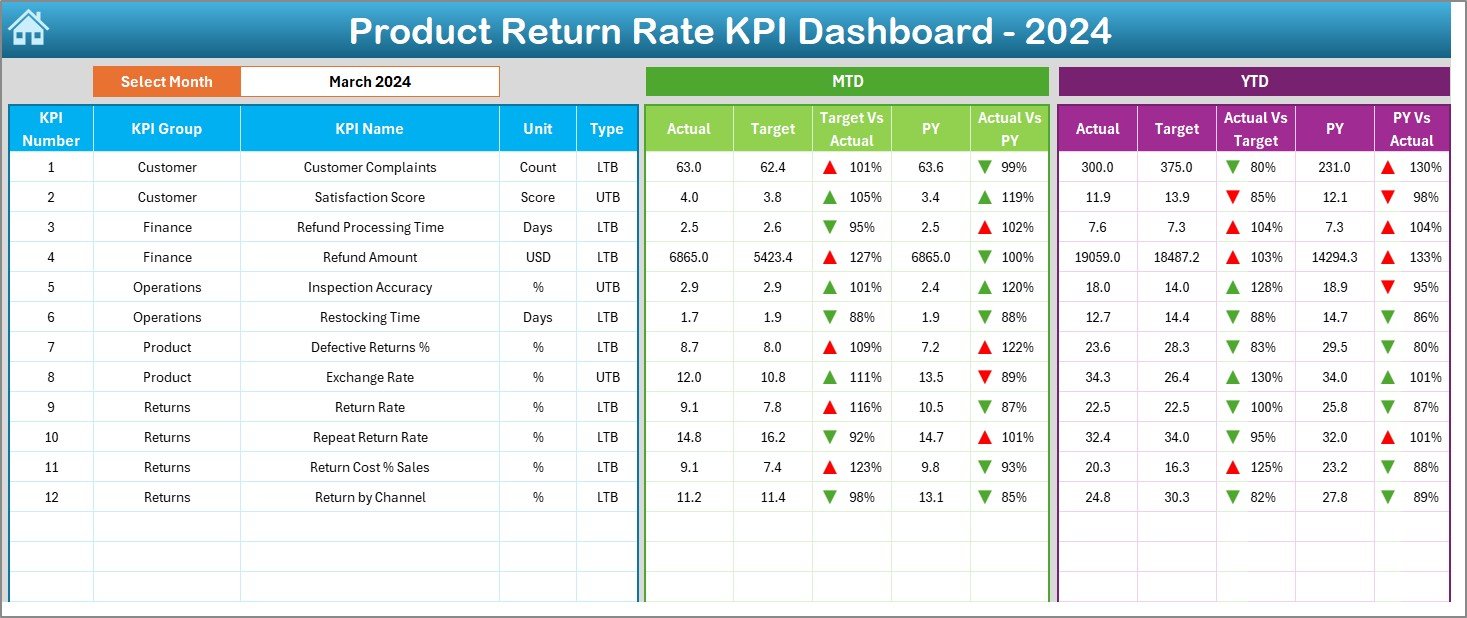
Dashboard Sheet
- The main visualization hub.
- Drop-down in cell D3 lets you select a month.
- Displays MTD (Month-to-Date) and YTD (Year-to-Date) data.
- Shows comparisons between Target vs Actual and Previous Year vs Actual.
- Includes conditional formatting arrows for quick insights on performance.
Click to buy Product Return Rate KPI Dashboard in Excel
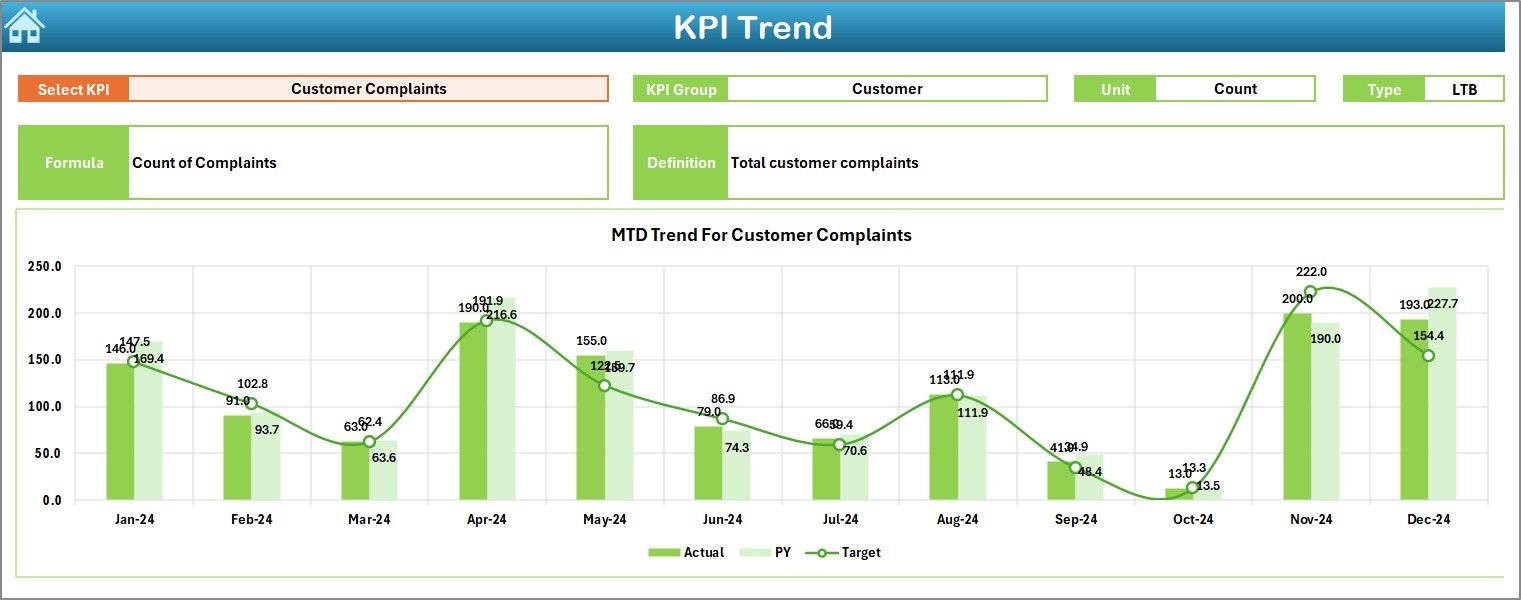
KPI Trend Sheet
- Lets you select a KPI from a drop-down (cell C3).
- Displays KPI details such as Group, Unit, Formula, and Definition.
- Provides MTD and YTD trend charts for Actual, Target, and Previous Year values.
Click to buy Product Return Rate KPI Dashboard in Excel
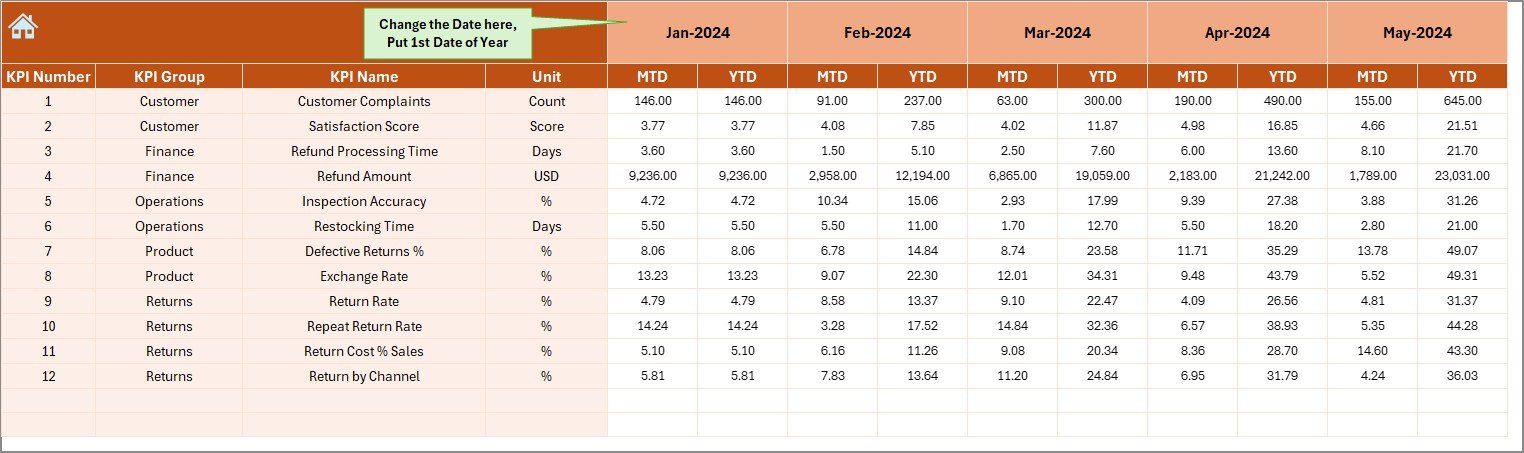
Actual Numbers Input Sheet
- Enter actual monthly and yearly return numbers.
- Simple interface: change months in cell E1 to update.
- Keeps data entry organized and error-free.
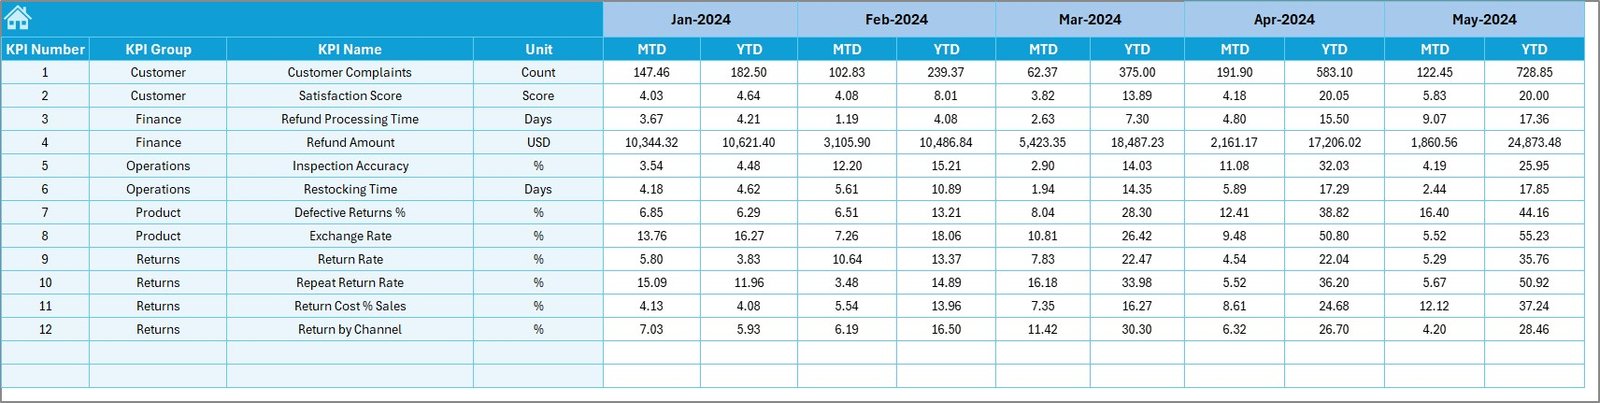
Target Sheet
- Input monthly and yearly target values for each KPI.
- Helps in tracking achievements against planned goals.
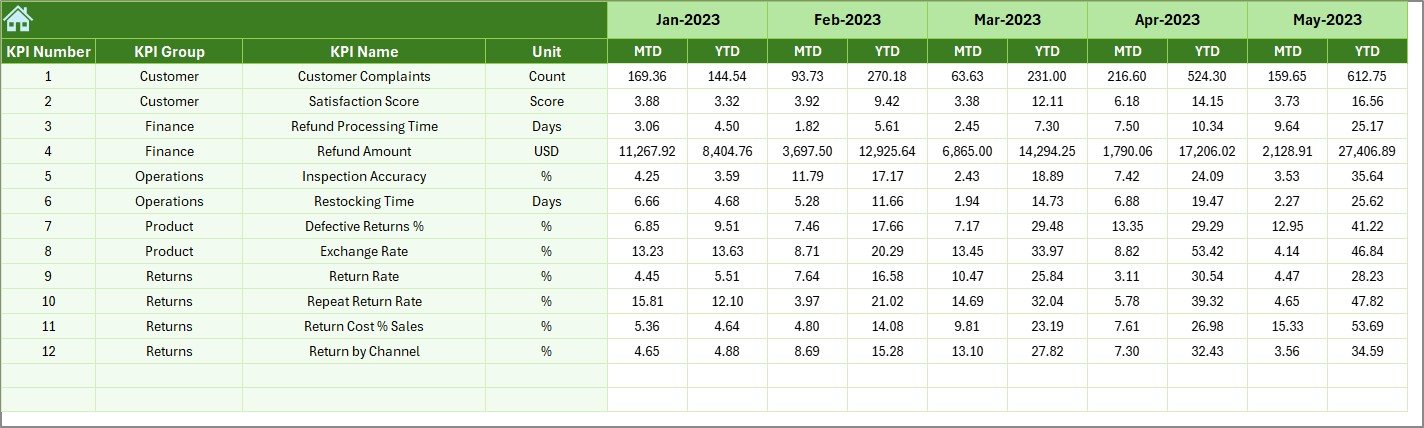
Previous Year Number Sheet
- Enter past year’s data for comparison.
- Enables trend analysis and year-over-year insights.
Click to buy Product Return Rate KPI Dashboard in Excel
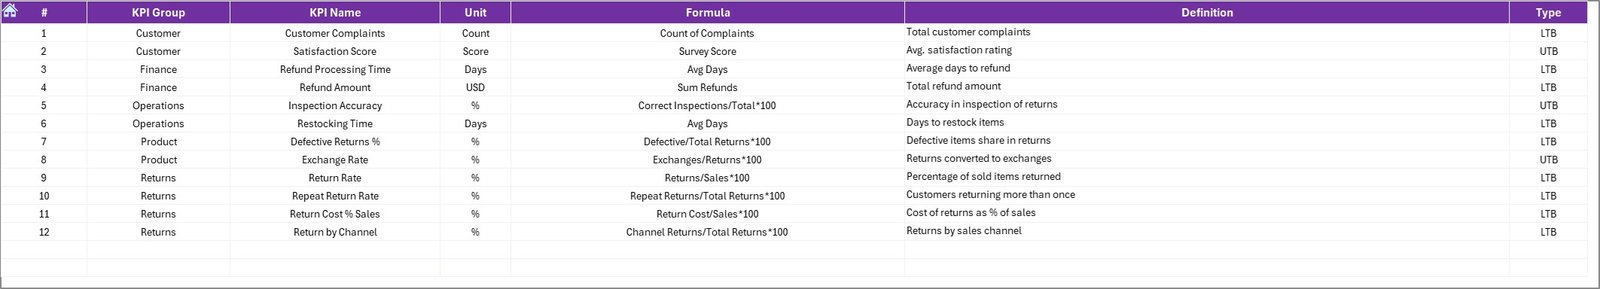
KPI Definition Sheet
- Contains all KPI details such as Name, Group, Unit, Formula, and Definition.
- Acts as a reference guide for dashboard users.
Why Do Businesses Need a Product Return Rate Dashboard?
Monitoring product returns is not just about reducing losses. It impacts the entire customer experience and profitability. Let’s explore why this dashboard matters:
- Improves Customer Satisfaction – High return rates highlight issues in quality or service. Addressing them improves trust.
- Cost Management – Returns add reverse logistics costs. Tracking helps reduce waste.
- Quality Control – Pinpoints defective products or problematic suppliers.
- Operational Efficiency – Saves time by consolidating return data in one dashboard.
- Data-Driven Decisions – Managers can see patterns and take proactive steps.
Advantages of Using Product Return Rate KPI Dashboard in Excel
Using this dashboard offers multiple benefits:
Ease of Use – Built in Excel, accessible to all.
Customization – Modify KPIs and visuals as per business needs.
Time Saving – No need to compile separate reports.
Better Insights – See return rate trends instantly.
Performance Tracking – Compare actual vs target data.
Cost Control – Identify products causing excessive returns.
Decision Making – Empower managers with real-time data.
KPIs You Can Track in the Dashboard
Some important KPIs related to product returns include:
- Product Return Rate (%) – % of returned products vs sold.
- Return by Product Category – Which categories face most returns.
- Return by Reason – Quality issues, wrong size, or shipping damage.
- Return Cost (%) – Cost of returns as a % of sales.
- On-Time Return Processing (%) – Speed of handling returns.
- Repeat Return Customers (%) – How often customers return products.
- Net Sales After Returns – Sales revenue after deducting returns.
These KPIs help businesses understand not just the return rate, but also the deeper reasons and costs behind them.
Opportunities for Improvement in Product Return Management
While dashboards provide clarity, businesses can further improve by:
- Analyzing Return Reasons – Categorize reasons to fix root causes.
- Improving Packaging – Reduces damage during transit.
- Enhancing Product Descriptions – Helps customers make informed purchases.
- Supplier Quality Checks – Ensure suppliers deliver consistent quality.
- Strengthening Return Policies – Make them fair but not overly lenient.
- Customer Feedback Integration – Use return feedback for product design.
Best Practices for Using Product Return Rate KPI Dashboard
To make the most out of this Excel dashboard, follow these practices:
- Regular Updates – Keep data entry sheets updated monthly.
- Validate Data – Double-check actual, target, and previous year numbers.
- Use Filters and Slicers – Segment data by product, category, or region.
- Monitor Trends, Not Just Numbers – Look at long-term patterns.
- Review KPIs with Teams – Share findings with quality, logistics, and sales teams.
- Automate Where Possible – Link the dashboard with sales systems for automatic updates.
- Keep Definitions Clear – Ensure KPI formulas and units are documented.
How to Create the Dashboard in Excel (Step-by-Step)
- Prepare Your Data – Collect product return numbers, targets, and previous year values.
- Set Up Sheets – Create input sheets (Actual, Target, Previous Year).
- Define KPIs – Enter KPI details in the KPI Definition sheet.
- Build Pivot Tables – Summarize data for analysis.
- Add Charts – Create line, bar, or column charts for trends.
- Apply Conditional Formatting – Use arrows and color coding.
- Link Sheets – Use formulas to connect data with dashboard visuals.
- Test the Dashboard – Select different months and check updates.
Conclusion
A Product Return Rate KPI Dashboard in Excel is more than just a reporting tool—it is a complete decision-making system. It helps businesses track return rates, compare performance, reduce costs, and improve customer satisfaction. With easy navigation, trend analysis, and KPI monitoring, managers can make smarter, faster, and more informed decisions.
By adopting this dashboard, you not only reduce the burden of manual reporting but also ensure your business stays competitive in today’s fast-paced environment.
Frequently Asked Questions (FAQs)
- What is a Product Return Rate KPI Dashboard?
It is an Excel tool that tracks and analyzes product returns, comparing them against targets and previous year data.
- Why should businesses monitor return rates?
Because high return rates increase costs, impact customer trust, and reduce profitability.
- Can I customize the dashboard?
Yes, you can add or modify KPIs, charts, and formulas as per your business needs.
- How often should I update the dashboard?
Update it monthly with actual, target, and previous year numbers.
- What kind of KPIs are included?
KPIs like product return rate, cost of returns, reasons for return, and category-wise return performance.
- Do I need advanced Excel skills to use it?
Not at all. Basic knowledge of Excel is enough since the dashboard is pre-built and user-friendly.
- How does it improve decision-making?
It provides clear visual trends and comparisons, helping managers take proactive steps to reduce returns and improve efficiency.
Visit our YouTube channel to learn step-by-step video tutorials
Watch the step-by-step video tutorial:
Click to buy Product Return Rate KPI Dashboard in Excel