Managing sales data efficiently is critical for business growth. Understanding product performance, regional sales, and customer trends allows managers to make informed decisions. To simplify this process, we have created a Product-wise Sales Dashboard in Power BI — a ready-to-use interactive dashboard designed to monitor all sales metrics in one place.
What is the Product-wise Sales Dashboard?
Click to Buy Product-wise Sales Dashboard in Power Bi
The Product-wise Sales Dashboard in Power BI is a dynamic tool that consolidates product-level sales data into one centralized platform. It enables sales managers, business analysts, and business owners to track sales performance, analyze trends, and evaluate product profitability.
With this dashboard, you can monitor metrics like total sales, quantity sold, discounts, and year-over-year (YOY) growth, all while exploring product performance by category, region, and customer.
Key Features of the Dashboard
The dashboard includes multiple pages, each tailored for detailed analysis:
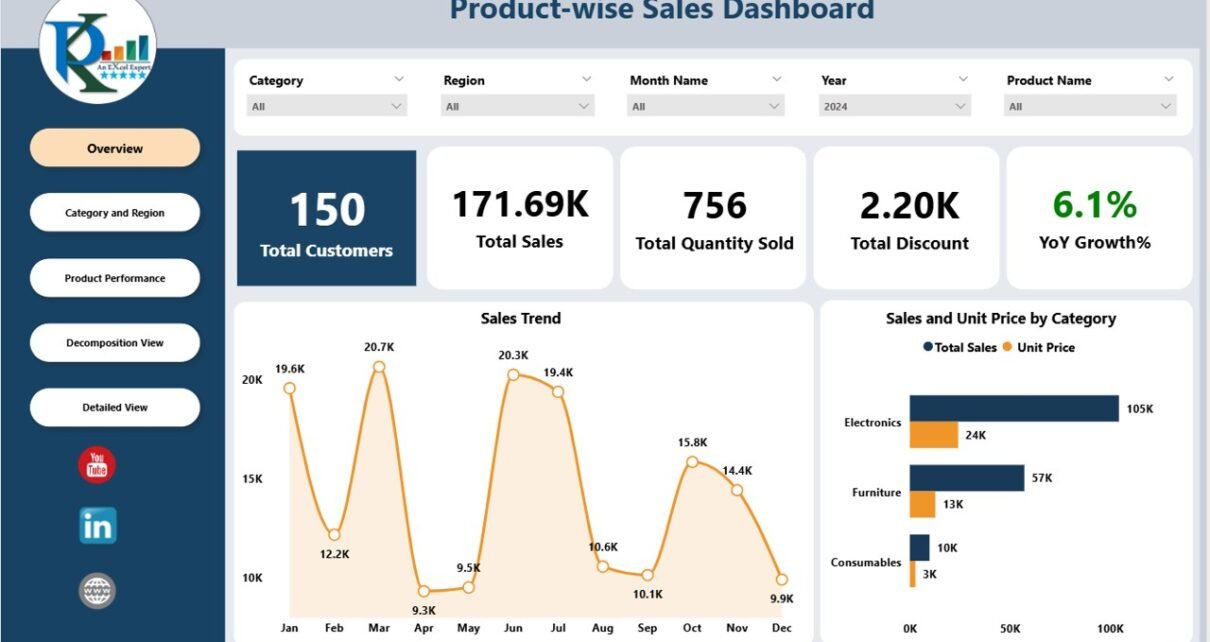
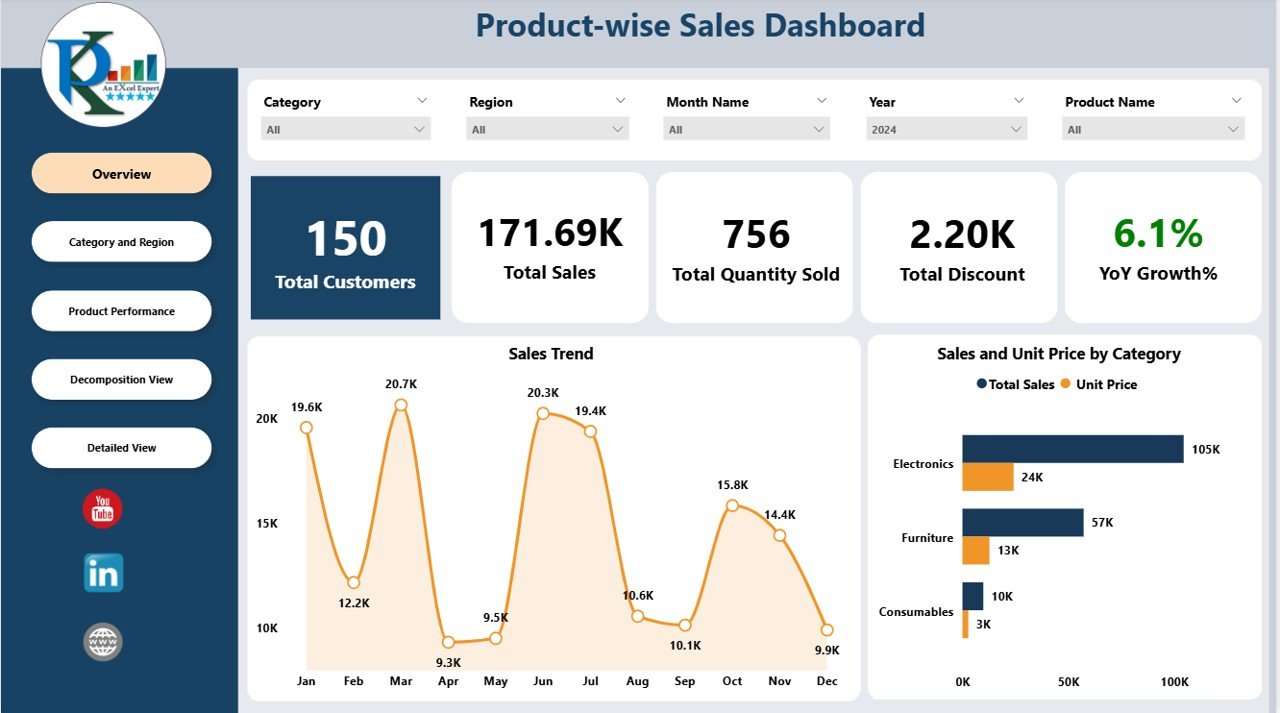
1. Overview Page
The Overview page provides a quick snapshot of overall performance with key metrics and charts.
Cards Include:
-
Total Customers
-
Total Sale
-
Total Quantity Sold
-
Total Discount
-
YOY Growth %
Charts Include:
-
Sales Trend
-
Sales and Unit Price by Category
Click to Buy Product-wise Sales Dashboard in Power Bi
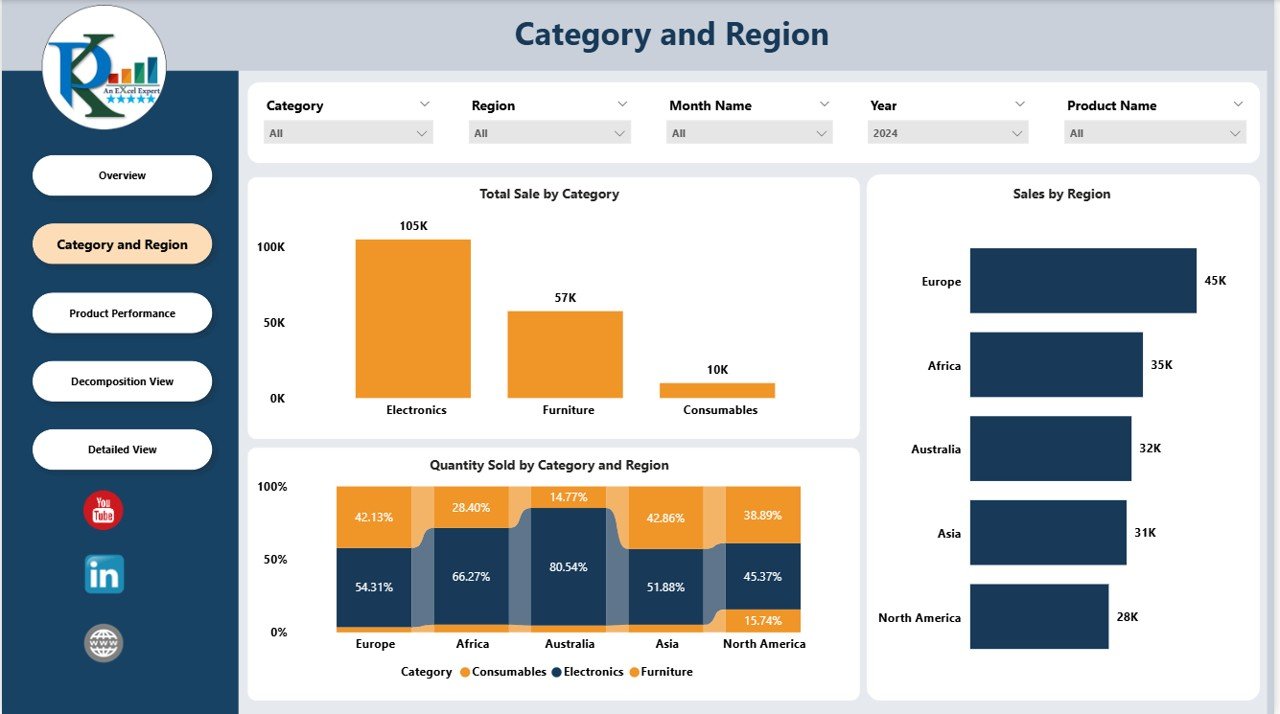
Category and Region
Additional Analysis:
-
Total Sale by Category
-
Sales by Region
-
Quantity Sold by Category and Region
This page is ideal for a high-level summary of overall sales performance.
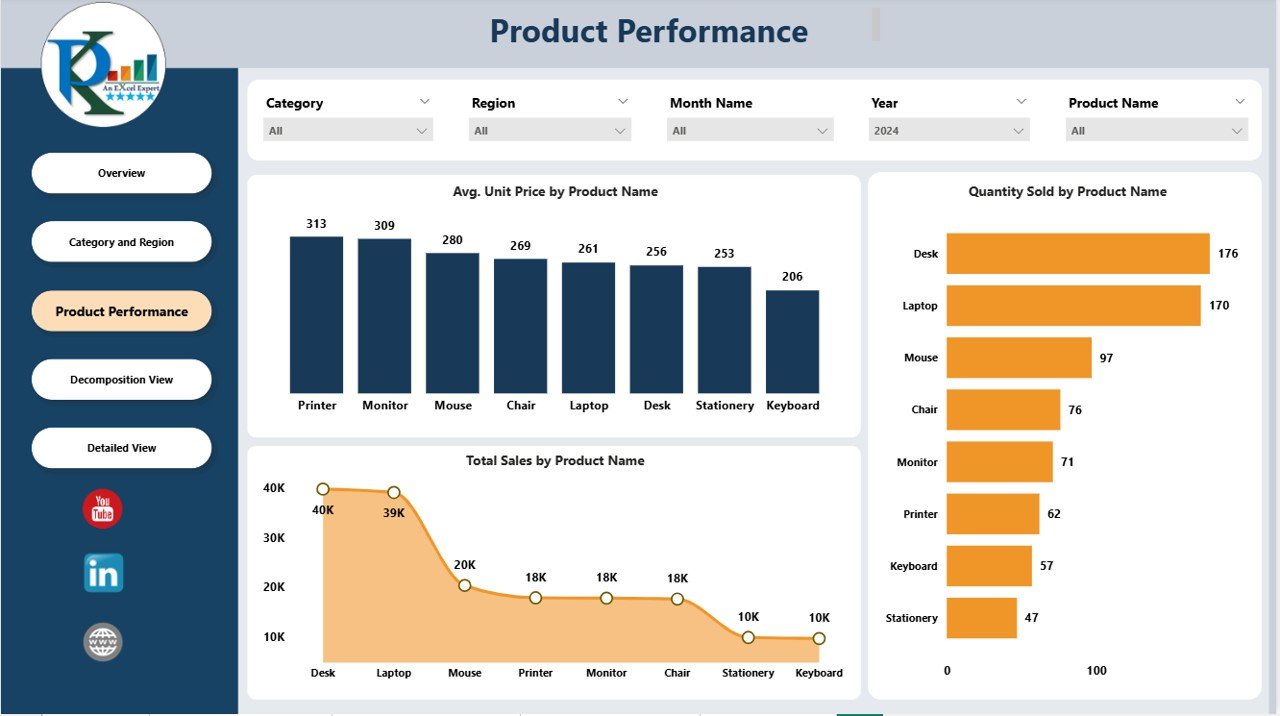
2. Product Performance Page
The Product Performance page allows detailed analysis at the product level.
Charts Include:
-
Average Unit Price by Product Name
-
Quantity Sold by Product Name
-
Total Sales by Product Name
Click to Buy Product-wise Sales Dashboard in Power Bi
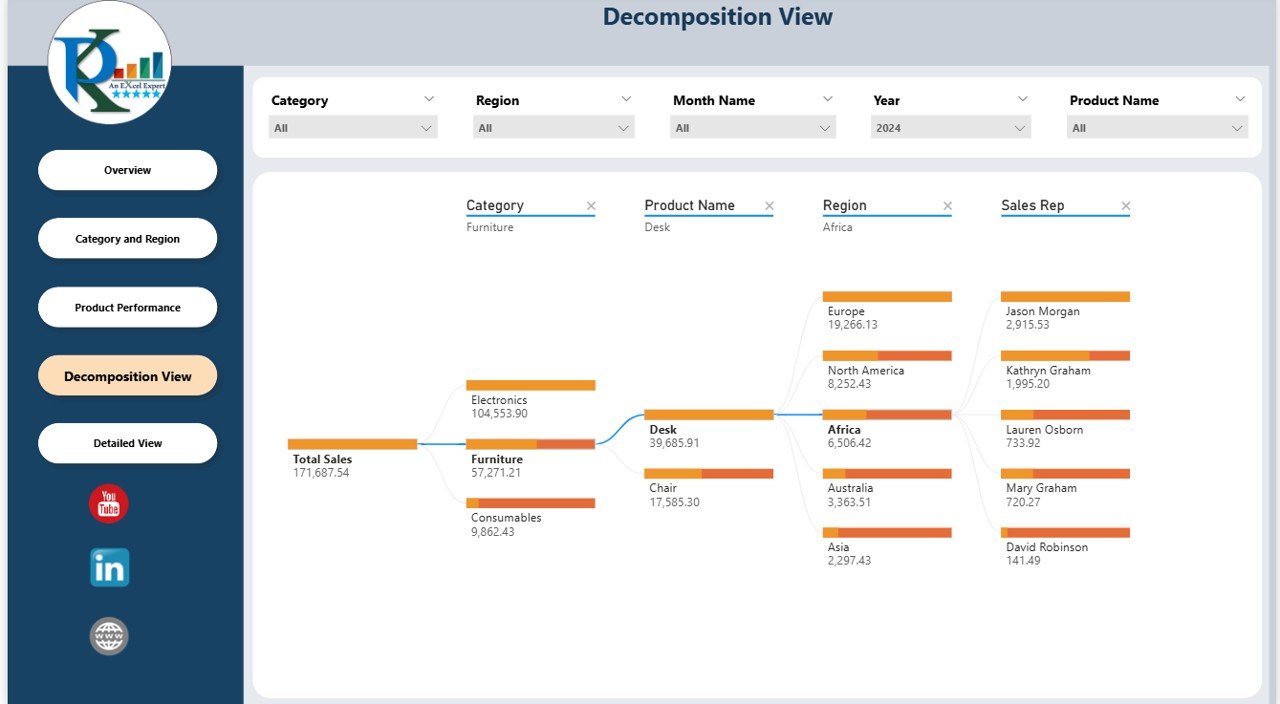
Decomposition View:
-
Decomposition Tree for deep-dive analysis of sales contribution by products, categories, and regions
This page helps identify top-performing products and those requiring attention.
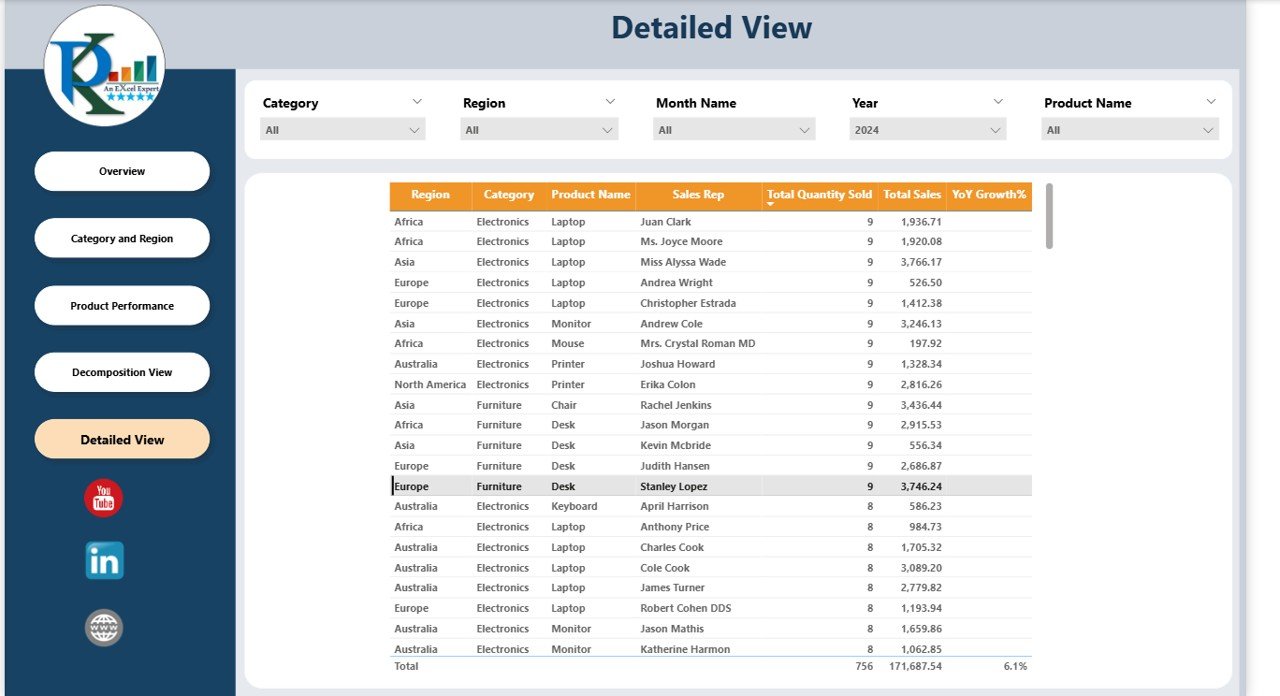
3. Detailed View Page
The Detailed View page offers granular insights into sales data.
Features Include:
-
Interactive tables with product-level sales details
-
Filtering by region, category, and customer
-
Customizable views for in-depth analysis
This page is perfect for analysts who need detailed transactional insights.
Click to Buy Product-wise Sales Dashboard in Power Bi
Advantages of Using This Dashboard
-
Centralized Sales Analysis: Monitor all product-level metrics in one place
-
Interactive Visuals: Drill down into categories, regions, and individual products
-
Trend Analysis: Identify sales trends, YOY growth, and seasonal patterns
-
Improved Decision Making: Spot high-performing and underperforming products
-
Decomposition Analysis: Understand how sales contribute across multiple dimensions
Best Practices
Click to Buy Product-wise Sales Dashboard in Power Bi
-
Regular Data Refresh: Keep sales data up to date for accurate insights
-
Use Filters Wisely: Analyze by category, region, or customer to uncover trends
-
Track KPIs Continuously: Monitor YOY growth, discounts, and total revenue for strategic decisions
-
Leverage Decomposition Tree: Dive deep into product performance for actionable insights
Conclusion
The Product-wise Sales Dashboard in Power BI is a powerful tool for sales managers and business owners to track performance, analyze trends, and make data-driven decisions. Its interactive design and comprehensive metrics ensure you always have a clear picture of your product sales perform
Visit our YouTube channel to learn step-by-step video tutorials
Watch the step-by-step video Demo:
Click to Buy Product-wise Sales Dashboard in Power Bi