Effective production planning is essential for any manufacturing business to ensure smooth operations, reduce waste, and optimize resources. The Production Planning KPI Dashboard in Excel is a powerful tool designed to track and manage key performance indicators (KPIs) related to production planning. This dashboard provides a comprehensive overview of production performance, allowing businesses to make informed decisions based on real-time data. In this article, we’ll explore the features of the Production Planning KPI Dashboard and explain how it helps businesses improve their production planning and operations.
What is the Production Planning KPI Dashboard in Excel?
The Production Planning KPI Dashboard in Excel is a template designed to help businesses track critical production planning metrics. It helps manufacturing teams monitor production efficiency, identify bottlenecks, and improve overall planning and resource utilization. The dashboard provides clear insights into various KPIs such as production output, cycle time, and inventory management. By using this dashboard, businesses can optimize their production processes and meet production targets more effectively.
The dashboard consists of seven key worksheets, each focusing on a different aspect of production planning.
Key Features of the Production Planning KPI Dashboard
The Production Planning KPI Dashboard in Excel includes the following worksheets, each offering important insights into your production planning process:
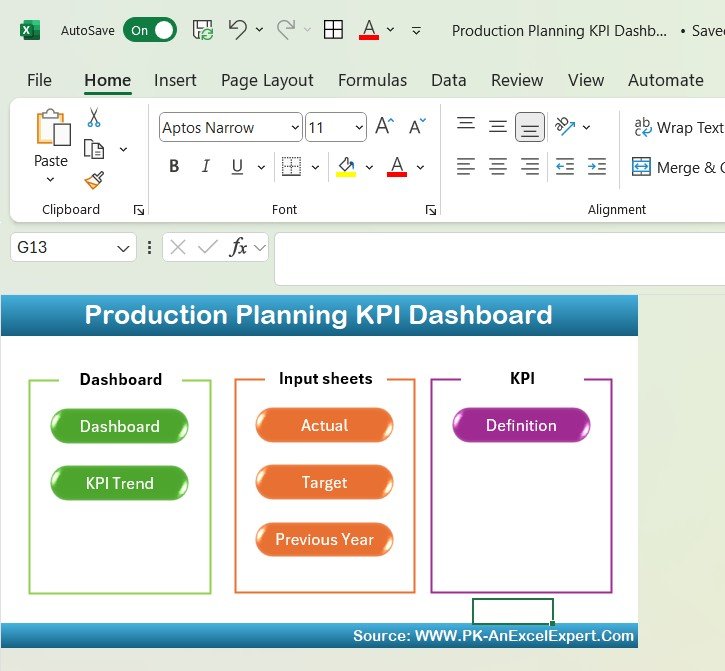
1. Home Sheet Tab
The Home Sheet serves as an introduction to the dashboard, providing a central location for navigation and key information.
Click to buy Production Planning KPI Dashboard in Excel
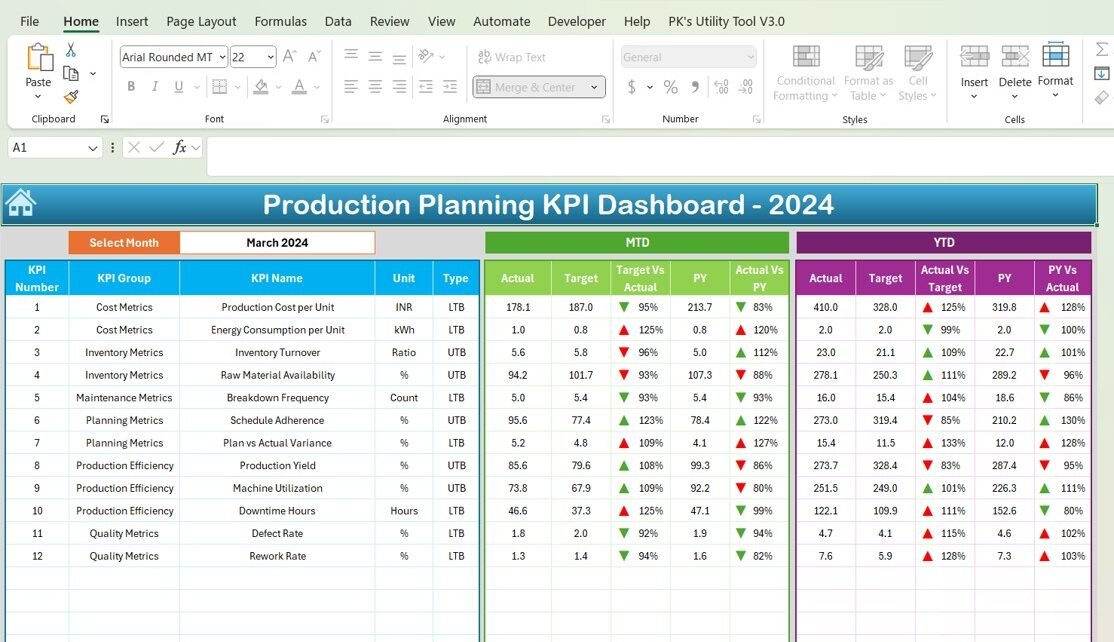
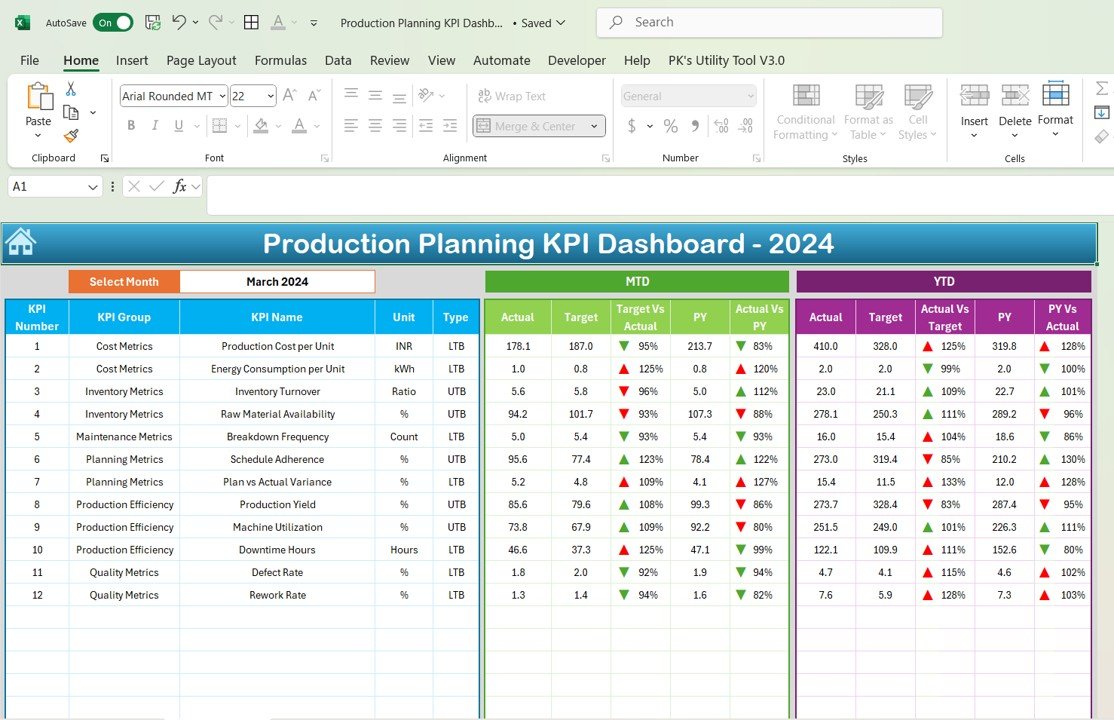
2. Dashboard Sheet Tab
The Dashboard Sheet is the main overview of the production planning performance. It includes:
-
MTD (Month-to-Date) Actuals: Displays the actual performance data for the current month.
-
YTD (Year-to-Date) Actuals: Displays the cumulative data for the year so far.
-
Target vs. Actual Comparison: Compares actual data against set targets for both MTD and YTD, with conditional formatting for visual comparison (up/down arrows).
-
Previous Year (PY) Comparison: Compares current-year data against the previous year’s data.
-
Month Selector: A dropdown (Range D3) allows users to select a specific month, and the entire dashboard updates accordingly.
Click to buy Production Planning KPI Dashboard in Excel
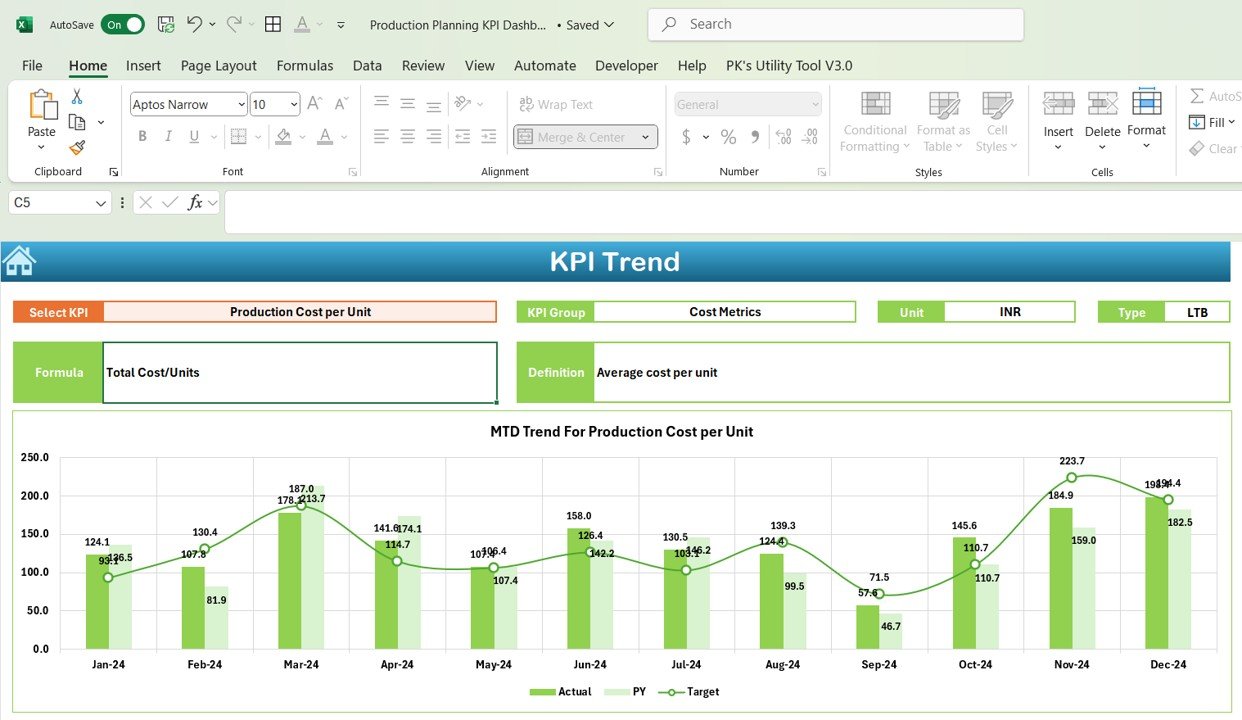
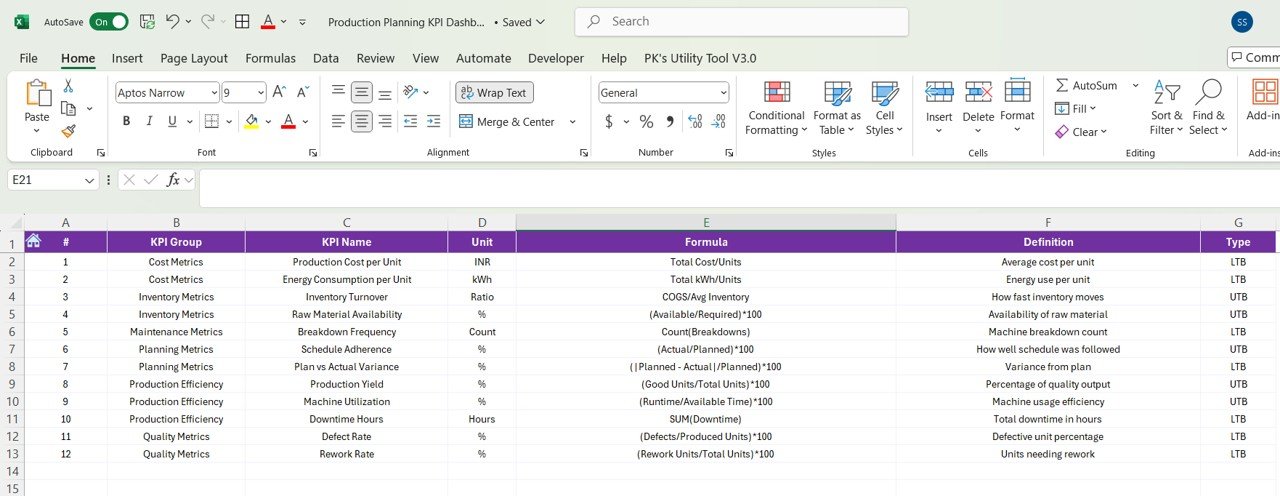
3. KPI Trend Sheet Tab
The KPI Trend Sheet provides a detailed breakdown of each KPI. It includes:
-
KPI Group: The category to which the KPI belongs (e.g., Production Efficiency, Inventory Management).
-
Unit of KPI: The unit of measurement for each KPI (e.g., units, percentage).
-
KPI Type: Whether the KPI is “Lower the Better” (LTB) or “Upper the Better” (UTB).
-
Formula: The formula used to calculate the KPI.
-
Definition: A brief explanation of what the KPI measures
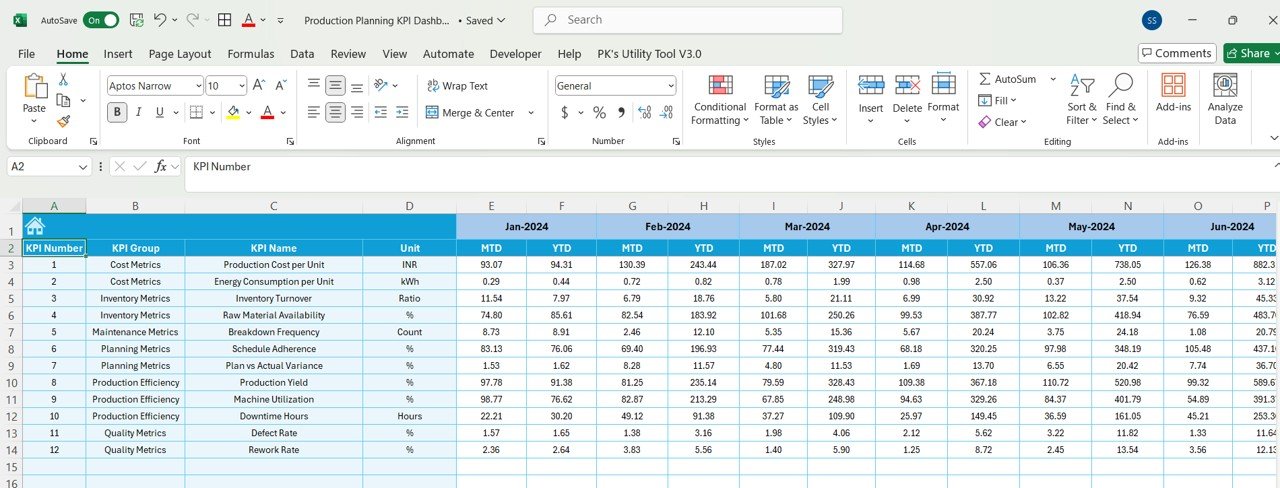
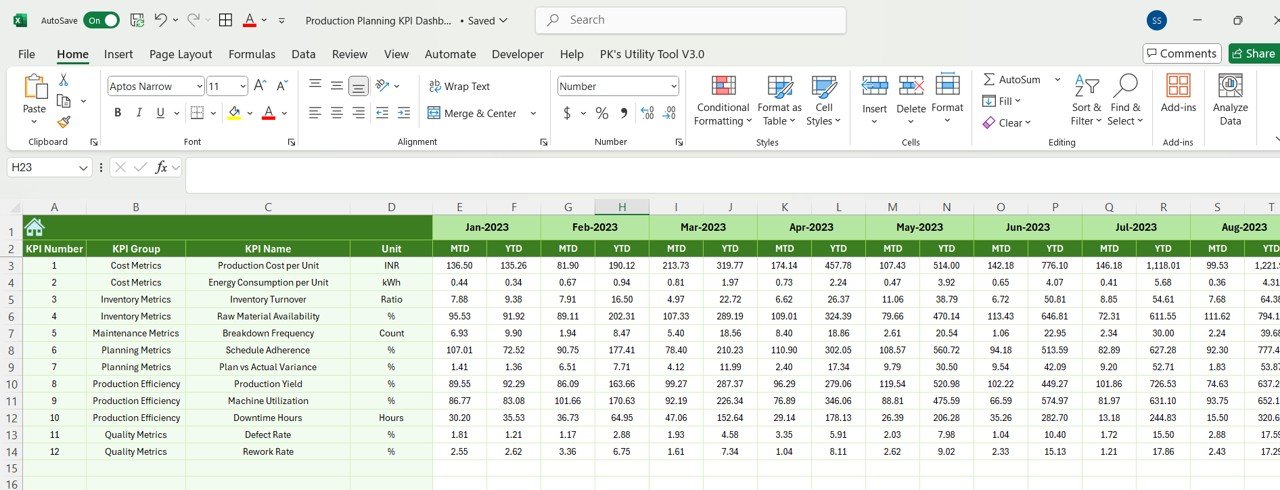
4. Actual Numbers Sheet Tab
The Actual Numbers Sheet is where you input the actual values for both MTD and YTD. The dashboard automatically updates once data is entered for the selected month

Click to buy Production Planning KPI Dashboard in Excel
5. Target Sheet Tab
The Target Sheet allows you to set target values for each KPI, both for MTD and YTD, enabling you to compare actual performance against goals.
6. Previous Year Numbers Sheet Tab
This sheet captures the data for the previous year, providing a year-over-year comparison for each KPI. Enter the previous year’s values in this sheet for a better understanding of performance trends.
Click to buy Production Planning KPI Dashboard in Excel
7. KPI Definition Sheet Tab
The KPI Definition Sheet provides clarity on each KPI, ensuring everyone involved in production planning understands the goals and metrics being tracked.
-
KPI Name
-
KPI Group
-
Unit of Measurement
-
Formula
-
KPI Definition
Advantages of Using the Production Planning KPI Dashboard
Click to buy Production Planning KPI Dashboard in Excel
-
Real-Time Insights: Track production performance in real time with MTD and YTD data.
-
Actionable Data: Easily identify areas of improvement by comparing actual performance against targets and previous year data.
-
Improved Decision-Making: Make data-driven decisions by monitoring key production metrics and adjusting processes accordingly.
-
Customizable to Your Needs: Tailor the dashboard to fit your specific production planning needs by adding or modifying KPIs.
-
Increased Efficiency: By tracking KPIs such as Cycle Time and Waste Percentage, you can identify inefficiencies and improve production processes.
Best Practices for Using the Production Planning KPI Dashboard
To get the most out of the Production Planning KPI Dashboard, consider these best practices:
-
Update Regularly: Ensure data is entered regularly to keep the dashboard current and reflect real-time performance.
-
Review Trends: Use the KPI Trend Sheet to identify trends in production performance and take corrective actions as needed.
-
Focus on Key KPIs: Monitor critical KPIs such as Production Output, Cycle Time, and Waste Percentage to improve efficiency.
-
Set Realistic Targets: Set achievable targets for each KPI to ensure continuous improvement while avoiding unattainable goals.
-
Analyze Year-over-Year Trends: Use the Previous Year Numbers Sheet to understand historical performance and track long-term progress.
Conclusion
Click to buy Production Planning KPI Dashboard in Excel
The Production Planning KPI Dashboard in Excel is an essential tool for businesses looking to optimize their production processes. By tracking KPIs such as Production Output, Cycle Time, and Waste Percentage, this dashboard enables manufacturers to improve operational efficiency, reduce costs, and meet production goals. With real-time insights and the ability to customize the dashboard to your needs, this tool is an invaluable asset for any production planning team.
Frequently Asked Questions (FAQs)
1. What KPIs are most important for tracking in the Production Planning Dashboard?
Key KPIs include Production Output, Cycle Time, Inventory Turnover, Order Fulfillment Rate, and Waste Percentage.
2. How can I update the data in the dashboard?
You can update the dashboard by entering actual data for MTD and YTD in the Actual Numbers Sheet, and inputting target data in the Target Sheet.
3. Can I customize the dashboard to track additional metrics?
Yes, the dashboard is fully customizable. You can add new KPIs or adjust existing ones based on your business’s production planning goals.
4. How often should the dashboard be updated?
It’s recommended to update the dashboard regularly, ideally on a monthly or weekly basis, to keep track of production progress.
5. Can I track production performance across multiple facilities?
Yes, the dashboard is adaptable. You can modify it to track production performance across different facilities or departments.
Visit our YouTube channel to learn step-by-step video tutorials
Watch the step-by-step video Demo:
Click to buy Production Planning KPI Dashboard in Excel