Every business needs a clear and accurate view of its financial performance. Without proper tracking, companies struggle to understand revenue trends, monitor expenses, analyze profitability, and make smart financial decisions. This is where a Profit and Loss (P&L) Template in ExcelCash Flow Template in Excel becomes extremely valuable.
This ready-to-use template helps companies track monthly financials, calculate profits, compare revenue and expenses, and evaluate year-to-date (YTD) performance—all in a clean and easy-to-understand format.
In this article, we explain everything about the Profit and Loss Template in Excel, including its structure, features, benefits, and the dashboard included. You will also see how this template helps you analyze your business month by month.
What Is a Profit and Loss Template in Excel?
A Profit and Loss (P&L) Template in Excel is a financial statement that shows your company’s total revenue, expenses, profit/loss, and earnings before tax for each month. It helps you measure financial performance over time and understand whether you are making profit or facing loss.
This ready-to-use Excel template allows you to:
- Track monthly revenue and expenses
- Calculate gross profit and net profit
- Monitor cost of goods sold (COGS)
- Compare monthly results
- Get a year-to-date profit summary
- Use dashboard charts for quick visual insights
Because the template is built in Excel, it is simple to modify, add data, or customize based on business needs.
Template Structure Explained
Click to Buy Profit and Loss (P&L) Template in Excel
The Profit and Loss Template in Excel contains two main sheets:
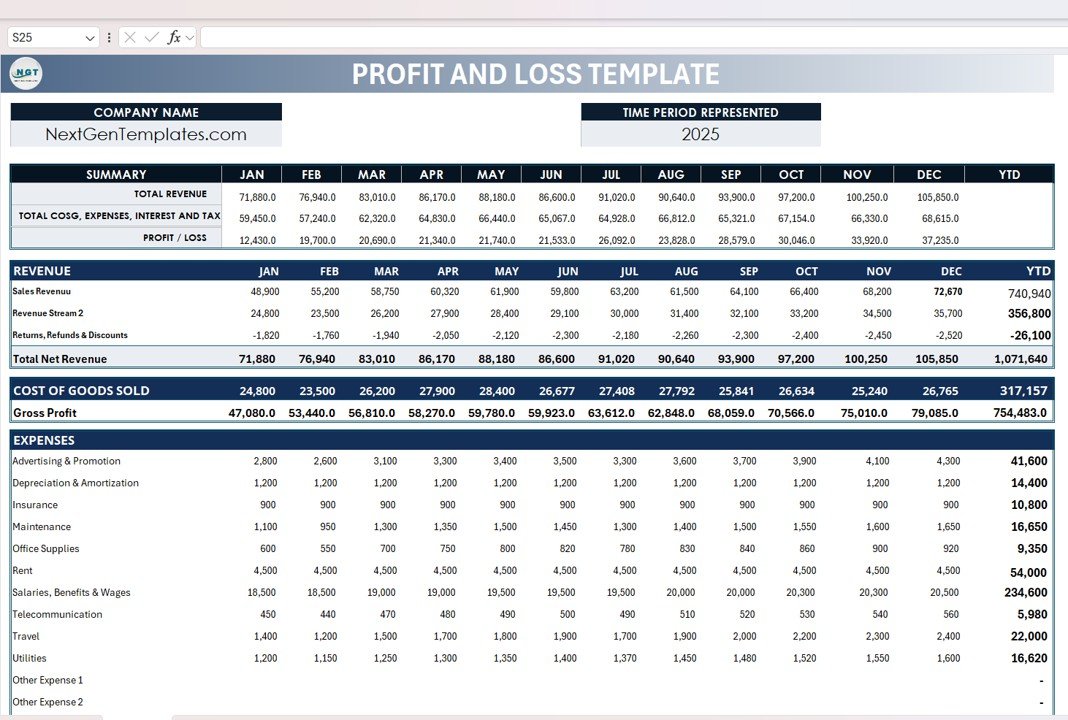
1. Template Sheet Tab
The Template sheet contains all monthly financial data and calculations. It covers revenue, COGS, expenses, taxes, gross profit, net profit, and YTD totals.
Below is a breakdown of each section:
A. Company Header
At the top, you enter:
- Company Name
- Financial Year / Time Period
- Website or brand name (e.g., NextGenTemplates.com)
B. Summary Section (Monthly & YTD View)
The Summary provides a complete month-by-month financial overview with automatic YTD calculations.
Summary KPIs (JAN–DEC + YTD):
- Total Revenue
- Total COGS, Expenses, Interest, and Tax
- Profit / Loss
This helps companies instantly see profit growth throughout the year.
C. Revenue Section
This section provides monthly revenue details across multiple revenue streams.
Includes:
- Sales Revenue
- Revenue Stream 2
- Returns, Refunds & Discounts (shown as negative values)
- Total Net Revenue
The template automatically calculates YTD Net Revenue.
D. Cost of Goods Sold (COGS)
Click to Buy Profit and Loss (P&L) Template in Excel
This section shows monthly COGS and YTD COGS totals.
Includes:
- Material cost
- Production cost
- Vendor charges
- Other direct costs
The template calculates Gross Profit using:
Gross Profit = Total Net Revenue – COGS
E. Expenses Section
A detailed expenses section is included for accurate reporting.
Expense Categories:
- Advertising & Promotion
- Depreciation & Amortization
- Insurance
- Maintenance
- Office Supplies
- Rent
- Salaries, Benefits & Wages
- Telecommunication
- Travel
- Utilities
- Other Expenses (Option to add three additional expense types)
A Total Expenses row automatically sums all monthly expenses.
F. Earnings & Taxes
Based on revenue, COGS, and expenses, the following values are calculated:
-
Earnings Before Interest & Taxes (EBIT)
-
Interest Expense
-
Profit Before Taxes
-
Income Taxes
-
Profit After Tax (Net Profit)
This gives you a complete financial picture for each month.
Click to Buy Profit and Loss (P&L) Template in Excel
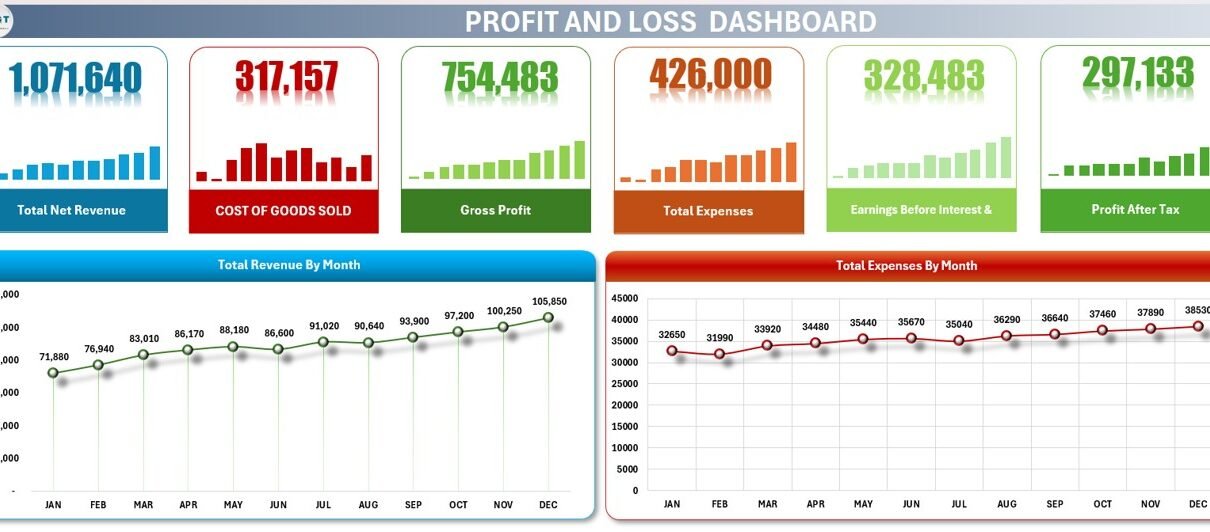
2. Dashboard Sheet Tab
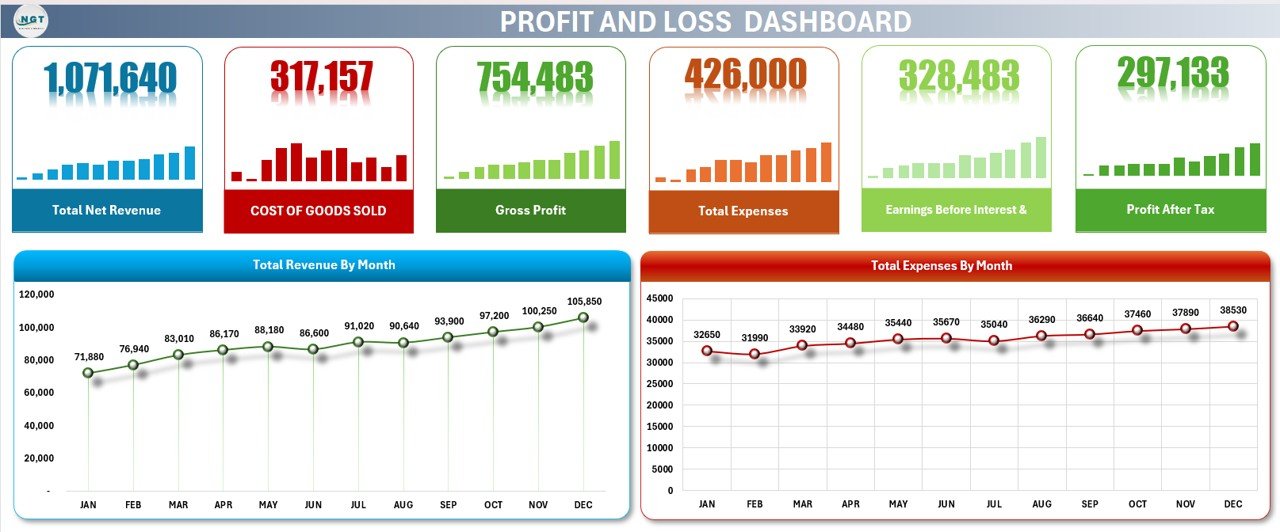
This template also includes a visual dashboard that summarizes key financial figures with cards and charts.
Dashboard Cards Display:
- Total Net Revenue
- Cost of Goods Sold (COGS)
- Gross Profit
- Total Expenses
- Earnings Before Interest & Taxes (EBIT)
- Profit After Tax
These cards allow you to instantly see your company’s financial health.
Dashboard Charts Display:
- Total Revenue by Month: Shows monthly revenue trends and seasonal fluctuations.
- Total Expenses by Month: Helps businesses compare cost trends and identify months with higher expenses.
This dashboard gives managers a clear visual understanding of income, costs, and profitability over time.
Click to Buy Profit and Loss (P&L) Template in Excel
Advantages of Using This Profit & Loss Template in Excel
- Accurate Monthly Financial Tracking: Track income and expenses for every month.
- Automatic Calculations: All totals, gross profit, expenses, and net profit update automatically.
- Clear Revenue & Cost Breakdown: Understand exactly where money is coming from and where it is going.
- Visual Dashboard for Fast Insights: Charts and cards help you analyze trends quickly.
- Year-to-Date Performance Overview: See how revenue, expenses, and profit grow throughout the year.
- Easy Customization: Add more revenue streams or expense categories anytime.
- Great for Small & Medium Businesses: Perfect for business owners, accountants, and managers.
Opportunities for Improvement
To make the template even more advanced, you can add:
- Scenario Analysis (Best / Worst Case): Forecast how revenue changes impact profits.
- Automated Alerts: Color-coded alerts for abnormal expenses or low profits.
- Break-Even Analysis: Add break-even points for decision-making.
- Additional Dashboards: Include charts for profitability ratio, operating margin, and segment-wise revenue.
- Currency Converter: Use formulas to calculate revenue in multiple currencies.
Best Practices for Using the P&L Template
Click to Buy Profit and Loss (P&L) Template in Excel
- Update Revenue & Expense Data Monthly: Accurate data keeps your financials correct.
- Review Dashboard Charts Weekly: Analyze trends and identify unusual spikes.
- Compare with Previous Year: Understand long-term business performance.
- Add Notes for Major Expenses: Maintain clarity for audits and reporting.
- Keep Backup Copies; Store monthly versions for safekeeping.
Conclusion
The Profit and Loss Template in Excel provides everything a business needs for accurate financial reporting. It offers a clean structure, detailed financial categories, and a visual dashboard to help managers, accountants, and business owners make informed decisions.
Whether you want to track monthly profitability, manage expenses, analyze revenue trends, or prepare financial reports, this template gives you a complete and professional solution.
Frequently Asked Questions (FAQs)
Click to Buy Profit and Loss (P&L) Template in Excel
1. What is a Profit and Loss Template?
A P&L template helps businesses track revenue, expenses, and profit monthly.
2. Who should use this template?
Business owners, accountants, financial analysts, managers, and startups.
3. Can I customize this template?
Yes, you can add or modify revenue streams, expenses, and formulas.
4. Does the template calculate profit automatically?
Yes, all totals and profit formulas update instantly.
5. Is a dashboard included?
Yes, it includes cards and charts for revenue, expenses, and profit analysis.
6. Can I add more months or years?
Yes, you can extend the template easily.
Visit our YouTube channel to learn step-by-step video tutorials
Click to Buy Profit and Loss (P&L) Template in Excel