In today’s healthcare manufacturing industry, prosthetics manufacturers must maintain high precision, quality standards, and operational efficiency. Companies design and produce artificial limbs and assistive devices that directly impact patient lives. Therefore, tracking performance accurately becomes critical.
However, many prosthetics manufacturing units still depend on manual spreadsheets and disconnected reports. As a result, they face delays, inefficiencies, and lack of visibility into production performance.
Therefore, organizations now adopt data-driven solutions to monitor operations effectively. One of the most powerful tools is the Prosthetics Manufacturing KPI Dashboard in Power BI.
This dashboard provides a centralized platform to track production KPIs, monitor quality, analyze trends, and improve decision-making. In this comprehensive guide, you will learn everything about the Prosthetics Manufacturing KPI Dashboard in Power BI, including its features, structure, benefits, best practices, and FAQs.
What is a Prosthetics Manufacturing KPI Dashboard in Power BI?
A Prosthetics Manufacturing KPI Dashboard in Power BI is an interactive analytics tool designed to monitor and evaluate manufacturing performance in prosthetic production facilities.
It collects data from Excel and transforms it into visual insights such as:
- KPI cards
- Trend charts
- Target vs actual comparisons
- Performance indicators
Because the dashboard centralizes all information, users can easily monitor production efficiency, quality metrics, and delivery performance.
Moreover, Power BI enables real-time data analysis, which helps managers make faster and better decisions.
Why Do Prosthetics Manufacturers Need a KPI Dashboard?
Prosthetics manufacturing involves multiple complex processes such as design, assembly, quality testing, and delivery. Therefore, managing these processes manually becomes difficult.
A KPI dashboard simplifies performance tracking.
Manufacturers need a KPI dashboard because it helps to:
- Monitor production efficiency
- Track defect rates and quality control
- Measure delivery timelines
- Improve resource utilization
- Identify operational bottlenecks
As a result, companies can enhance productivity and deliver better patient outcomes.
Key Features of the Prosthetics Manufacturing KPI Dashboard in Power BI
Click to Buy Prosthetics Manufacturing KPI Dashboard in Power BI
The dashboard includes three interactive pages, each designed for detailed analysis.
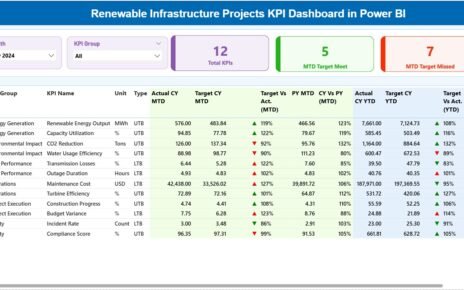
1. Summary Page – Overall Performance Overview
The Summary Page provides a complete snapshot of manufacturing performance.
Interactive Filters
At the top of the dashboard, users can apply:
-
Month slicer
-
KPI Group slicer
Because of these filters, users can analyze data by time period and KPI category.
KPI Cards
The dashboard displays three key indicators:
-
Total KPIs Count
-
MTD Target Meet Count
-
MTD Target Missed Count
These cards help users quickly assess performance status.
Detailed KPI Table
The table provides in-depth KPI details.
KPI Number
Represents the unique sequence of KPIs.
KPI Group
Categories such as:
-
Production efficiency
-
Quality control
-
Delivery performance
KPI Name
Displays the KPI being tracked.
Unit
Defines measurement units such as:
-
Units produced
-
Percentage
-
Time
KPI Type
-
LTB (Lower the Better)
-
UTB (Upper the Better)
Month-To-Date (MTD) Metrics
Actual CY MTD
Current month performance.
Target CY MTD
Target for the current month.
MTD Icon
-
▲ Green → Achieved
-
▼ Red → Not achieved
Target vs Actual (MTD)
Formula:
Actual / Target
PY MTD
Previous year’s same month value.
CY vs PY (MTD)
Formula:
Current Year / Previous Year
Because of this comparison, managers can track growth.
Year-To-Date (YTD) Metrics
Actual CY YTD
Cumulative yearly performance.
Target CY YTD
Annual target values.
YTD Icon
-
▲ Green → Good
-
▼ Red → Needs improvement
Target vs Actual (YTD)
Formula:
Actual YTD / Target YTD
PY YTD
Previous year cumulative data.
CY vs PY (YTD)
Compares current year vs previous year performance.

Click to Buy Prosthetics Manufacturing KPI Dashboard in Power BI
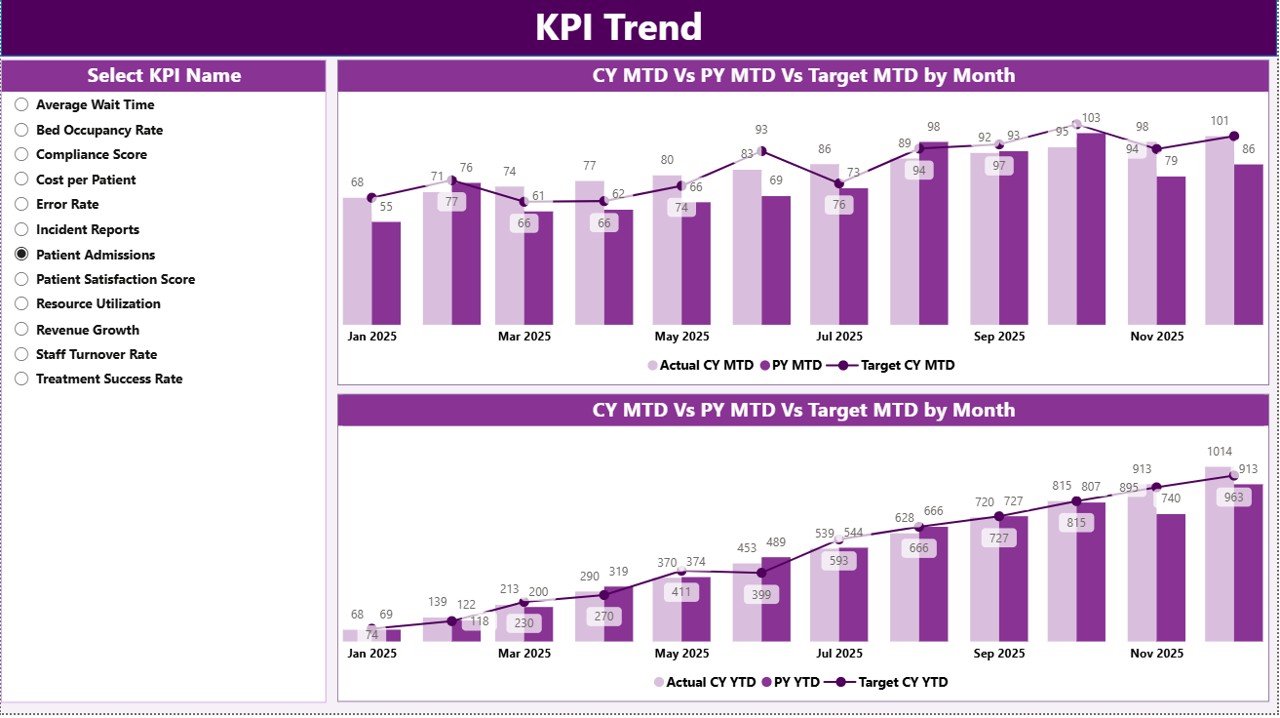
2. KPI Trend Page – Performance Trends Analysis
The KPI Trend Page shows how KPIs perform over time.
Key features:
-
Two combo charts
-
Comparison of:
- Current Year
- Previous Year
- Targets
KPI Slicer
Users can select a KPI from the slicer.
Therefore, they can:
-
Identify production trends
-
Analyze seasonal variations
-
Detect performance issues
Click to Buy Prosthetics Manufacturing KPI Dashboard in Power BI
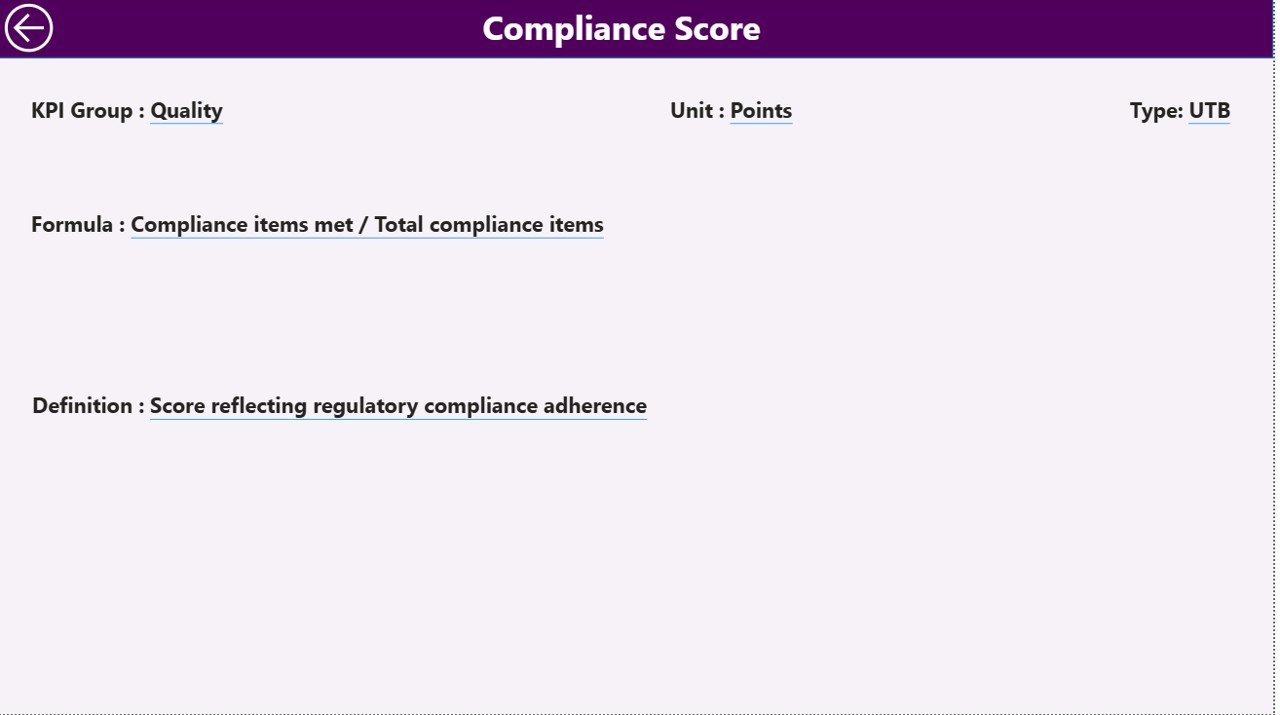
3. KPI Definition Page – KPI Documentation
The KPI Definition Page provides detailed KPI information.
It is a hidden drill-through page accessible from the Summary Page.
It includes:
-
KPI Number
- KPI Group
- KPI Name
- Unit
- Formula
- Definition
- KPI Type
Because of this, users understand each KPI clearly.
Click to Buy Prosthetics Manufacturing KPI Dashboard in Power BI
Excel Data Source Structure
The dashboard uses an Excel file with three sheets.
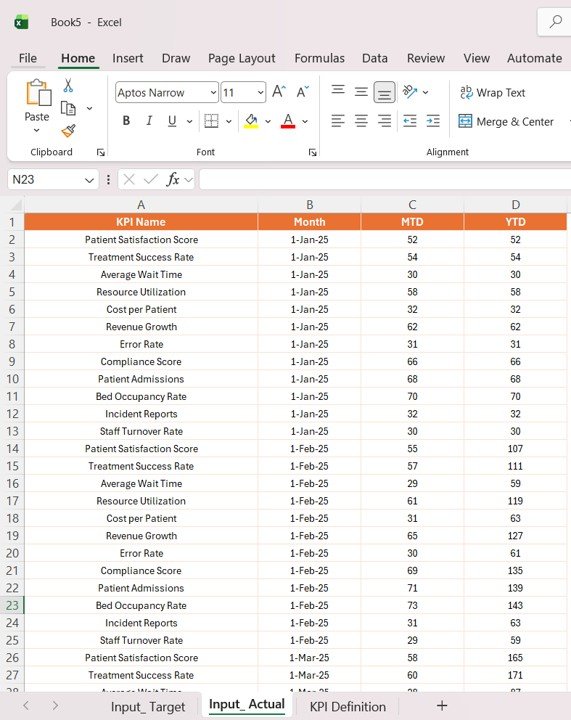
1. Input_Actual Sheet
contains actual performance data.
Fields:
-
KPI Name
-
Month
-
MTD values
-
YTD values
Click to Buy Prosthetics Manufacturing KPI Dashboard in Power BI
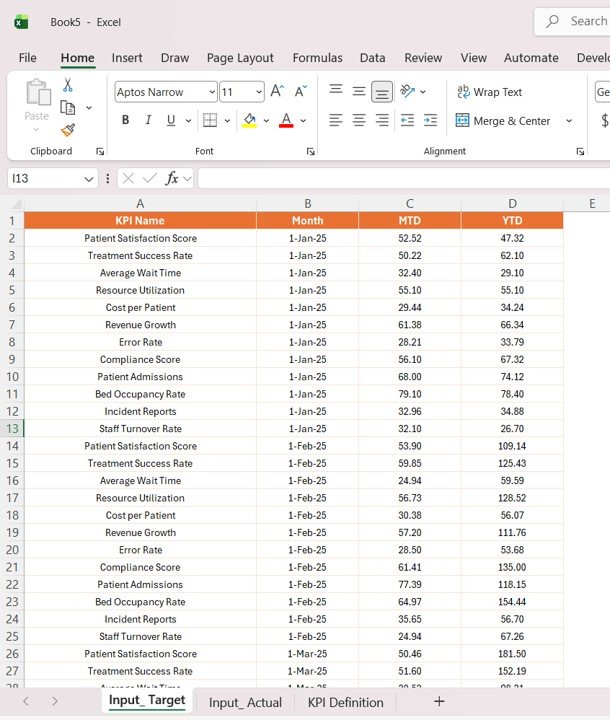
2. Input_Target Sheet
Stores target values.
Fields:
-
KPI Name
-
Month
-
Target MTD
-
Target YTD
3. KPI Definition Sheet
Contains KPI metadata.
Fields:
-
KPI Number
-
KPI Group
-
KPI Name
-
Unit
-
Formula
-
Definition
-
Type

Click to Buy Prosthetics Manufacturing KPI Dashboard in Power BI
Advantages of Prosthetics Manufacturing KPI Dashboard in Power BI
1. Centralized Monitoring
All production data is available in one place.
2. Improved Decision-Making
Managers can make quick decisions using visual insights.
3. Real-Time Insights
Power BI updates data dynamically.
4. Better Quality Control
The dashboard tracks defects and performance metrics.
5. Enhanced Productivity
Manufacturers can identify inefficiencies and improve processes.
Opportunities for Improvement in Prosthetics Manufacturing
- Automate production data collection
- Integrate ERP systems
- Track real-time machine performance
- Monitor supply chain metrics
- Improve quality inspection processes
Best Practices for the Prosthetics Manufacturing KPI Dashboard
Click to Buy Prosthetics Manufacturing KPI Dashboard in Power BI
1. Define Relevant KPIs
Use KPIs such as:
-
Production output
-
Defect rate
-
Order fulfillment rate
-
Lead time
2. Ensure Data Accuracy
Accurate data ensures reliable insights.
3. Update Data Regularly
Frequent updates improve decision-making.
4. Standardize KPI Definitions
Use consistent formulas across teams.
5. Train Users
Ensure staff understand dashboard usage.
Click to Buy Prosthetics Manufacturing KPI Dashboard in Power BI
Conclusion
The Prosthetics Manufacturing KPI Dashboard in Power BI is a powerful solution for modern manufacturing environments. It centralizes data, improves visibility, and enhances decision-making.
Because the dashboard integrates Excel data with Power BI, it provides flexibility and scalability. Moreover, interactive features allow users to analyze performance quickly.
Therefore, manufacturers can improve operational efficiency, ensure product quality, and achieve business growth.
Visit our YouTube channel to learn step-by-step video tutorials
Click to Buy Prosthetics Manufacturing KPI Dashboard in Power BI