Religious and faith-based organizations play a powerful role in communities. They guide spiritual growth, support families, run community programs, organize charitable events, and help people develop a deeper sense of purpose. Because of this, leaders want clear and timely insights about programs, donations, events, outreach performance, and community engagement. However, the challenge grows when data sits in scattered sheets, handwritten registers, and multiple volunteer notes.
A Religious & Faith-Based Organizations KPI Dashboard in Excel solves this problem. It brings all key performance indicators (KPIs) into one interactive and visual platform. Leaders, volunteers, and administrators get accurate numbers in seconds. They understand trends better, plan programs smarter, and monitor progress throughout the year.
In this detailed guide, you will explore everything about this Excel-based dashboard, including its structure, features, benefits, and best practices. You will also find answers to the most common questions at the end.
Click to buy Religious & Faith-Based Organizations KPI Dashboard in Excel
What Is a Religious & Faith-Based Organizations KPI Dashboard in Excel?
A Religious & Faith-Based Organizations KPI Dashboard in Excel is a ready-to-use reporting tool that helps temples, churches, mosques, spiritual centers, and nonprofit faith organizations track their performance throughout the year. It organizes data about donations, attendance, volunteer activities, spiritual programs, membership, outreach events, and community support into one simple dashboard.
Because the dashboard functions inside Excel, you can use it easily without any complex software. It provides visual charts, trend lines, interactive slicers, KPI definitions, and comparison views like MTD (Month-to-Date), YTD (Year-to-Date), and Previous Year numbers. This structure helps faith-based leaders make clear, meaningful, and timely decisions.
Why Do Faith-Based Organizations Need a KPI Dashboard?
Faith-based organizations handle countless activities every month. They run cultural events, workshops, charity drives, counseling sessions, community meals, educational programs, and mission activities. Each activity needs monitoring.
However, most organizations still track everything manually. Because of this, leaders often struggle to answer questions like:
- How many people attended the services this month?
- Did donation levels increase or decrease this year?
- Are volunteer hours improving?
- Which programs show the highest engagement?
- Are we meeting our annual outreach goals?
A KPI dashboard solves all these challenges. It offers a complete analytical view of all activities and performance metrics.
Key Features of the Religious & Faith-Based Organizations KPI Dashboard in Excel
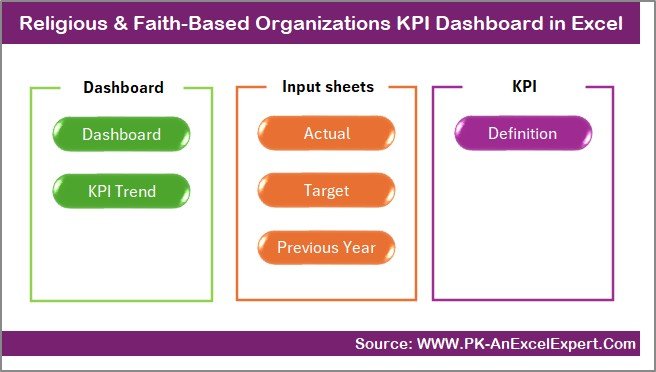
We have created this dashboard with seven powerful worksheets that simplify data entry, analysis, and decision-making. Below is a clear explanation of each sheet.
Summary Page – Your Central Navigation Panel
The Summary Page works as the index page of the entire file. It offers six buttons that help you jump directly to important sheets. This improves speed because you don’t scroll through tabs manually.
Users click once and move instantly to:
- Dashboard
- Trend Analysis
- Actual Input
- Target Input
- Previous Year Numbers
- KPI Definition
This page saves time and makes the file feel more like an application rather than a simple spreadsheet.
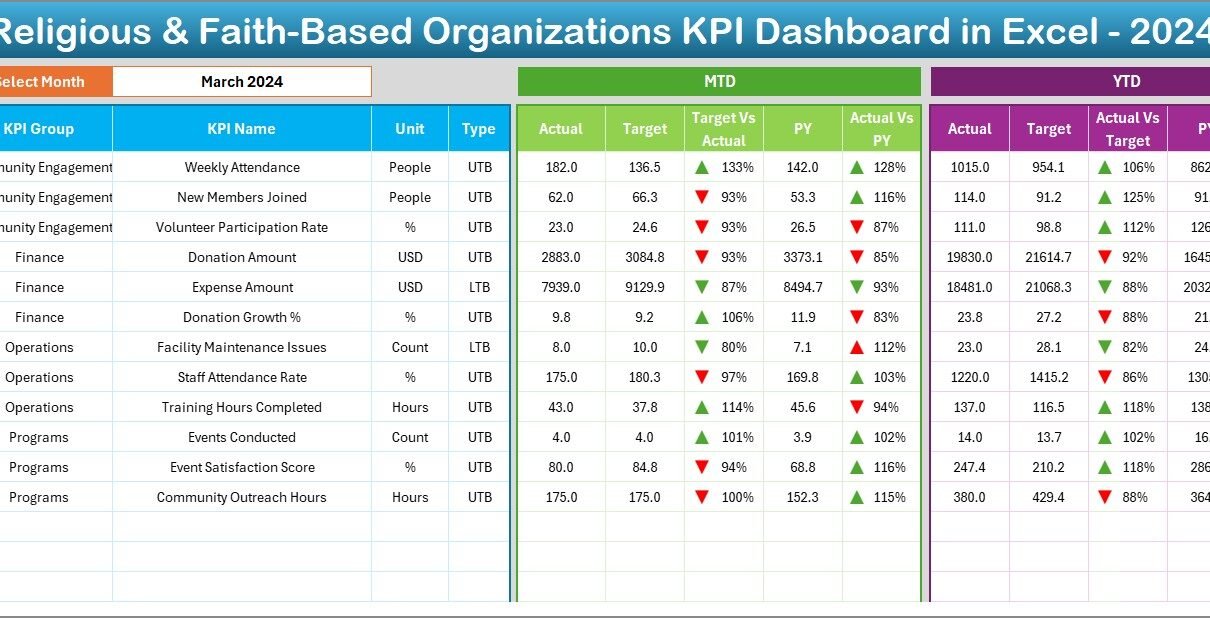
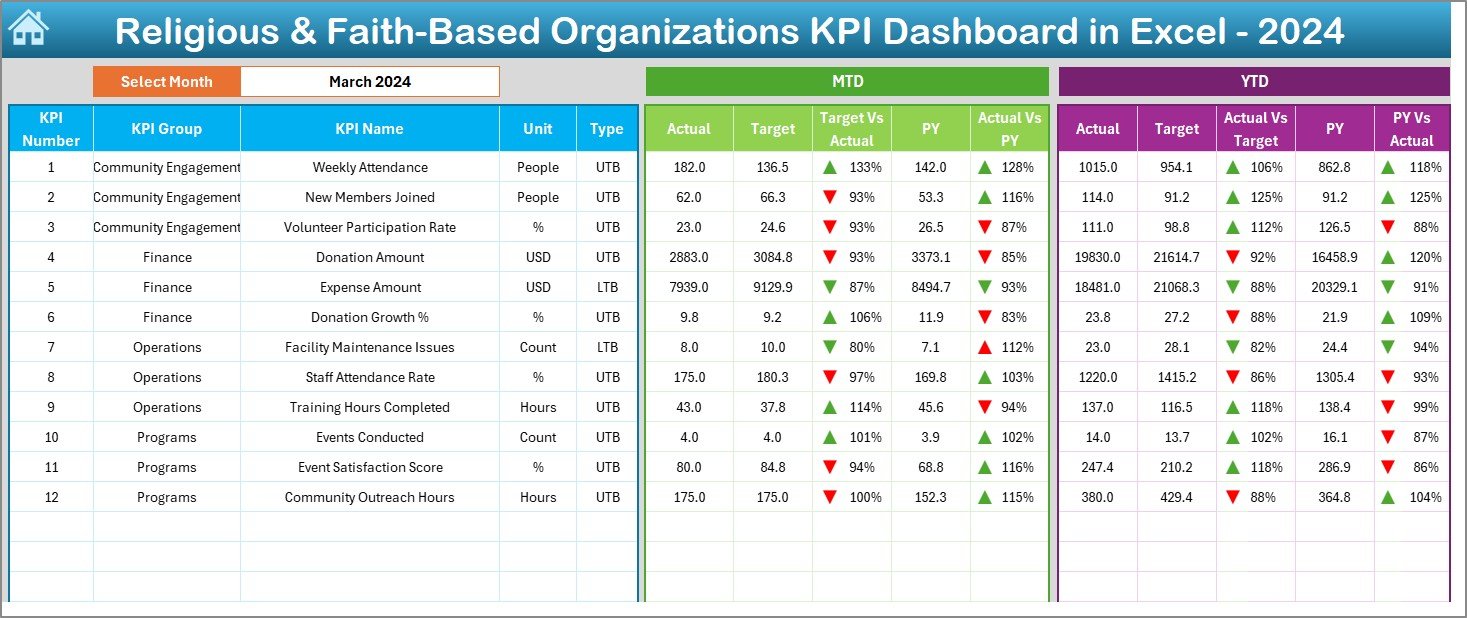
Dashboard Sheet – The Main Analytical Page
The Dashboard Sheet contains all the major KPI visuals and insights. It works as the core of the reporting system.
Key Highlights of the Dashboard Page
- A drop-down selector on Cell D3 allows you to choose the month.
- All values update instantly for that selected month.
- The dashboard shows MTD Actual, MTD Target, and MTD Previous Year numbers.
- It also displays YTD Actual, YTD Target, and YTD Previous Year numbers.
- Conditional formatting uses up & down arrows to show if performance rises or falls compared to targets and previous year values.
- You get both numeric values and visual indicators.
Because of this smart structure, leadership teams view progress quickly without reading long tables.
Click to buy Religious & Faith-Based Organizations KPI Dashboard in Excel
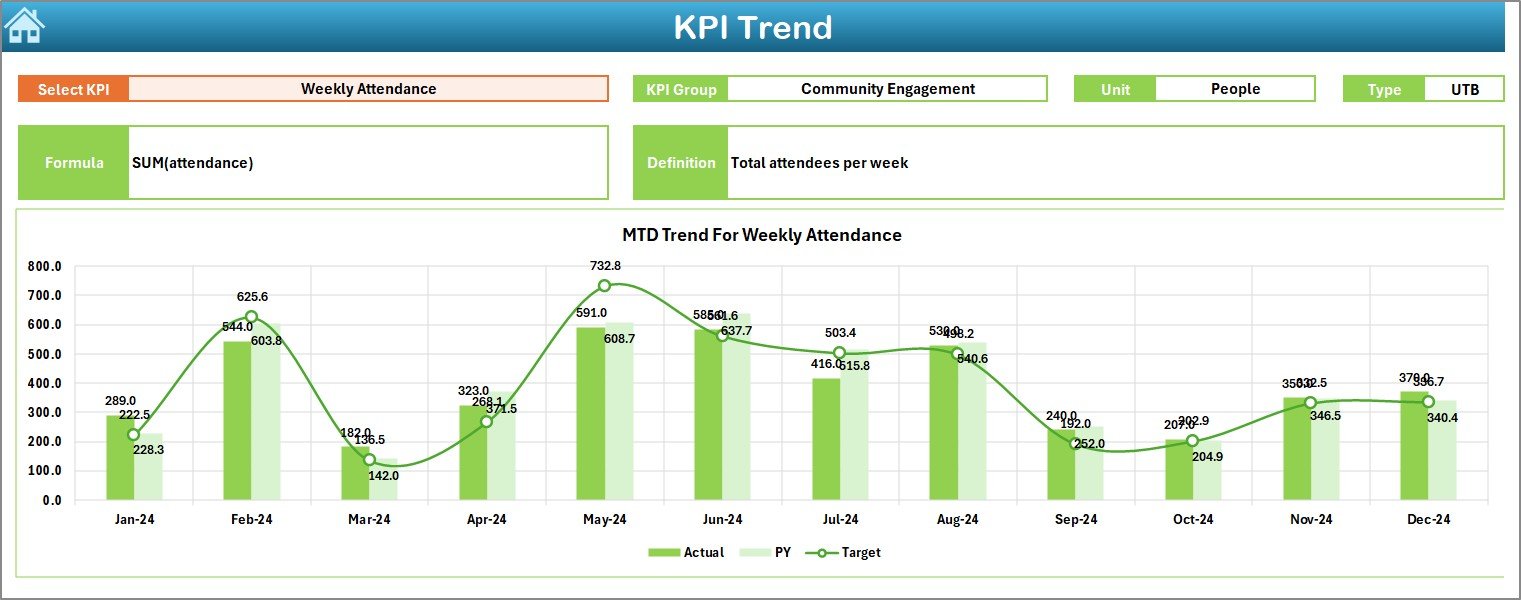
Trend Sheet – KPI-Level Insights for Each Metric
The Trend Sheet allows you to analyze each KPI individually.
What You Can Do on the Trend Page
- Select any KPI from a drop-down in Cell C3.
- View its KPI Group, Unit of measurement, KPI Type (UTB or LTB), Formula, and Definition.
- Analyze MTD and YTD trend charts.
- Compare Actual, Target, and Previous Year values visually.
This page helps leaders track long-term performance and understand how each KPI behaves throughout the year.
Click to buy Religious & Faith-Based Organizations KPI Dashboard in Excel
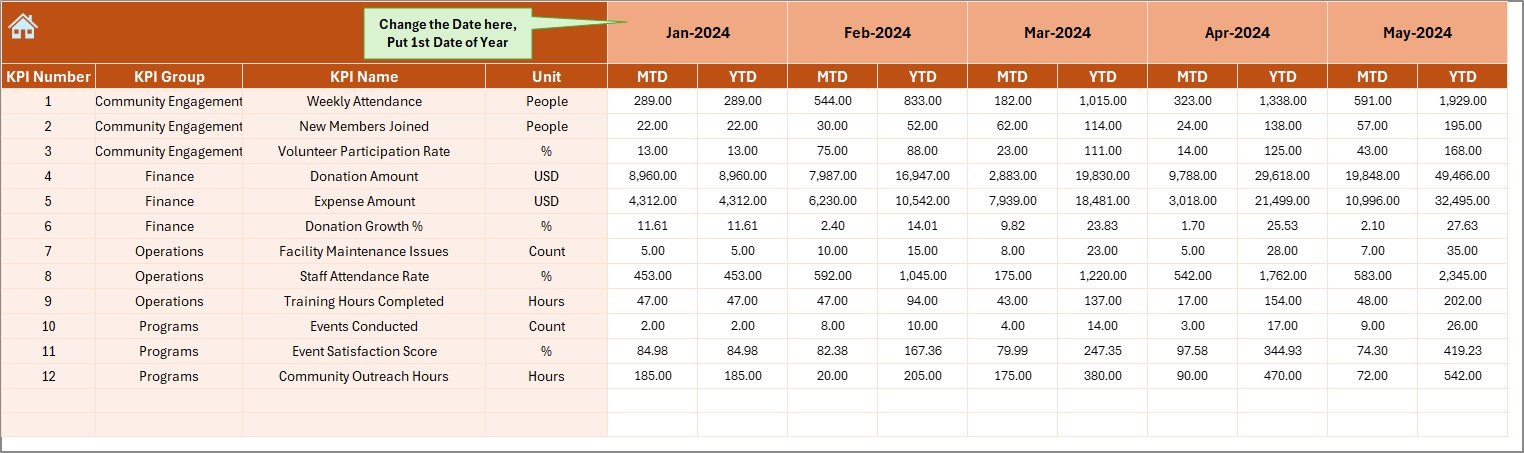
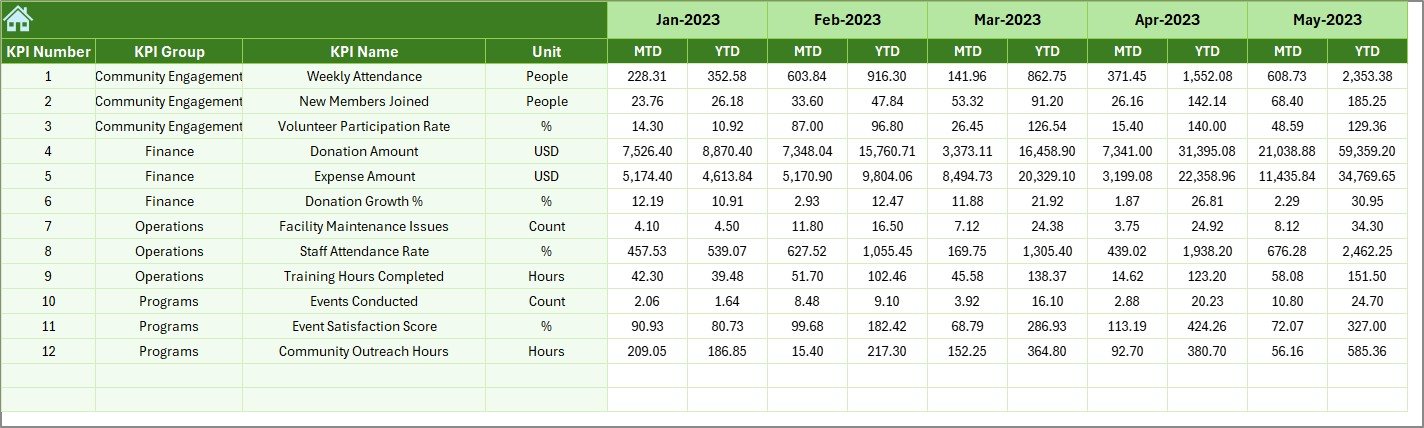
Actual Numbers Input Sheet – Enter Monthly Actual Data
This sheet is simple and user-friendly. You only need to enter your actual performance numbers for MTD and YTD.
How It Works
- Choose the starting month from Cell E1.
- Enter actual numbers month by month.
- The dashboard automatically picks this data.
This structure keeps the entire file flexible for any fiscal year.
Target Sheet – Enter Targets for Each KPI
In this sheet, you enter the monthly target values for each KPI.
You can enter:
- MTD Target
- YTD Target
Once you update these numbers, the dashboard automatically recalculates performance to show how close you are to achieving your goals.
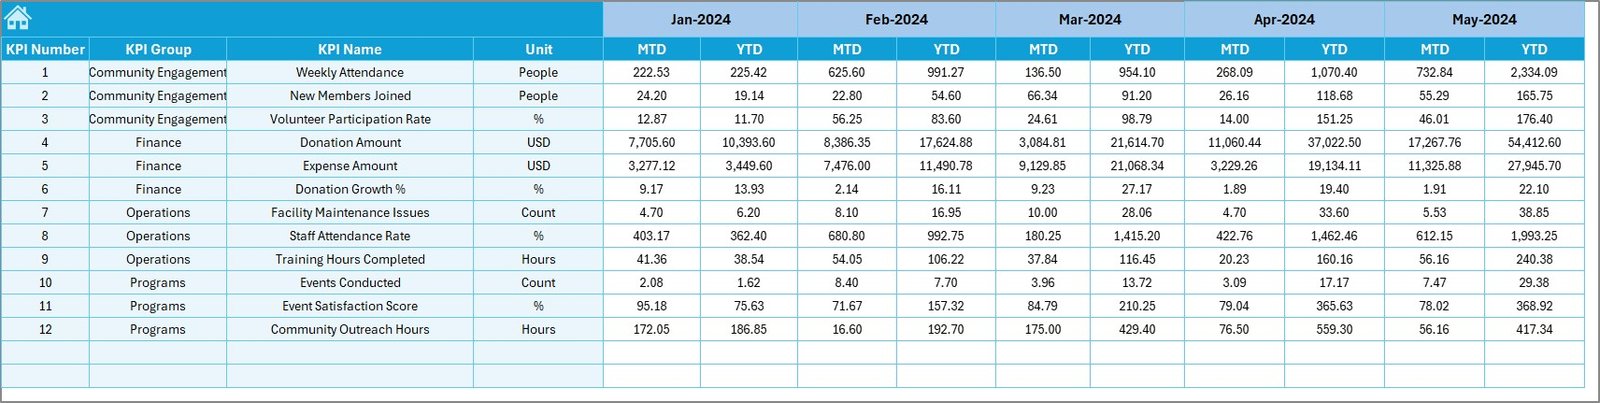
Previous Year Numbers Sheet – Enter Last Year’s Data
This sheet works exactly like the Actual Input sheet.
You enter:
- Previous Year MTD
- Previous Year YTD
This data helps you compare the current year’s performance with the last year’s results. Leaders understand if the organization grows, declines, or remains stable.
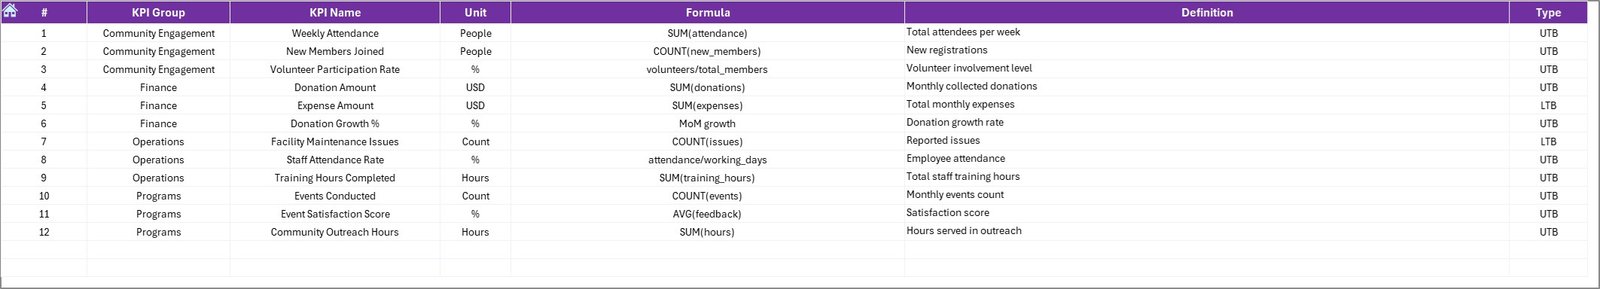
KPI Definition Sheet – Complete KPI Documentation
This sheet stores all KPI details in one place. It includes columns for:
- KPI Name
- KPI Group
- Unit
- Formula
- KPI Definition
This helps volunteers, analysts, and new staff understand each KPI clearly. It also keeps the dashboard transparent and easy to maintain.
What KPIs Should Faith-Based Organizations Track?
Every organization tracks different activities, but below are common KPI categories:
- Worship & Attendance
- Monthly service attendance
- New members registered
- Repeat attendance rate
- Donations & Financial Health
- Total donation amount
- Tithing and offerings
- Special event donations
- Year-over-year giving trend
- Volunteer Contribution
- Total volunteer hours
- Number of active volunteers
- Volunteer retention rate
- Outreach & Community Impact
- Number of community events
- People served
- Outreach growth rate
- Program Participation
- Educational program attendance
- Youth program participation
- Counseling sessions completed
Tracking these KPIs helps leaders make informed decisions with clarity and confidence.
Advantages of Religious & Faith-Based Organizations KPI Dashboard in Excel
- Better Decision-Making
Leaders understand performance instantly because the dashboard updates automatically.
- Clear Visibility of Growth
Organizations see monthly and yearly trends for donations, attendance, and outreach.
- Improved Volunteer Management
You can track volunteer participation and understand areas that need more support.
- Stronger Financial Planning
MTD and YTD donation insights help plan budgets for events, charity programs, and worship services.
- Time Savings for Staff and Volunteers
The dashboard automates reports that staff often prepare manually.
- Transparency for All Stakeholders
Committee members, donors, and volunteers understand organizational progress easily.
- Easy to Customize
You can add new KPIs, change layouts, or link additional sheets as your mission grows.
How Does This KPI Dashboard Support Faith-Based Growth?
Because the dashboard brings all important metrics into one place, leaders gain a deeper understanding of:
- What programs attract people
- Which activities need improvement
- How donations change throughout the year
- How volunteer contribution grows or declines
- Which months show higher participation
This clarity helps organizations plan programs that support the spiritual, emotional, and community needs of their members.
Best Practices for the Religious & Faith-Based Organizations KPI Dashboard in Excel
- Update Data Every Month
Timely updates keep the dashboard accurate and useful.
- Use Clear KPI Names
Avoid confusing titles. Use simple and meaningful names like “Monthly Attendance.”
- Review Trends Regularly
Monthly and yearly trends help you act early when performance drops.
- Train Volunteers to Enter Data Correctly
This ensures error-free inputs and smooth reporting.
- Set Realistic Targets
Targets should match ground realities so planning feels practical.
- Keep KPI Definitions Updated
Add new KPIs or adjust formulas as programs change.
- Back Up the Dashboard File
Maintain at least two backups for safety.
- Use Color Coding Wisely
Color indicators highlight achievements and challenges instantly.
Conclusion
A Religious & Faith-Based Organizations KPI Dashboard in Excel offers a powerful and simple solution for performance tracking. It helps leaders monitor attendance, donations, outreach programs, volunteer contributions, and community support in one structured view. As a result, organizations grow with clarity, unity, and confidence.
With this dashboard, faith-based teams make informed decisions, plan meaningful programs, and strengthen their mission to serve people and communities more effectively.
Frequently Asked Questions
- What is a Religious & Faith-Based Organizations KPI Dashboard in Excel?
It is a ready-to-use Excel tool that tracks KPIs like attendance, donations, volunteer hours, and outreach performance using charts and interactive visuals.
- Who can use this dashboard?
Spiritual centers, churches, temples, mosques, nonprofits, faith groups, and community organizations can use it.
- Does the dashboard update automatically?
Yes. Once you enter numbers in the Actual, Target, and Previous Year sheets, all charts update automatically.
- Can I customize the KPIs?
Yes. You can add, change, or remove KPIs easily in the KPI Definition sheet.
- Why is trend analysis important?
Trends show whether performance improves or declines over months or years. Leaders gain clarity about long-term growth.
- Do I need advanced Excel skills to use it?
No. You only need basic Excel knowledge. The dashboard design is simple and user-friendly.
- Can the dashboard help with fundraising strategies?
Yes. Donation trends help leaders plan campaigns, events, and community outreach more effectively.
- How often should I update the dashboard?
Update it every month for accurate reporting and smarter decision-making.
Visit our YouTube channel to learn step-by-step video tutorials
Watch the step-by-step video tutorial:
Click to buy Religious & Faith-Based Organizations KPI Dashboard in Excel