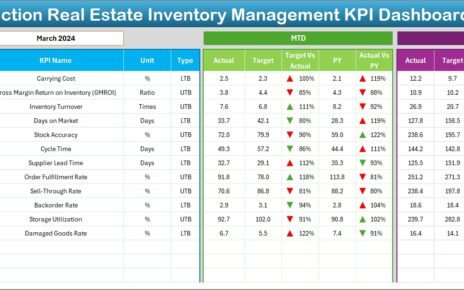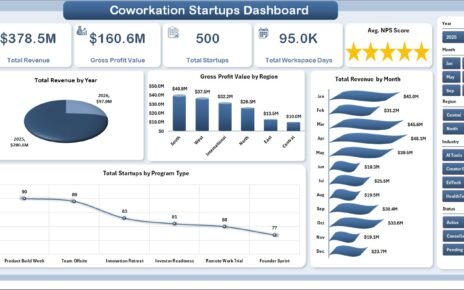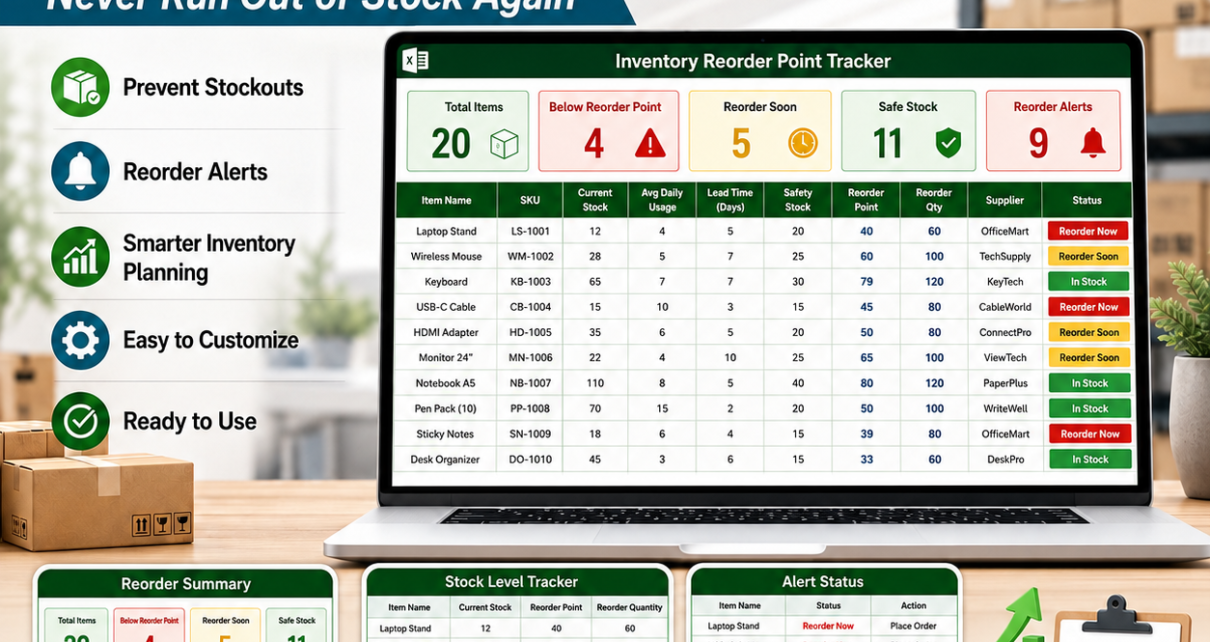
Reorder Point Formula in Excel setup is the simplest way to know when to buy stock before the shelf goes empty. The core formula is Reorder Point = (Average Daily Usage x Lead Time) + Safety Stock. For US retailers, warehouses, and small manufacturers, that formula is not just a math exercise. It is a practical guardrail against lost sales, emergency purchasing, and messy inventory audits.Reorder Point Formula in Excel
A cloud inventory platform can be useful, but even a modest SaaS plan can start at about $29 per organization per month when billed annually. A $17.99 one-time Excel template is already easier to justify for a small team; the three live NextGenTemplates inventory audit checklists featured in this post are currently even lower at $1.99 each, based on WooCommerce product data pulled before drafting. This tutorial covers three specific Excel templates you can pair with your reorder point model: documentation, review, and monitoring checklists.
Quick answer: In Excel, calculate reorder point with =(AvgDailyUsage*LeadTimeDays)+SafetyStock. Example: if you use 18 units per day, supplier lead time is 7 days, and safety stock is 45 units, reorder point is =(18*7)+45, or 171 units. When on-hand inventory reaches 171, create the purchase order.
Why Reorder Point Excel Matters
Reorder points matter because inventory problems usually show up late. A product does not become risky when it reaches zero; it becomes risky when current stock is no longer enough to cover lead-time demand, supplier delays, and audit uncertainty. Excel helps smaller teams make that threshold visible before a buyer, warehouse lead, or store manager has to react under pressure.
- Stockouts are expensive: NetSuite notes that in the US retail food industry alone, stockouts are estimated at $15 billion to $20 billion per year in lost sales, or up to 3% of total industry sales.
- Shrink is a real balance-sheet issue: The National Retail Federation reported an average shrink rate of 1.6% of sales in FY 2022, representing $112.1 billion.Reorder Point Formula in Excel
- Inventory distortion is broader than theft: Sensormatic’s IHL-backed inventory distortion study estimated $1.77 trillion in worldwide retail inventory distortion in 2023, covering overstocks and out-of-stocks.Reorder Point Formula in Excel
- SaaS cost scales quickly: Zoho Inventory lists paid annual-billing plans from $29 to $249 per organization per month, with higher tiers adding users, locations, bins, stock counting, and automation.
- Audit structure protects the formula: A reorder point number is only useful when counts, responsibilities, deadlines, and evidence are controlled. That is where the audit checklists below fit into the workflow.
The formula gives you a trigger. The checklist gives you confidence that the stock record behind the trigger is clean enough to trust.
Compare Inventory Audit Templates
If your main goal is inventory reorder control, you do not need every checklist at once. Start with the template that matches your weakest process: missing documentation, unclear audit review, or poor day-to-day monitoring.
| Template | Format | Best For | Price |
|---|---|---|---|
| Inventory Audit Documentation Checklist in Excel | Excel checklist | Teams that need evidence, files, owners, deadlines, remarks, and audit-readiness tracking | $1.99 |
| Inventory Audit Review Checklist in Excel | Excel checklist | Managers reviewing audit completion, unresolved findings, task ownership, and closeout status | $1.99 |
| Inventory Audit Monitoring Checklist in Excel | Excel checklist | Daily or weekly audit tracking with status indicators, progress bar, and responsible-person dropdowns | $1.99 |
Mid-post CTA: If your reorder point spreadsheet keeps flagging low-stock items but the audit process is still scattered, start with the documentation checklist and add the review or monitoring checklist as the process matures.
Get the Inventory Audit Documentation Checklist in Excel
Reorder Point Formula in Excel
The reorder point formula answers one operating question: At what stock level should we reorder so inventory arrives before we run out? The standard version is simple enough for Excel and strong enough for many small and mid-sized inventory workflows.Reorder Point Formula in Excel
Formula:
Reorder Point = (Average Daily Usage x Lead Time in Days) + Safety Stock
In Excel, assume average daily usage is in cell B2, lead time in days is in C2, and safety stock is in D2. Your reorder point formula is:
=(B2*C2)+D2
For a cleaner inventory worksheet, use these columns:
| Column | Field | Example | Excel Logic |
|---|---|---|---|
| A | SKU | SKU-1048 | Unique product identifier |
| B | Average Daily Usage | 18 | Units used or sold per day |
| C | Lead Time Days | 7 | Days between order and available stock |
| D | Safety Stock | 45 | Buffer for demand spikes or supplier delay |
| E | Reorder Point | 171 | =(B2*C2)+D2 |
| F | Current Stock | 160 | Latest counted or system quantity |
| G | Reorder Flag | Reorder | =IF(F2<=E2,"Reorder","OK") |
That last column is where the formula becomes operational. You are no longer asking someone to remember reorder thresholds. Excel tells the team which SKUs need action.
Step 1: Calculate Average Daily Usage
Average daily usage is the average quantity sold, consumed, issued, or used per day. If you sold 1,800 units over 90 days, the formula is:
=1800/90
That gives you 20 units per day. In a live workbook, you can calculate this from a transaction table. For example, if total quantity issued is in SalesQty and the date range is 90 days, use =SUM(SalesQty)/90.
Step 2: Measure Supplier Lead Time
Lead time is the number of days between placing a purchase order and having the goods ready to use. Do not use the supplier’s best-case promise if your actual receiving history says otherwise. If the vendor says 5 days but recent purchase orders took 7, 9, and 8 days, use the real average or a conservative value.Reorder Point Formula in Excel
Step 3: Add Safety Stock
Safety stock is your buffer. It protects against demand spikes, receiving delays, shipping mistakes, damaged inventory, and count errors. A simple beginner formula is:
Safety Stock = (Maximum Daily Usage x Maximum Lead Time) - (Average Daily Usage x Average Lead Time)
Example: maximum daily usage is 30 units, maximum lead time is 10 days, average daily usage is 18 units, and average lead time is 7 days. Safety stock is =(30*10)-(18*7), or 174 units. This may be too high for slow-moving items, so review carrying cost, shelf life, supplier reliability, and service level before applying one rule to every SKU.
Step 4: Use Conditional Formatting
Once the reorder flag is working, apply conditional formatting to highlight rows where the current stock is at or below reorder point. Use a rule like =$F2<=$E2 and apply it across the row. This turns a plain stock sheet into a reorder dashboard.
For broader inventory workflows, cross-link the reorder worksheet with the Inventory Management Dashboard in Excel, the Inventory Management Template for Multiple Locations, and the deeper Inventory Management in Excel guide. If your managers need printable low-stock reporting, also review the Product Inventory Report in Excel.
Templates That Support the Process
A reorder point model depends on trusted inputs. If stock counts are late, audit findings are undocumented, or ownership is unclear, the formula can look precise while the process behind it is weak. These three Excel checklists support the controls around reorder point decisions.
Inventory Audit Documentation Checklist in Excel
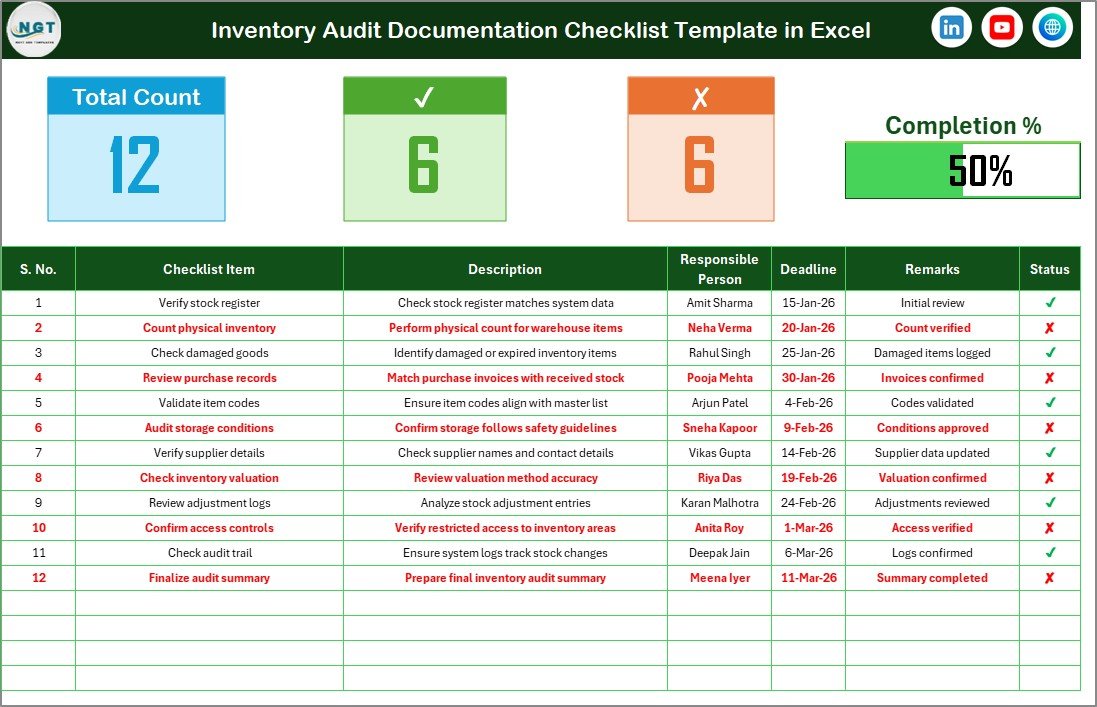
The Inventory Audit Documentation Checklist in Excel is best when your team struggles to prove what happened during an inventory audit. A reorder point calculation often triggers purchasing decisions, but purchasing teams also need clean supporting records: who checked the SKU, when it was checked, what evidence was reviewed, and whether any remarks or exceptions remain open.
Screenshot section: what is inside? The screenshot shows a structured checklist sheet with a top summary area, total checklist items, completed and pending counts, progress visualization, responsible-person assignments, deadlines, remarks, and status indicators. A supporting List sheet manages dropdown values so names stay consistent.
Use cases: use this template before external audits, during year-end stock verification, when reconciling system stock to physical count, or when documenting the evidence behind reorder point changes. It is also useful when finance wants proof that stock adjustments were reviewed before new purchasing decisions were approved.
Price: $1.99 sale price, based on the live WooCommerce product lookup.
Download the Inventory Audit Documentation Checklist in Excel
Inventory Audit Review Checklist in Excel
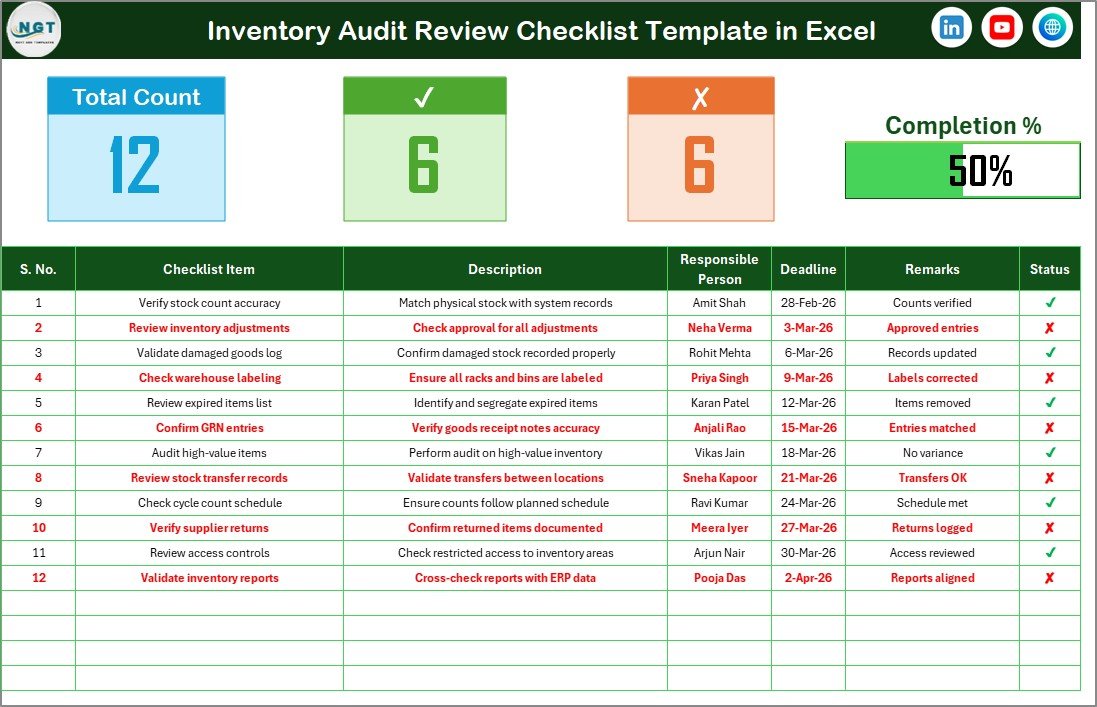
The Inventory Audit Review Checklist in Excel is designed for the manager or audit lead who needs to review progress, identify unresolved items, and close the loop. Reorder point management is not only about placing orders. It is also about reviewing whether minimum levels, stock adjustments, and audit findings are reasonable before the next buying cycle begins.
Screenshot section: what is inside? The template includes two worksheets: the main Inventory Audit Review Checklist sheet and a List sheet. The checklist has fields for serial number, checklist item, description, responsible person, deadline, remarks, and status. The summary dashboard tracks completion so the review process does not disappear into rows of unchecked tasks.
Use cases: use it for monthly inventory review meetings, audit closeout, supplier-delay reviews, reorder-level exception checks, and post-count approvals. It works especially well when finance, warehouse, and purchasing teams all need one shared view of what is completed and what still needs attention.Reorder Point Formula in Excel
Price: $1.99 sale price, based on the live WooCommerce product lookup.
Download the Inventory Audit Review Checklist in Excel
Inventory Audit Monitoring Checklist in Excel
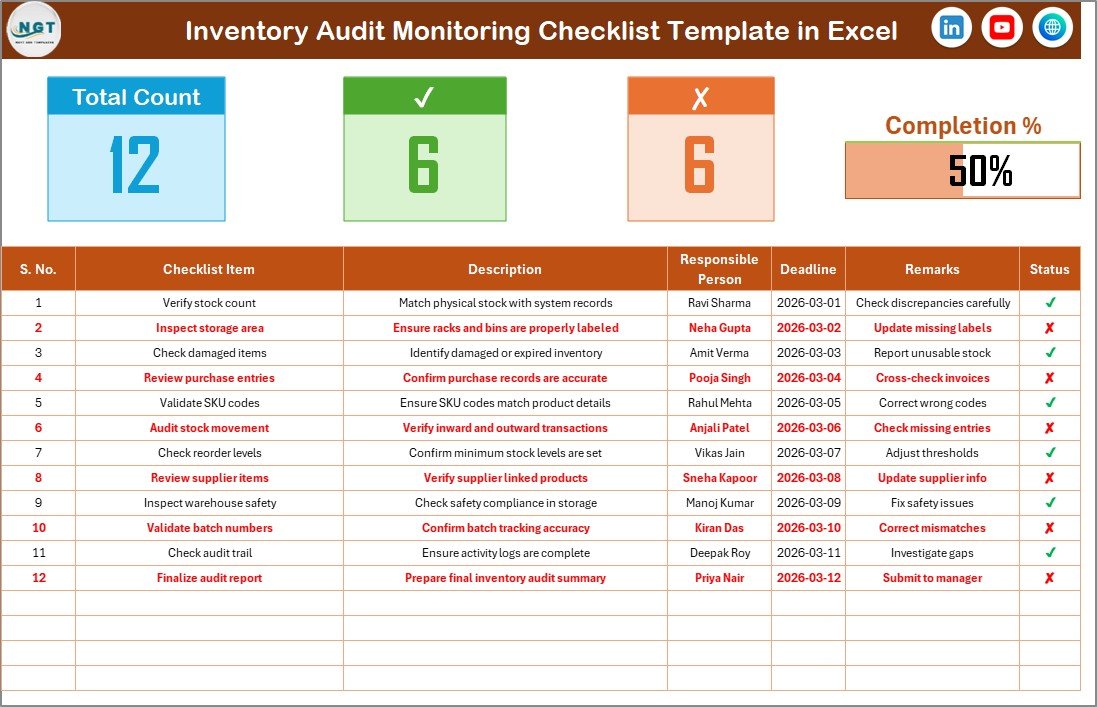
The Inventory Audit Monitoring Checklist in Excel is the best fit when you need ongoing visibility. If reorder alerts are being ignored, audits keep slipping, or low-stock items are not being reviewed on schedule, a monitoring checklist gives the team a simple operating rhythm.
Screenshot section: what is inside? The screenshot highlights a main checklist sheet with an audit summary dashboard, total checklist count, completed and pending task tracking, progress bar, responsible person field, deadline, remarks, and status. The List sheet supports standardized responsible-person dropdowns.
Use cases: use it for weekly stock-control check-ins, cycle count monitoring, warehouse supervisor follow-ups, reorder exception tracking, and compliance routines where missed tasks lead to late purchase orders. It is especially useful for teams that already know the reorder point formula but need better discipline around checking the numbers.
Price: $1.99 sale price, based on the live WooCommerce product lookup.
Download the Inventory Audit Monitoring Checklist in Excel
For a broader stack, compare these with the Inventory Audit Planner Checklist in Excel, Inventory Audit Tracking Checklist in Excel, Inventory Audit To-Do List Checklist in Excel, and the more automated Inventory Management System -V3.0.
How to Choose Between These Templates
Choose the template based on the process problem you are trying to fix, not only the title. The reorder point formula may sit in one workbook, but inventory control usually depends on several supporting behaviors: count accuracy, evidence, review cadence, and task follow-through.
- Choose Documentation if the biggest risk is missing proof: count sheets, notes, owners, deadlines, evidence, and remarks.
- Choose Review if the audit is mostly done but managers need to review completion status, unresolved issues, and closeout tasks.
- Choose Monitoring if the process is active every week and someone needs to watch pending tasks, progress, and responsibilities.
- Choose Planner or Tracking if you are still building the audit routine before documentation, review, or monitoring becomes mature.
- Choose Inventory Management System -V3.0 if you need VBA forms, automatic stock movement, reorder alerts, and reports instead of checklist-only control.
A practical workflow is to calculate reorder point in your stock tracker, use conditional formatting to flag SKUs at or below the threshold, then run a monitoring checklist for recurring review. When a variance appears, use documentation and review checklists to record the evidence and close the issue.
Closing CTA: Build the reorder point formula first, then protect it with a simple audit workflow. Start with the checklist that matches your bottleneck.
Frequently Asked Questions
What is the reorder point formula in Excel?
The reorder point formula in Excel is =(AverageDailyUsage*LeadTimeDays)+SafetyStock. It tells you the stock level where a new purchase order should be triggered so replenishment arrives before inventory runs out.
How do I calculate safety stock in Excel?
A simple safety stock formula is =(MaximumDailyUsage*MaximumLeadTime)-(AverageDailyUsage*AverageLeadTime). This estimates the buffer needed for demand spikes or supplier delays. For high-value or seasonal products, review the result manually before applying it.
What is average daily usage?
Average daily usage is the average number of units sold, issued, or consumed per day. In Excel, divide total units used during a period by the number of days in that period. Example: 900 units over 60 days equals 15 units per day.
What is lead time in inventory reorder planning?
Lead time is the number of days between placing an order and having stock available to sell or use. Use actual supplier history when possible, not only the promised delivery time, because reorder points depend on realistic timing.
Can Excel prevent stockouts?
Excel can help prevent stockouts when the workbook is structured well, updated consistently, and reviewed on schedule. The reorder point formula flags low-stock items, while audit checklists help make sure counts and responsibilities stay accurate.
What is the difference between reorder point and safety stock?
Safety stock is the extra buffer you hold to cover uncertainty. Reorder point is the trigger level that combines expected lead-time usage plus safety stock. In short, safety stock is one input; reorder point is the action threshold.
Which inventory audit checklist should I use first?
Start with the Documentation Checklist if your records are incomplete. Choose the Review Checklist if your issue is audit closeout. Choose the Monitoring Checklist if your team needs weekly visibility into pending inventory audit tasks.
Should I use an Excel template or inventory SaaS?
Use Excel when you need a low-cost, editable workflow for lightweight stock control, audits, and reorder checks. Use SaaS or ERP when you need live multi-user permissions, barcode scanners, API integrations, accounting sync, or high-volume multi-location automation.
How often should reorder points be reviewed?
Review reorder points monthly for active SKUs and immediately after major changes in demand, supplier lead time, seasonality, pricing, or warehouse process. Slow-moving SKUs may only need quarterly review if usage is stable.
Can I use these templates with an existing inventory dashboard?
Yes. These checklists can sit beside an existing Excel dashboard or stock tracker. Use the dashboard for numbers and alerts, then use the checklist to assign actions, track audit status, document findings, and close the loop.
About the author: Built by PK – Microsoft Certified Professional with 15+ years of Excel, Google Sheets, and Power BI experience. Founder of NextGenTemplates, reaching 300K+ subscribers across YouTube channels. Every template is hand-built and tested before release.
For step-by-step template walkthroughs and dashboard tutorials, visit the NextGenTemplates YouTube channel.
Final takeaway: Reorder point Excel formulas help you avoid stockouts, but the formula is only as strong as the stock records behind it. Calculate the threshold, flag low-stock items, and use the right audit checklist to keep ownership, evidence, and review discipline in place. Review it monthly.