Running a warehouse, retail chain, or e-commerce operation means living inside inventory data — reorder points, vendor lead times, dead-stock piling up on shelves, and inventory value spread across locations you don’t always visit. Most small-to-mid teams live with scattered spreadsheets or a $59–$999/user/month ERP subscription that their CFO keeps threatening to cut. The Product Inventory Report in Excel is the middle path: a 4-sheet, pivot-driven monthly report that tracks 5 KPIs and 5 charts on a single Summary Page, built to be opened, refreshed, and emailed in under 10 minutes.
In this post I’ll walk through every page of the report, the six inventory questions it answers, how it compares to Zoho Inventory and NetSuite ERP, and the workflow small operations use to replace a $3,000+/year SaaS bill with a $7.99 one-time purchase. According to the Microsoft PivotTable documentation, the Refresh All pattern used here is the official approach for Excel dashboards built on structured data.
👉 Click here to Purchase the Product Inventory Report in Excel
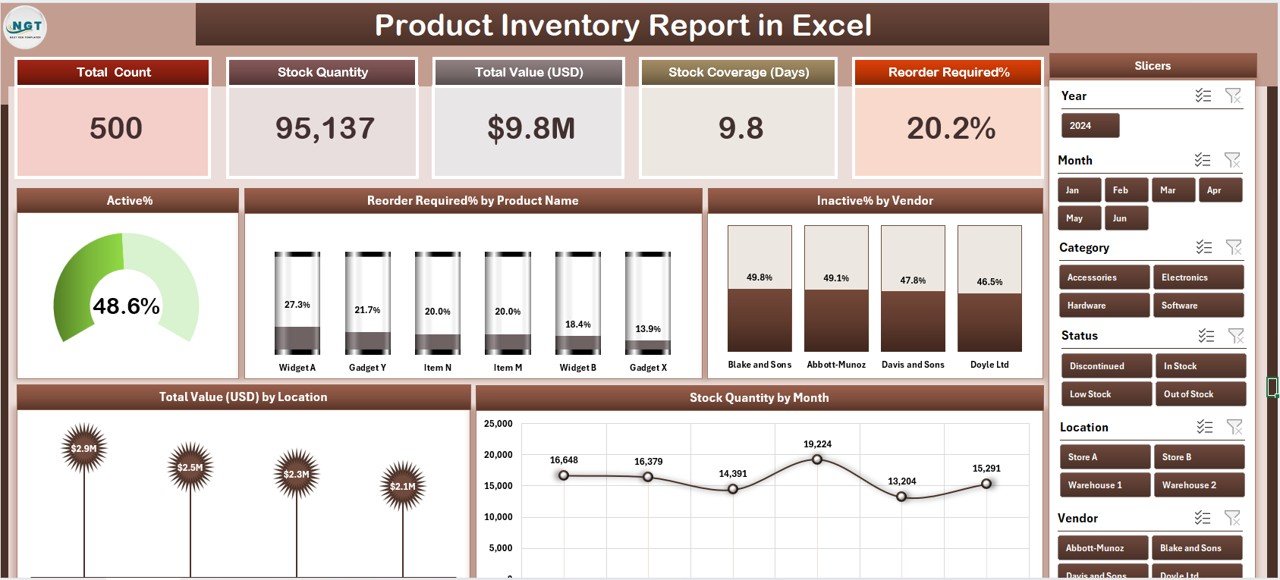
Product Inventory Report in Excel – Summary Page
Key Features of the Product Inventory Report in Excel
The Product Inventory Report in Excel tracks 5 headline KPIs on the Summary Page — shown as card visuals — alongside 5 interactive charts covering Active %, Reorder Required % by Product Name, Inactive % by Vendor, Total Value by Location, and Stock Quality by Month. Every visual is driven by a pivot table on a hidden Support sheet, so updating the raw Data sheet and clicking Refresh All propagates changes across every chart. No formulas to rewrite, no broken references, no macros.
The workbook is fully unprotected. You can rebrand chart colours, add your own KPIs, insert new slicers, or add new columns to the Data sheet and extend the dashboard. It runs 100% offline in Microsoft Excel 2016, 2019, 2021, and Microsoft 365 on Windows and Mac — no internet connection, no add-ins, and no per-user fees ever.
The three features that matter most day-to-day for inventory teams:
Five-KPI Summary Page with right-side slicer panel. Five card visuals display headline metrics at a glance for a weekly or monthly operations meeting. The slicer panel on the right lets you filter the entire page by vendor, location, product category, or month in one click — so a 50-vendor catalogue becomes a 3-vendor view whenever you need to drill in.
Reorder Required % by Product Name. This chart is the weapon procurement teams use to cut their weekly PO list from guesswork to 15–40 real action items. Products are ranked by the share of units currently below reorder point, so the fastest-movers never hit zero and the slow-movers don’t get over-ordered.
Inactive % by Vendor. The second-most-valuable chart in the file. It exposes which suppliers are quietly filling your shelves with dead stock — a 40%-inactive vendor is a renegotiation conversation, not a line-item on next month’s PO.
Dashboard Pages Explanation
1. Summary Page
The main dashboard view. Five KPI cards sit at the top giving inventory managers an at-a-glance snapshot of stock health. Below them, 5 interactive charts cover the core analytical questions that come up in every month-end review — Active %, Reorder Required % by Product Name, Inactive % by Vendor, Total Value by Location, and Stock Quality by Month. On the right edge, a vertical slicer panel filters by vendor, location, product category, and month, and the same filter applies to all cards and charts simultaneously.
Summary Page with 5 KPI cards, 5 charts and slicer
2. Report Page
A separate worksheet with a left-side slicer and a detailed SKU-level information table. Think of this as the audit-trail view — useful when your auditor asks for every product currently flagged as inactive at a specific warehouse, or when your finance team needs a line-item breakdown for month-end inventory valuation entries. Filter with the slicer, copy the visible rows, paste into an email or a physical cycle-count checklist.
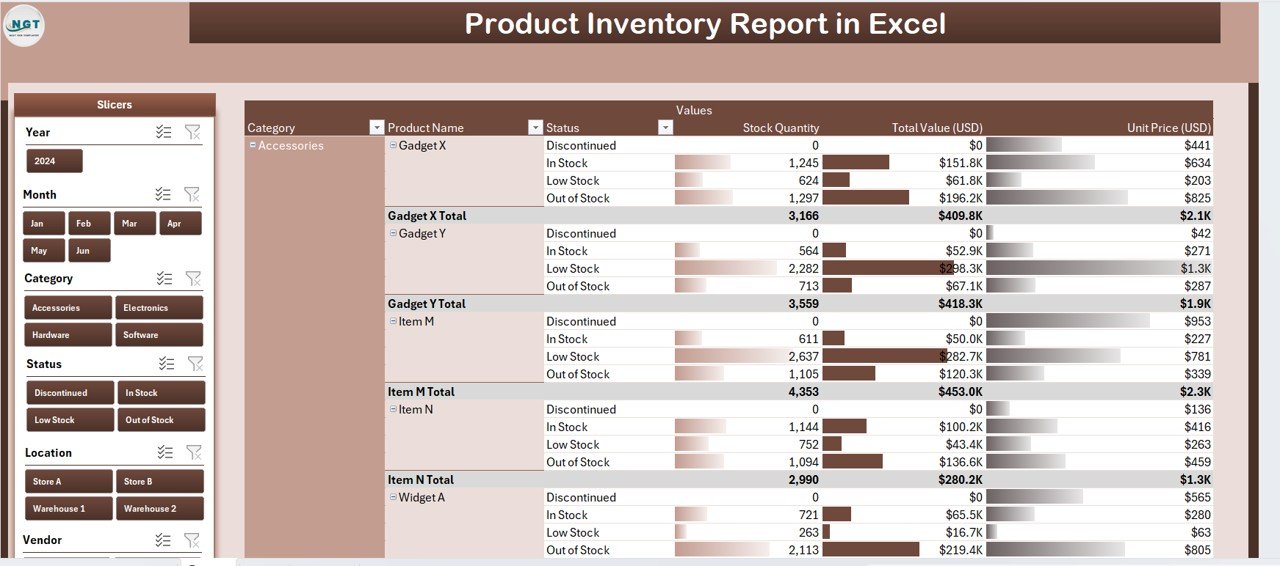
Report Page – slicer-driven SKU information table
3. Data Sheet
The raw input sheet. Replace the sample rows with your own SKU-level data — Product Name, Vendor, Location, Category, Active/Inactive Status, Reorder Point, Current Stock, Unit Value, Total Value, Stock Quality, Date. Keep the column headers identical because the pivot tables on the Support sheet reference them directly.
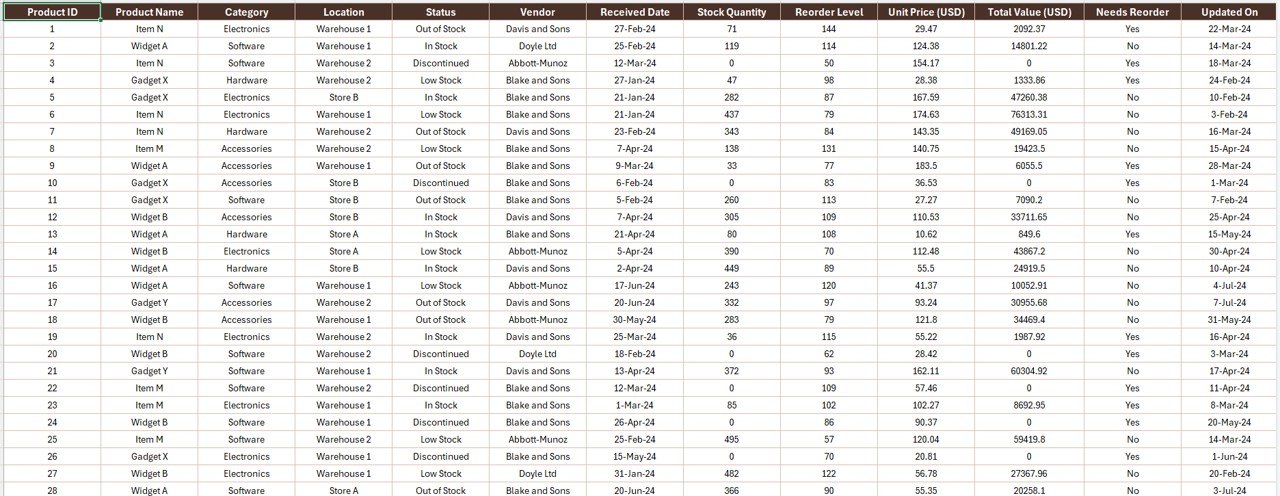
Data Sheet – paste your SKU-level rows here
4. Support Sheet
Holds every pivot table that feeds the Summary Page. After updating the Data sheet, go to the Data tab in the Excel ribbon and click Refresh All — every pivot recalculates and every chart on the Summary Page rebuilds. You can hide this sheet in production so operations staff only interact with the Summary Page and Report Page.
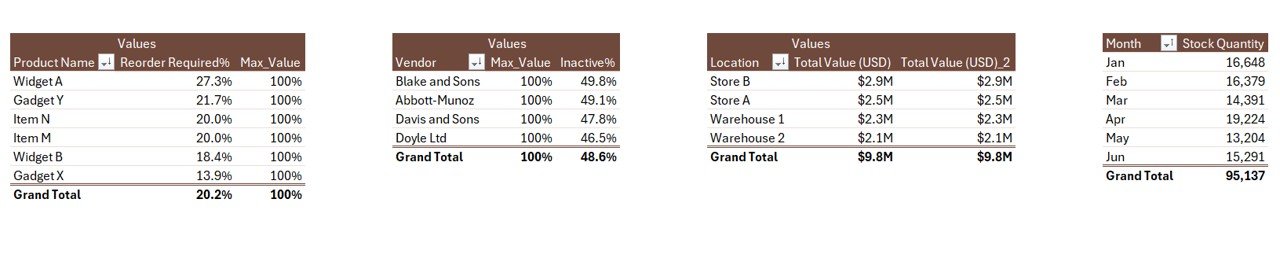
Support Sheet with pivot tables driving every chart
Product Inventory Report in Excel vs. Google Sheets Equivalent vs. Zoho Inventory / NetSuite ERP — Feature Comparison
| Feature | Product Inventory Report in Excel | Google Sheets equivalent | Zoho Inventory / NetSuite ERP |
|---|---|---|---|
| Cost | $7.99 one-time | ~$10 one-time template | $59–$999 / user / month |
| Platform | Microsoft Excel (offline) | Google Sheets (browser) | Cloud SaaS, vendor-hosted |
| Setup time | Under 10 minutes | ~15 minutes | 2–6 weeks onboarding |
| Works offline | ✅ Yes | ❌ Internet required | ❌ Internet required |
| Per-user fees | ✅ None | None | $59+ per user / month |
| Customizable KPIs & charts | ✅ Fully editable | ✅ Editable | ❌ Fixed reports |
| Data stays on your device | ✅ Yes | ❌ Google cloud | ❌ Vendor cloud |
| Year-1 cost at 5 users | $7.99 | ~$10 | $3,540 – $59,940 |
| Reorder + dead-stock visibility | ✅ Pre-built | Needs rebuild | ✅ Pre-built |
For warehouse, retail, and e-commerce teams that want reorder, vendor, and location-level inventory visibility without committing to a five-figure annual ERP bill, the Product Inventory Report in Excel sits in the sweet spot.
Who Should Use This Template
Perfect for:
- Small and mid-size warehouse operators (1–20 locations) who need a monthly inventory health report
- Retail owners tracking stock across 2–50 SKUs per product line and 1–15 store locations
- Procurement and sourcing managers reviewing vendor performance against reorder and dead-stock metrics
- E-commerce sellers (Shopify, Amazon, Etsy) with 100–5,000 SKUs who haven’t moved to a paid inventory platform yet
- Operations leaders preparing month-end inventory reports for owners, investors, or bank facility reviews
Not a fit if:
- You run enterprise operations with 50,000+ SKUs across 100+ locations needing SOC 2 and SSO (use NetSuite, SAP, or Oracle NetSuite)
- You need real-time barcode scanning, automated PO creation, or integrated 3PL shipping (use Zoho Inventory or Cin7)
- Your team lives entirely in Google Sheets — in that case, browse the Google Sheets Dashboard collection
Real-World Use Cases
👉 Click here to Purchase the Product Inventory Report in Excel
Rahul runs a mid-size electronics distributor in Delhi with 12,000 SKUs across 3 warehouses. Every Monday he opens the report, checks the Reorder Required % by Product Name chart, and cuts his weekly PO list to the 40 fastest-moving SKUs that genuinely need restocking. The Inactive % by Vendor chart helped him spot that two suppliers were responsible for roughly ₹18–22 lakh of dead stock sitting in his warehouses — enough leverage to renegotiate terms and clear inventory he’d been carrying for 18 months.
Sarah manages inventory at a 5-store retail chain in Austin, Texas. She uses the Total Value by Location chart to balance stock across her downtown, suburban, and warehouse locations. After spotting her suburban store carrying 40% more inventory value than its sales justified, she redirected two months of incoming POs to clear it — freeing up around $28,000 in working capital without paying NetSuite’s $999/month plan. For broader operational metrics she also runs the Warehouse Efficiency Dashboard in Excel every quarter.
Marco is an operations analyst at a D2C home-goods brand with 800 SKUs across Shopify and Amazon. He needs month-end inventory reports for his CFO but can’t justify $59/user/month for Zoho Inventory with 6 seats. The Product Inventory Report gives him the Stock Quality by Month and Active % trend views he needs for quality-control reviews, runs entirely offline on his MacBook, and cost the business $7.99 once. He also uses the Procurement Management Dashboard in Power BI for deeper vendor-spend analysis.
Advantages of the Product Inventory Report in Excel
Zero recurring cost. $7.99 one-time payment covers unlimited users. Compare this to $3,540–$59,940 per year for cloud ERP platforms at 5 users — the template pays for itself the day you open it.
Full offline access. Works in Microsoft Excel without an internet connection. Ideal for warehouse floors and back-offices where connectivity is patchy, and essential when SKU-level cost and vendor margin data shouldn’t leave your device.
Pivot-table architecture. Every chart is wired to a pivot on the Support sheet. Add a new vendor, a new SKU category, or a whole new product line — click Refresh All once, and every pivot, card, and chart picks up the new values automatically. No chart-level editing, no broken formulas.
Completely unprotected workbook. Change colours, add KPI cards, insert new pivot fields, reorder slicers, or extend the data model with your own calculated columns. Everything is editable.
Opportunities for Improvement
Being honest, the Product Inventory Report in Excel is a report, not a full inventory-management system. It doesn’t handle barcode scanning, automated PO creation, multi-warehouse transfers, or integrated 3PL shipping. If you need those features in one integrated platform, you’ll want a dedicated SaaS tool like Zoho Inventory or Cin7 — and this template can still sit alongside that system as the executive reporting layer.
The template also assumes you already have inventory data in a clean, column-structured format. If your current system exports messy CSVs or multi-line records, you’ll spend extra minutes cleaning the data before pasting it in. For larger catalogues, we recommend automating the export from your WMS or e-commerce platform with a monthly scheduled query.
Finally, the template is refresh-based rather than real-time. If you want intra-day stock visibility, the Warehouse Efficiency Dashboard in Power BI with a scheduled refresh is the better fit.
Best Practices
Standardise your category names. Use the same spelling for vendors, locations, and product categories every month. “ACME Corp” and “Acme Corporation” will create two pivot rows and distort your Inactive % by Vendor chart.
Refresh before every review meeting. A two-second action (Data → Refresh All) prevents stale numbers from sneaking into a board deck or a bank-facility review.
Save a dated copy monthly. Name files like “Inventory_Report_2026_04.xlsx” so you can compare month-over-month trends without re-deriving them — critical for the Stock Quality by Month view to stay meaningful.
Hide the Support sheet before sharing. Right-click the Support tab → Hide. Operations and warehouse staff should only interact with the Summary Page and Report Page.
Pair with a broader operations dashboard. For teams that also want KPIs on fulfilment rate, pick time, and shipping cost, combine this report with the Warehouse Efficiency Dashboard in Excel.
Explore Relevant Templates
💎 Save 36% with the Inventory & Warehouse Master Kit — 8 premium Excel, Google Sheets, and VBA templates in one package, including this report.
Related templates worth exploring:
- Warehouse Efficiency Dashboard in Excel — fulfilment rate, pick time, shipping cost
- Procurement Management Dashboard in Excel — PO aging, vendor spend, category breakdown
- Vendor Performance Dashboard in HTML — browser-based vendor scorecard
- Trucking and Logistics Dashboard in Google Sheets — own-fleet logistics counterpart
Browse all Excel Dashboard Templates and the broader Excel Reports collection.
Frequently Asked Questions
What KPIs does the Product Inventory Report in Excel track?
The Product Inventory Report in Excel tracks 5 headline KPIs on the Summary Page shown as card visuals, plus 5 interactive charts covering Active %, Reorder Required % by Product Name, Inactive % by Vendor, Total Value by Location, and Stock Quality by Month. All metrics auto-update when you refresh the pivot tables after pasting new data.
How long does setup take?
Setup takes under 10 minutes. Download the .xlsx file, paste your SKU-level data into the Data sheet in the same column format, then click Data → Refresh All. Every card, chart, and slicer on the Summary Page of the Product Inventory Report in Excel updates automatically. No formulas to edit, no macros to enable.
How does this compare to Zoho Inventory or NetSuite ERP?
Zoho Inventory charges $59–$249 per user per month and NetSuite ERP starts around $999 per month — quickly reaching $36,000+ per year at 3 seats. The Product Inventory Report in Excel is a $7.99 one-time purchase with no per-user fees, works offline, and keeps SKU-level cost and vendor-margin data on your device. It replaces the monthly reporting workflow, not the full ERP.
Does this template work on Mac Excel?
Yes. The Product Inventory Report in Excel uses only pivot tables and slicers — no VBA, no macros — so it runs identically on Windows Excel and Mac Excel 2016 or later. No internet connection is required, which is useful in warehouse environments with patchy connectivity.
Can I add new vendors, locations, or product categories?
Yes. Add new vendors, locations, product categories, or SKUs directly to the Data sheet. After adding rows, click Data → Refresh All in the Excel ribbon and every pivot table on the Support sheet will pick up the new values. The Summary Page charts populate automatically with no further edits.
Is my inventory pricing data safe with this template?
Data stays entirely on your device. The Product Inventory Report in Excel doesn’t connect to any cloud service, API, or external database. SKU-level cost, vendor terms, and margin data never leave your machine — a critical advantage over cloud-based ERPs where third parties can access commercially sensitive data.
Can multiple team members use the same file?
Yes. Email the .xlsx file or share it via OneDrive, Dropbox, or SharePoint. There’s no per-user licence — procurement, warehouse, and finance staff can all open and filter the Product Inventory Report in Excel freely with any Microsoft Excel installation.
About the Author
Built by PK — Microsoft Certified Professional with 15+ years of Excel, Google Sheets, and Power BI experience. Founder of NextGenTemplates, reaching 300K+ subscribers across YouTube channels. Every template is hand-built and tested before release.
Conclusion
A warehouse, retail chain, or e-commerce operation lives or dies on three numbers: how much stock is actually moving, which vendors are filling shelves with dead product, and where inventory value is concentrated across locations. The Product Inventory Report in Excel brings all three into a single Summary Page, adds slicers to drill in, and gives you a pivot-table engine that keeps every visual in sync with a single Refresh All click. Whether you run 500 SKUs or 50,000, this template will save you hours of manual reporting every month and help you catch dead stock and under-performing vendors before they become real money lost.
👉 Click here to Purchase the Product Inventory Report in Excel
✅ Instant download · One-time payment · No subscription · Lifetime access
📅 Last updated: April 2026
🎥 For Excel video tutorials, visit YouTube.com/@PK-AnExcelExpert.