Procurement Management Dashboard in Power BI is a comprehensive, ready-to-use Power BI template designed for procurement professionals, supply chain managers, and operations teams who want to track procurement spending, evaluate supplier performance, monitor budget compliance, and analyze delivery efficiency from one centralized and interactive dashboard. This Power BI dashboard includes 5 interactive pages and tracks 5 key performance indicators including Total Budget, Budget Variance, Total Spend, Total Orders, and Avg Quality Score.
In today’s competitive business environment, procurement teams need instant access to actionable data. Manual reporting and disconnected spreadsheets make it difficult to identify overspending, supplier quality issues, or delivery delays in real time. The Procurement Management Dashboard in Power BI solves this challenge by consolidating all your procurement data into a professional analytics hub with dynamic charts, KPI cards, and interactive slicers that update automatically as you filter and explore your data.
Key Features of Procurement Management Dashboard in Power BI
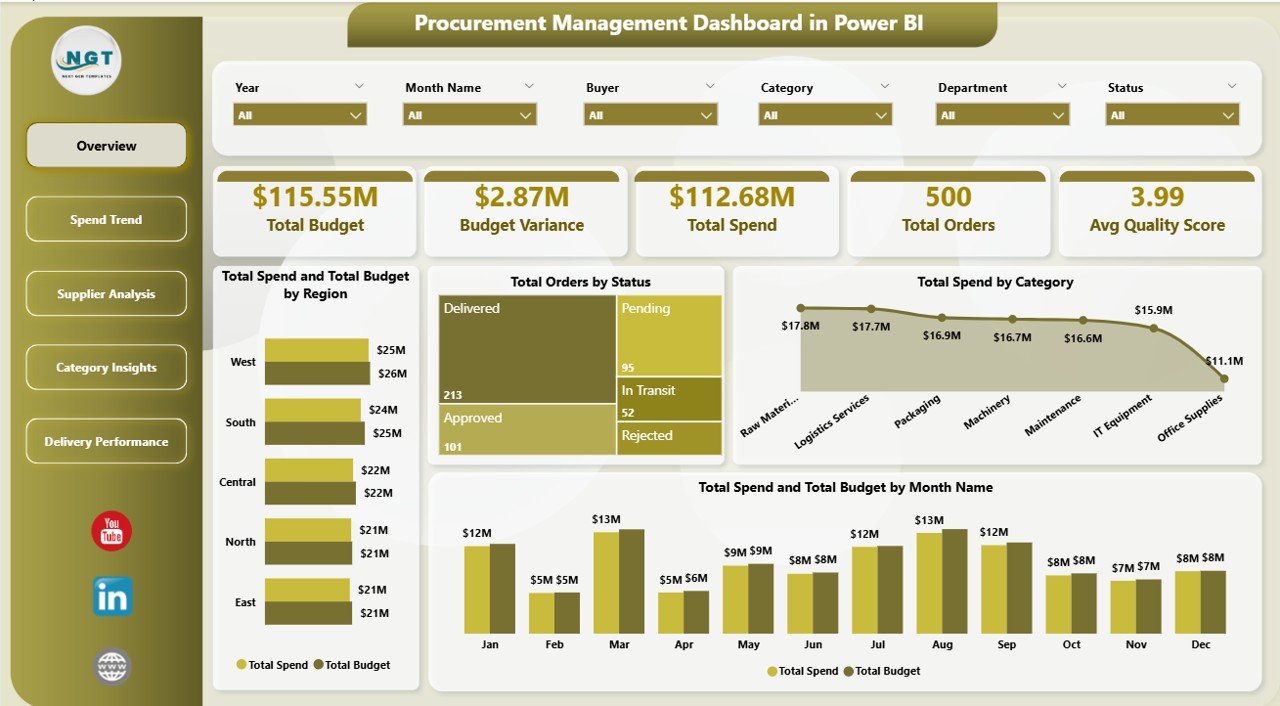
This Power BI dashboard delivers complete procurement visibility across 5 interactive pages with dynamic charts and slicers. The Overview page displays 5 KPI cards — Total Budget, Budget Variance, Total Spend, Total Orders, and Avg Quality Score — alongside 4 analytical charts covering spend vs budget by region, total orders by status, total spend by category, and monthly spend vs budget trends. Built-in slicers enable instant filtering across all pages, allowing managers to drill down into specific suppliers, categories, regions, or time periods within seconds.
The template uses Power BI’s native DAX measures and relationships that refresh dynamically when you connect your own data source. No complex setup is required — everything runs on standard Power BI visuals and measures. The Spend Trend page tracks spending patterns over time with year-over-year comparisons and cost-per-order analysis. The Supplier Analysis page evaluates vendor performance through budget category analysis, on-time delivery rates, and quality scores. The Category Insights page breaks down procurement metrics by product category, region, and department. The Delivery Performance page monitors lead times by buyer and spending by payment terms.
If you prefer tracking procurement data in Excel, check out the Procurement Management Dashboard in Excel which provides similar analytics using pivot tables and dynamic charts. For vendor-focused analytics, explore the Vendor Performance Dashboard in HTML or browse our complete collection of Power BI Dashboard Templates.
Click here to Purchase the Procurement Management Dashboard in Power BI
Dashboard Pages Explained
1. Overview Page
The Overview page serves as the executive summary of your procurement operations. It displays 5 KPI cards at the top — Total Budget, Budget Variance, Total Spend, Total Orders, and Avg Quality Score — providing an instant health check of your procurement function. Below the cards, four analytical charts present Total Spend and Total Budget by Region, Total Orders by Status, Total Spend by Category, and Total Spend and Total Budget by Month Name. Multiple slicers are available to filter data by region, category, supplier, and time period for targeted analysis.
Procurement Management Dashboard in Power BI2. Spend Trend Page
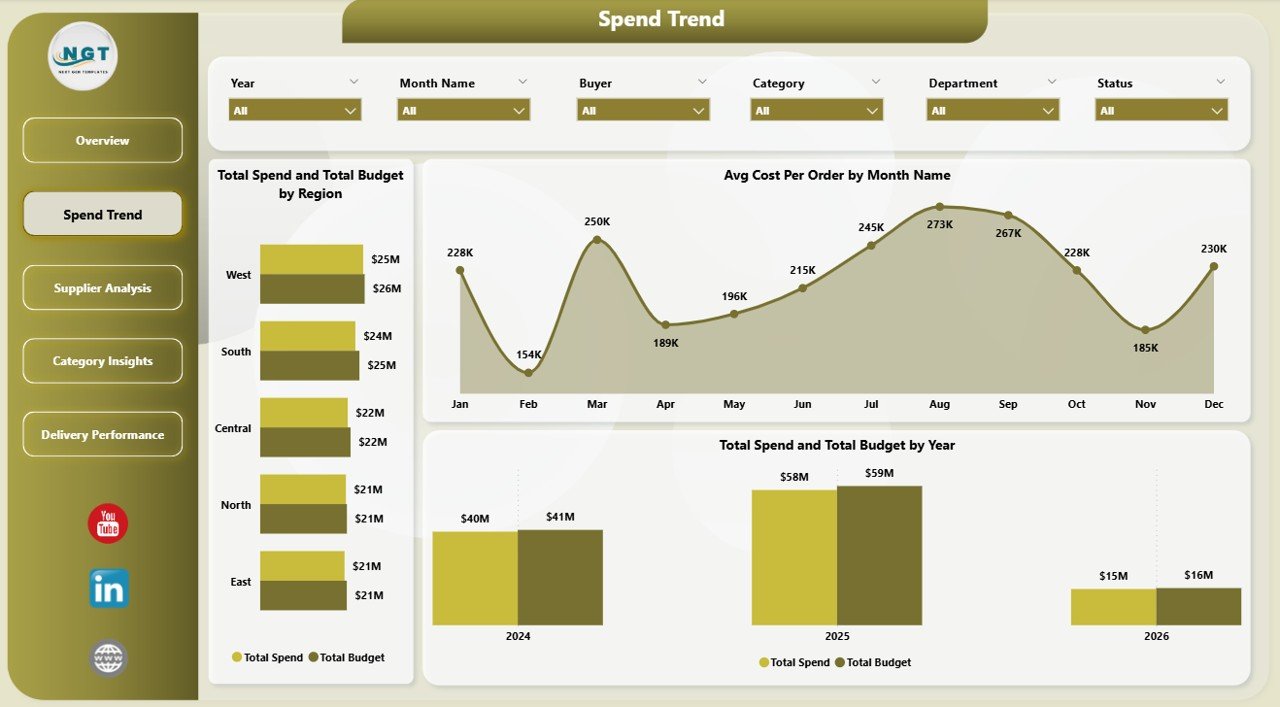
The Spend Trend page provides deep analysis of procurement spending patterns over time. It includes charts for Total Spend and Total Budget by Region to compare regional spending efficiency, Avg Cost Per Order by Month Name to track cost trends, and Total Spend and Total Budget by Year for year-over-year budget compliance analysis. This page is essential for identifying seasonal procurement patterns and optimizing budget allocation across regions and time periods.
 Spend Trend Page
3. Supplier Analysis Page
The Supplier Analysis page evaluates vendor performance using three critical dimensions. Total Spend and Total Budget by Category shows how spending is distributed across procurement categories. On Time Delivery Rate by Supplier reveals which vendors consistently meet delivery deadlines and which need attention. Avg Quality Score and Avg Lead Time by Supplier provides a dual-axis view of supplier quality versus delivery speed, helping procurement teams make strategic sourcing decisions.
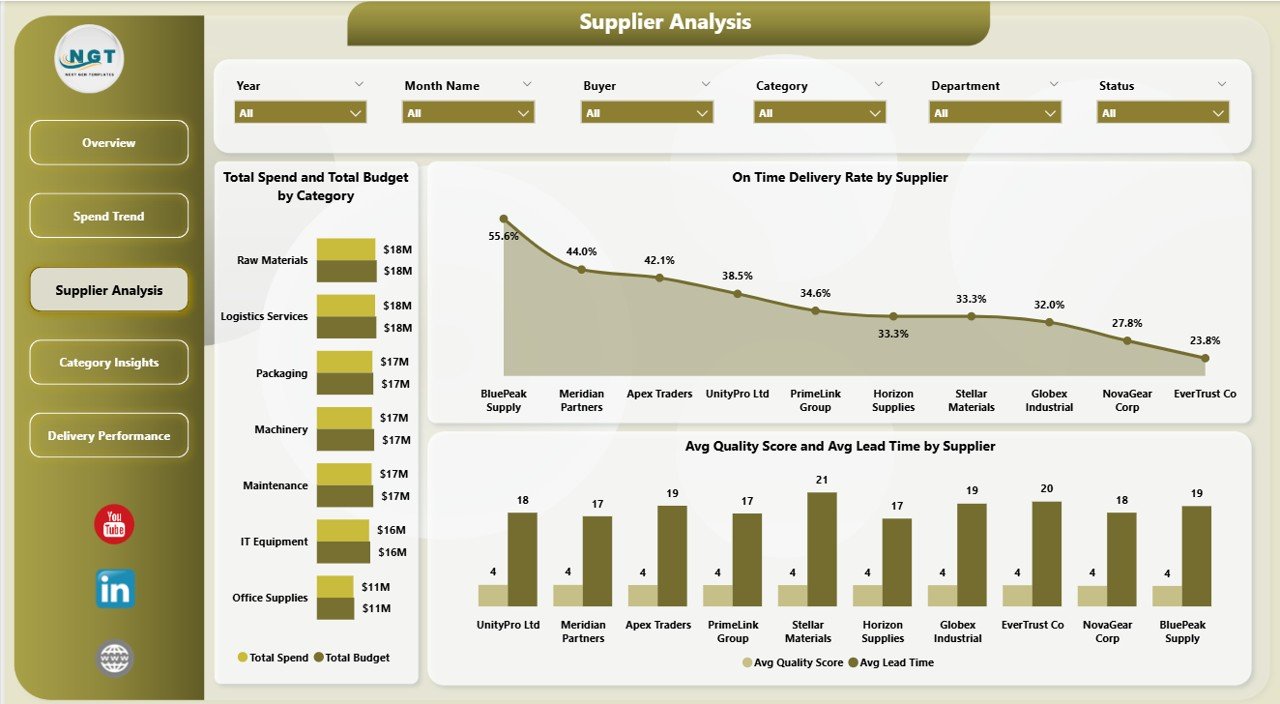 Supplier Analysis Page
4. Category Insights Page
The Category Insights page breaks down procurement performance by category and department. Avg Cost Per Order by Category identifies which product categories have the highest per-order costs. On Time Delivery Rate by Region highlights regional delivery performance differences. Total Spend by Department shows how procurement budgets are consumed across organizational departments, enabling better cross-departmental budget planning.
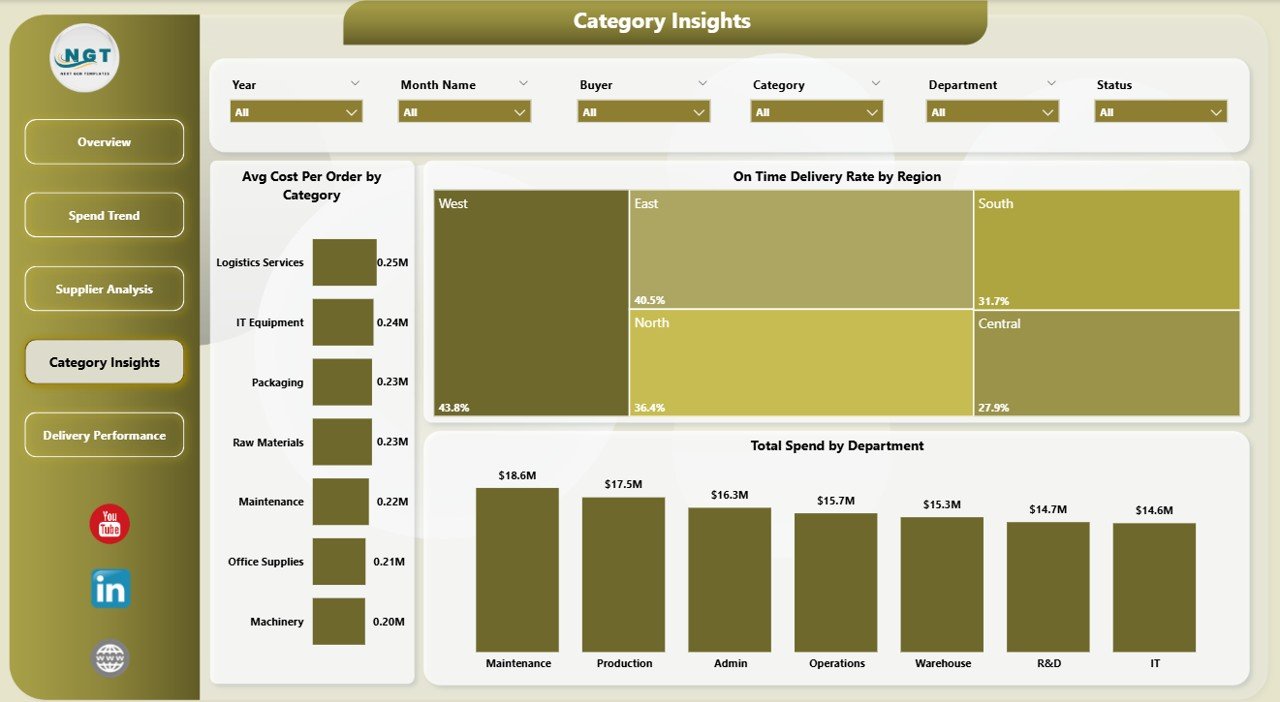 Category Insights Page
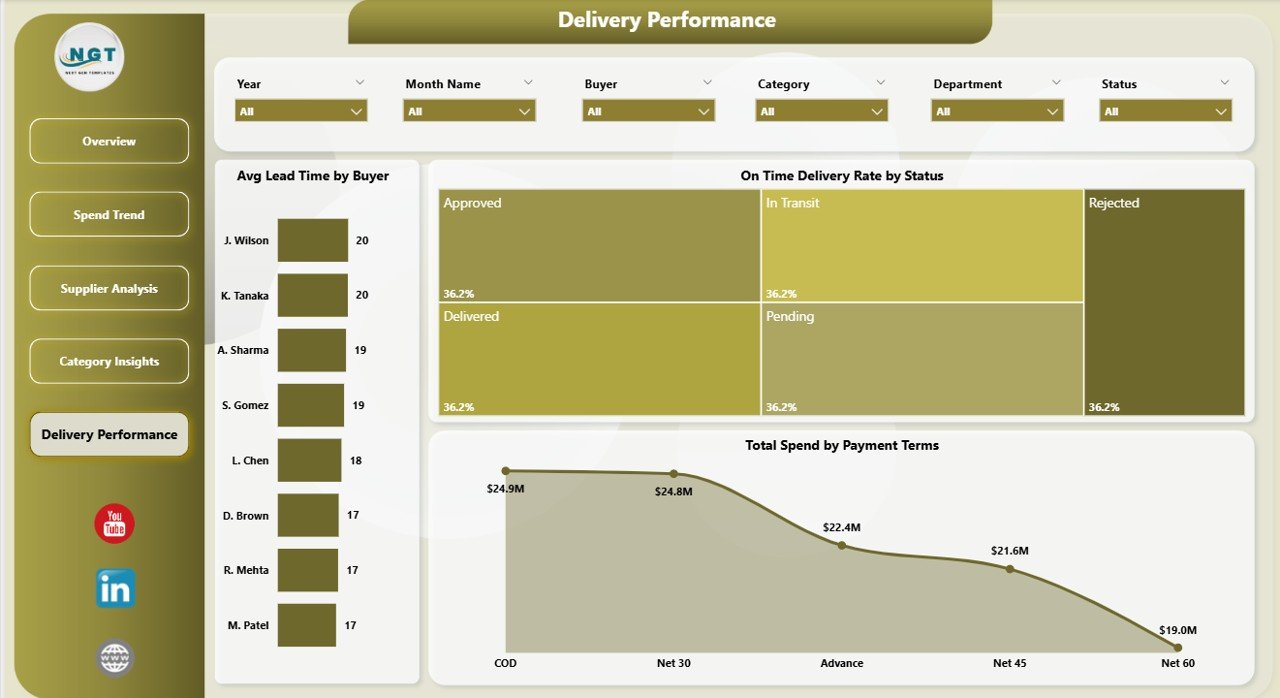
5. Delivery Performance Page
The Delivery Performance page focuses on the logistics and delivery side of procurement. Avg Lead Time by Buyer shows which buyers manage faster procurement cycles. On Time Delivery Rate by Status reveals how delivery performance correlates with order statuses. Total Spend by Payment Terms helps finance teams analyze spending patterns across different payment arrangements, supporting better cash flow management and supplier negotiation strategies.
Click here to Purchase the Procurement Management Dashboard in Power BI
 Delivery Performance Page
Advantages of the Procurement Management Dashboard in Power BI
- Centralized Procurement Visibility — Consolidate all procurement data into one interactive dashboard instead of juggling multiple reports and spreadsheets.
- Real-Time Analytics — Power BI’s dynamic refresh capabilities ensure your dashboard always reflects the latest procurement data.
- Data-Driven Supplier Management — Evaluate suppliers objectively based on delivery rates, quality scores, and cost metrics rather than subjective assessments.
- Budget Compliance Monitoring — Track spend vs budget across regions, categories, and time periods to prevent budget overruns before they happen.
- Cross-Platform Compatibility — Works with Power BI Desktop (free), Power BI Service, and Power BI Mobile for analytics on any device.
Opportunities for Improvement
- Custom Data Connections — Connect the dashboard to live data sources like SQL Server, SharePoint, or ERP systems for real-time automated updates.
- Additional KPIs — Add custom measures such as Purchase Order Cycle Time, Contract Compliance Rate, or Savings vs Budget to extend the analytics scope.
- Row-Level Security — Implement Power BI row-level security to restrict data access by region, department, or user role for enterprise deployments.
- Drill-Through Pages — Create drill-through pages for detailed order-level or supplier-level analysis from any summary chart.
Best Practices for Using This Dashboard
- Update Data Regularly — Refresh your data source weekly or connect to a live database for the most accurate insights.
- Start with the Overview — Use the Overview page to identify areas of concern, then drill into specific pages for detailed analysis.
- Use Slicers Strategically — Combine multiple slicer selections to create focused views such as “Q1 spend for Supplier X in Region North.”
- Benchmark Monthly — Compare current month performance against prior periods using the Spend Trend page to track improvement.
- Share with Stakeholders — Publish the dashboard to Power BI Service for collaborative access across procurement, finance, and operations teams.
Explore Relevant Templates
🔹 Procurement Management Dashboard in Excel — The same procurement analytics in a pivot-driven Excel format with 5 interactive pages.
🔹 Vendor Performance Dashboard in HTML — Track vendor delivery, quality, and cost performance in an interactive HTML dashboard.
🔹 Inventory Management Dashboard in HTML — Monitor stock levels, warehouse performance, and inventory movement with interactive visuals.
🔹 Supply Chain Dashboard in Excel — End-to-end supply chain visibility with supplier performance and logistics tracking.
Frequently Asked Questions
What KPIs does the Procurement Management Dashboard in Power BI track?
The Procurement Management Dashboard in Power BI tracks 5 key performance indicators: Total Budget, Budget Variance, Total Spend, Total Orders, and Avg Quality Score. These KPIs are displayed on the Overview page through interactive KPI cards with dynamic formatting.
How many dashboard pages are included in this Power BI template?
This template includes 5 interactive pages: Overview, Spend Trend, Supplier Analysis, Category Insights, and Delivery Performance. Each page provides unique analytical perspectives on procurement operations.
Do I need Power BI Pro to use this dashboard?
No. The dashboard works with Power BI Desktop which is completely free from Microsoft. Power BI Pro is only needed if you want to share the published dashboard with other users through the Power BI service.
Can I connect this dashboard to my own data sources?
Yes. Power BI supports connections to Excel files, CSV files, SQL Server, SharePoint, Azure, SAP, and hundreds of other data sources. Simply replace the sample data connection with your own procurement data source.
Click here to Purchase the Procurement Management Dashboard in Power BI
What is the best Power BI dashboard template for procurement analytics?
The Procurement Management Dashboard in Power BI is one of the best templates for procurement analytics. It provides 5 analytical pages covering spend tracking, budget compliance, supplier evaluation, category insights, and delivery performance — all with interactive slicers and dynamic charts.
How do I evaluate supplier performance using this dashboard?
The Supplier Analysis page evaluates vendors using On Time Delivery Rate by Supplier, Avg Quality Score and Avg Lead Time by Supplier, and Total Spend and Total Budget by Category. These metrics help procurement teams make objective, data-driven decisions about vendor selection and contract renewals.
Conclusion
The Procurement Management Dashboard in Power BI is a must-have analytics tool for any procurement team looking to gain visibility into spending patterns, supplier performance, budget compliance, and delivery efficiency. With 5 interactive pages, 5 KPI cards, and 15+ dynamic charts, this template transforms complex procurement data into clear, actionable insights that drive better purchasing decisions.
Click here to Purchase the Procurement Management Dashboard in Power BI
Visit our YouTube channel for step-by-step tutorials: Youtube.com/@PK-AnExcelExpert
For more Power BI templates, explore: Microsoft Power BI Documentation