In today’s fast-moving business world, innovation drives growth. Companies that invest in Research and Development (R&D) constantly look for ways to track, analyze, and optimize their innovation performance. However, managing multiple projects, budgets, and outcomes can quickly become complex without a structured system. That’s where the R&D KPI Dashboard in Excel steps in.
This article explores everything about the Research & Development KPI Dashboard in Excel — what it is, how it works, its key features, advantages, and best practices. By the end, you’ll understand how to use this tool to transform your R&D performance management.
Click to buy Research & Development (R&D) KPI Dashboard in Excel
What Is a Research & Development (R&D) KPI Dashboard in Excel?
A Research and Development KPI Dashboard is an interactive Excel-based reporting tool that helps organizations monitor, measure, and analyze their R&D performance. It consolidates key performance indicators (KPIs) into a single view, allowing decision-makers to understand progress across projects, teams, and departments.Research & Development (R&D) KPI Dashboard in Excel
This dashboard tracks crucial metrics such as:
- Number of active projects
- Research efficiency ratio
- Innovation success rate
- Product development cycle time
- Cost variance and budget utilization
By presenting real-time data through charts, slicers, and visual indicators, the dashboard ensures that teams stay aligned with business goals and make data-driven decisions.
Why Do You Need an R&D KPI Dashboard?
Managing research and development activities involves high costs, long timelines, and uncertainty. Without proper tracking, it’s easy to lose control over resources or miss innovation goals.
The R&D KPI Dashboard in Excel simplifies this process by:
- Consolidating performance data from multiple sources.
- Providing instant insights into actual vs. target performance.
- Highlighting trends across months and years.
- Enabling early detection of delays, inefficiencies, or cost overruns.
It turns complex R&D data into a clear, visual summary — helping leaders focus on innovation rather than administration.
Key Features of the Research & Development KPI Dashboard in Excel
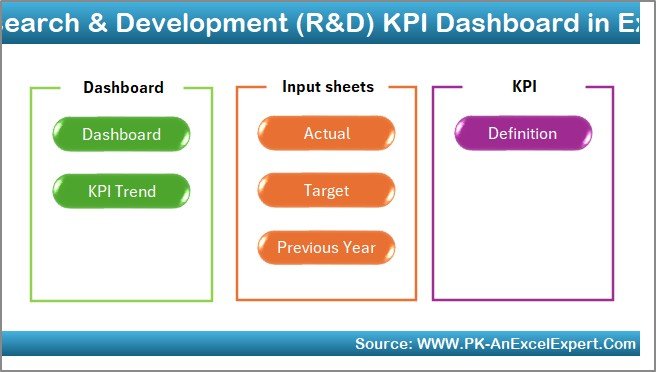
This ready-to-use dashboard comes with 7 structured worksheets, each serving a specific purpose to manage R&D KPIs efficiently.
Home Sheet — Your Navigation Hub
The Home sheet acts as an index page. It contains six interactive buttons that let you jump directly to different sections of the dashboard. This makes navigation quick, even for new users. Whether you want to view trends, enter data, or update definitions — everything is just one click away.
Click to buy Research & Development (R&D) KPI Dashboard in Excel
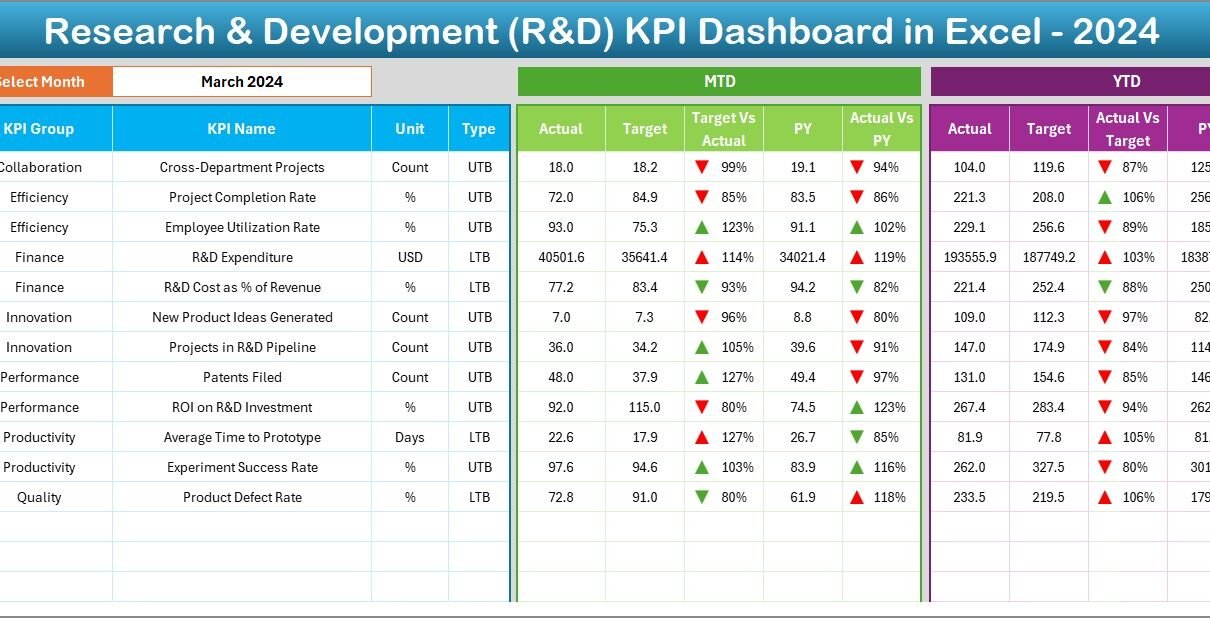
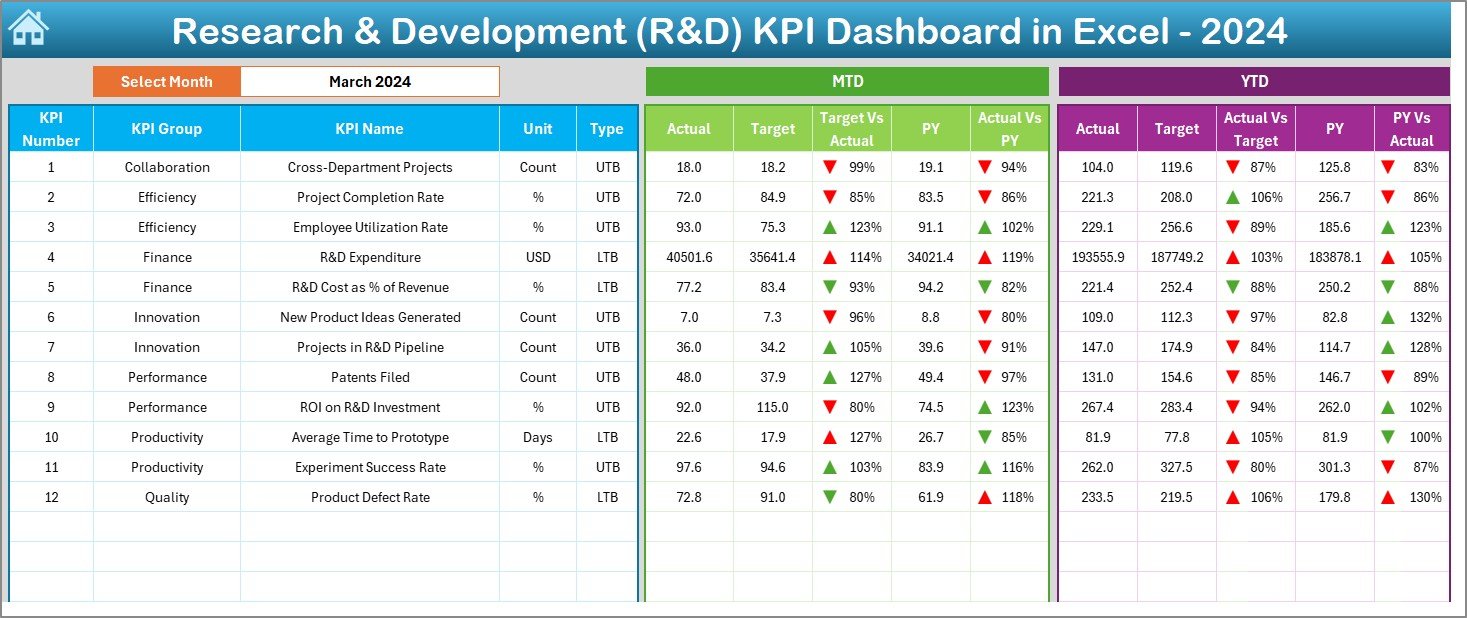
Dashboard Sheet — Centralized Performance View
The Dashboard sheet is the heart of the R&D KPI Dashboard. It provides a real-time overview of all KPIs, allowing you to analyze monthly and yearly trends with ease.
- Dynamic Month Selector (Cell D3): Choose any month from the dropdown to refresh the entire dashboard instantly.
- MTD and YTD Sections: View Month-to-Date (MTD) and Year-to-Date (YTD) performance for Actual, Target, and Previous Year (PY) data.
- Conditional Formatting Arrows: Quickly identify performance status using up/down arrows — green for improvement, red for decline.
- Target vs Actual Comparison: Analyze how close your results are to the set goals.
This sheet delivers a full 360-degree view of your R&D efficiency, productivity, and cost control in one place.
Click to buy Research & Development (R&D) KPI Dashboard in Excel
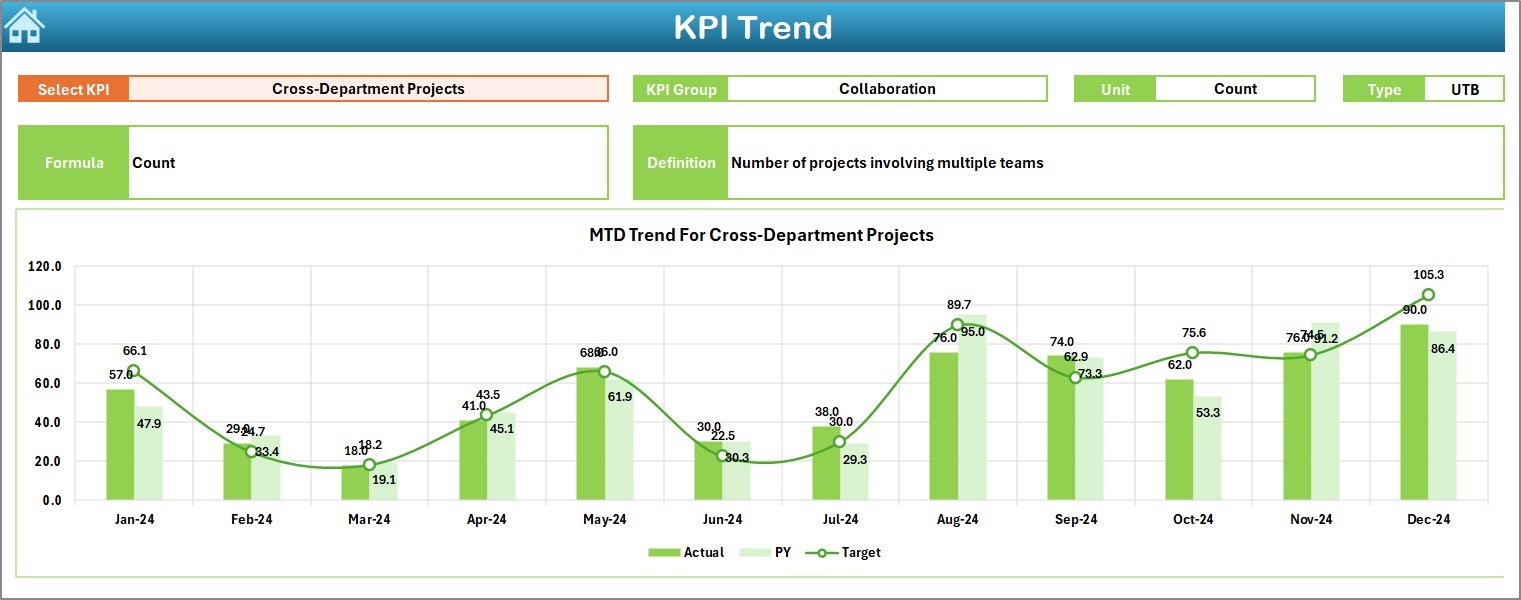
KPI Trend Sheet — Track Performance Over Time
The KPI Trend sheet allows users to analyze trends for individual KPIs across months or years.
- Dropdown for KPI Selection (Cell C3): Select any KPI to view its detailed trend.
- KPI Information Panel: Displays key attributes — KPI Group, Unit, Type (UTB or LTB), Formula, and Definition.
- Trend Charts: Compare Actual, Target, and Previous Year values visually for both MTD and YTD data.
This helps identify seasonal variations, performance dips, and long-term growth opportunities in your R&D operations.
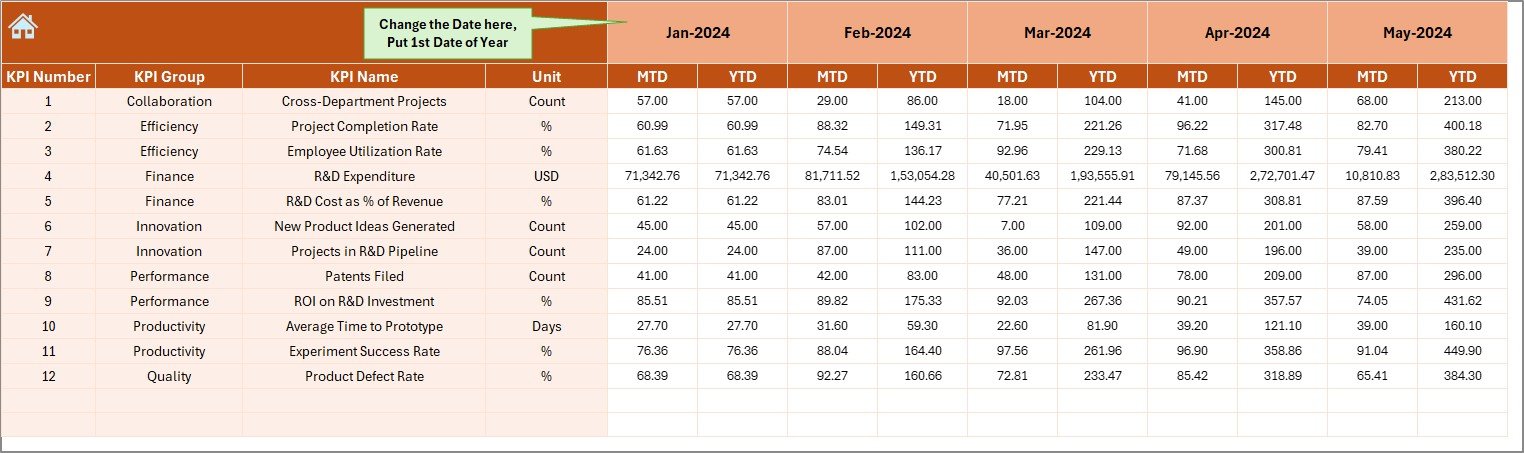
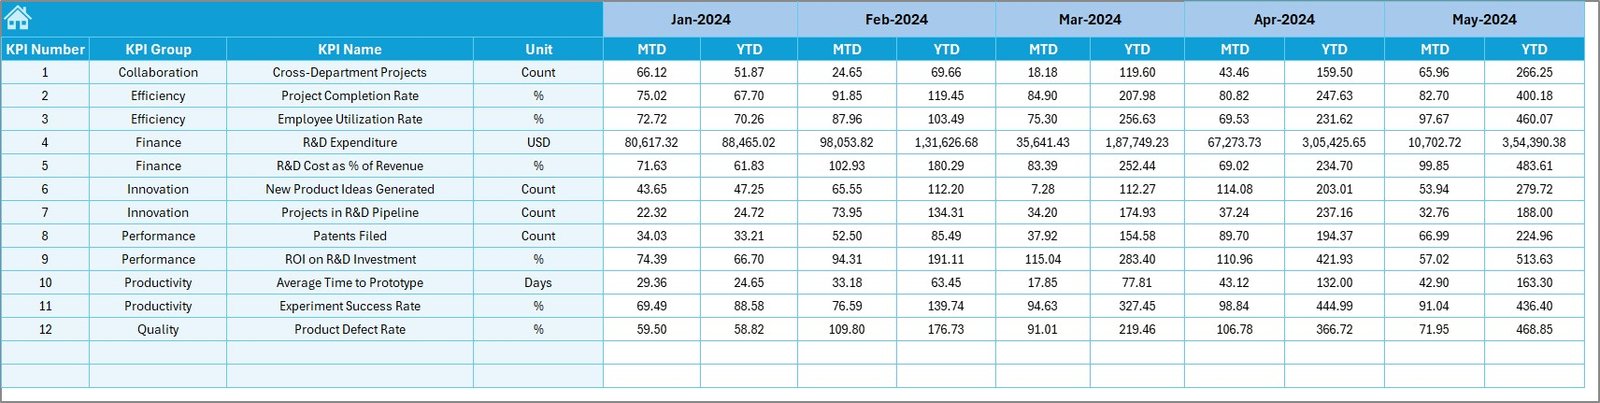
Actual Numbers Input Sheet — Capture Real Performance
In this sheet, you input actual monthly values for each KPI. It’s easy to manage and customize.
- Month Selection (Cell E1): Enter the first month of the fiscal year to automatically adjust subsequent calculations.
- Structured Data Table: Input MTD and YTD actuals for each KPI.
Keeping this sheet updated ensures your dashboard reflects real-time performance insights.
Click to buy Research & Development (R&D) KPI Dashboard in Excel
Target Sheet — Define Your Goals
The Target sheet captures planned performance for every KPI. You can define both MTD and YTD targets here. Comparing these against actual numbers highlights whether R&D goals are being met.
Pro Tip: Review targets quarterly to ensure they align with changing innovation strategies and budgets.
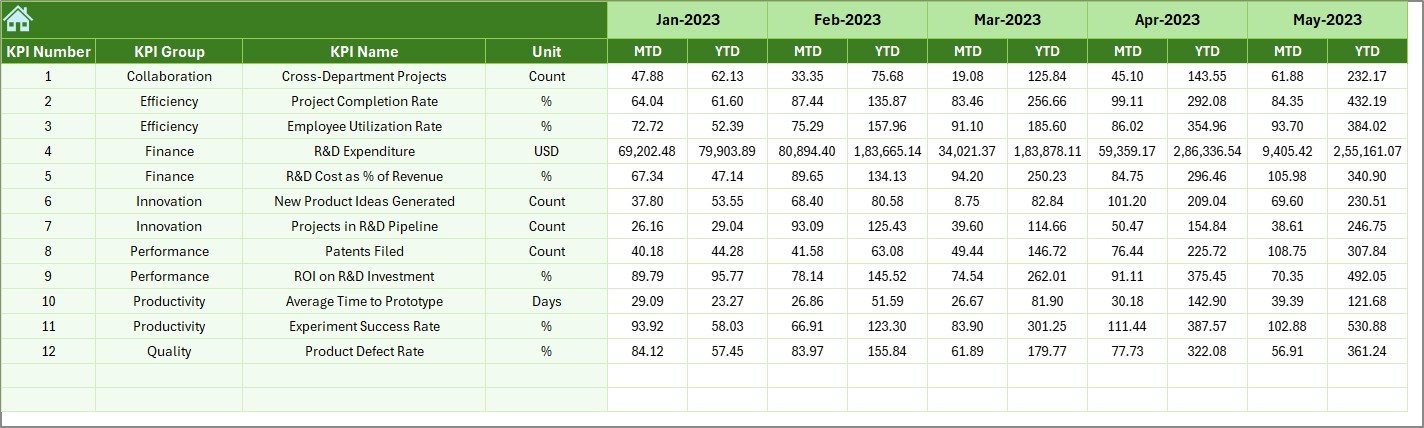
Previous Year Numbers Sheet — Benchmark Historical Data
This sheet stores last year’s data for all KPIs. Having this information is crucial for year-on-year comparison.
- Compare current performance with historical benchmarks.
- Analyze growth patterns and identify recurring bottlenecks.
- Use it to set realistic goals for upcoming periods.
Click to buy Research & Development (R&D) KPI Dashboard in Excel
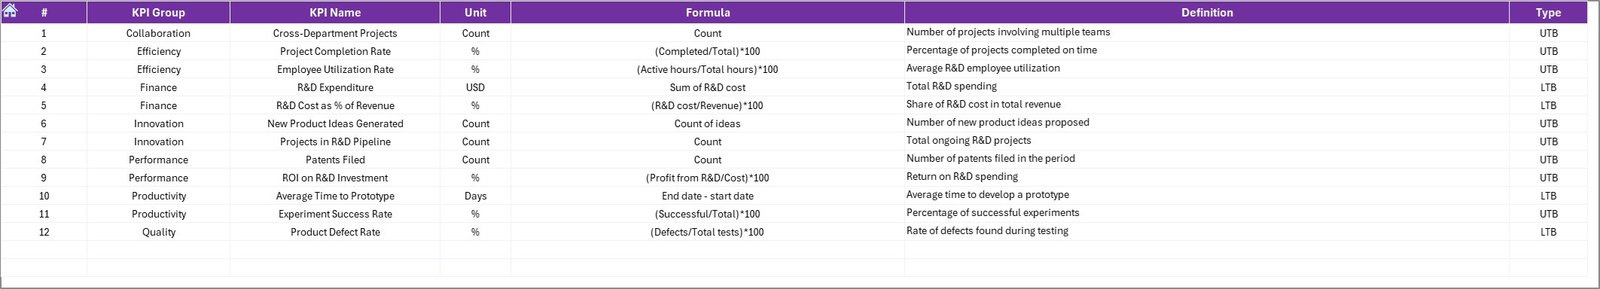
KPI Definition Sheet — Document Your Metrics
The KPI Definition sheet is your R&D dictionary. It contains:
- KPI Name and Group
- Unit of Measurement
- Formula for calculation
- Definition explaining the metric’s purpose
- Type: Whether UTB (Upper the Better) or LTB (Lower the Better)
This ensures every stakeholder understands what each KPI means and how it’s calculated.
How the R&D Dashboard Works
The R&D Dashboard in Excel uses simple formulas, conditional formatting, and charts to make performance tracking interactive and automated.
- Data Entry: Enter monthly actuals, targets, and previous year data.
- Analysis: Dashboard calculates variance and displays arrows and color indicators automatically.
- Visualization: Charts on the Dashboard and KPI Trend sheets update dynamically.
- Decision-Making: Compare performance, analyze deviations, and identify areas for improvement.
- It’s a seamless system that requires no coding or Power BI setup — just Excel.
Advantages of Research & Development KPI Dashboard in Excel
Let’s explore how this dashboard benefits organizations of all sizes.
- Centralized R&D Monitoring
Track all R&D activities, from project initiation to completion, in one place. No need to juggle multiple spreadsheets.
- Improved Decision-Making
The dashboard highlights key performance gaps through visuals, helping management prioritize resource allocation and strategy changes.
- Time-Saving Automation
Automatic calculations and pre-built charts reduce manual reporting efforts. You can focus more on research and less on data formatting.
- Data Accuracy
With structured input sheets, data consistency improves. You eliminate duplicate or missing entries.
- Enhanced Transparency
Everyone in the organization can clearly see how R&D initiatives are performing against targets.
- Year-on-Year Comparison
By including previous year data, the dashboard enables trend analysis and helps measure true innovation growth.
Best Practices for Using the R&D KPI Dashboard
To get the most from your Excel R&D dashboard, follow these proven best practices:
- Keep Data Updated: Enter actual numbers at least once a month for accurate insights.
- Standardize KPI Definitions: Ensure all departments use consistent KPI definitions.
- Review Targets Periodically: Adjust goals based on changing budgets or innovation priorities.
- Visualize Trends Regularly: Use the KPI Trend sheet to track long-term improvements.
- Encourage Collaboration: Share the dashboard across teams for transparency.
- Protect Data: Use Excel’s password protection to avoid accidental edits.
- Use Color Codes Wisely: Green for growth, red for risk — make visual cues intuitive.
How to Customize the R&D KPI Dashboard
One of the biggest strengths of this template is flexibility. You can easily:
- Add or remove KPIs as your organization evolves.
- Modify formulas to match your company’s internal logic.
- Insert department-specific sheets (like Chemistry, Electronics, or Mechanical).
- Link it with Power BI for advanced data visualization.
.
How the Dashboard Enhances Innovation Management
Innovation doesn’t happen by chance — it needs measurable systems. The R&D KPI Dashboard transforms innovation management by providing:
- Clarity: Track which projects contribute most to innovation goals.
- Control: Detect issues early and act proactively.
- Consistency: Maintain uniform performance tracking across teams.
- Confidence: Make funding and strategic decisions backed by data.
Conclusion
The Research & Development KPI Dashboard in Excel is more than just a reporting tool — it’s a complete performance management solution for innovation teams. With interactive sheets, automated calculations, and visual indicators, it brings clarity, efficiency, and control to complex R&D operations.
Whether you’re a startup experimenting with new ideas or a large enterprise managing global R&D programs, this Excel-based dashboard empowers you to track success, identify challenges, and steer innovation toward measurable results.
Start using the R&D KPI Dashboard in Excel today — and transform how you measure innovation.
Frequently Asked Questions (FAQs)
- What are R&D KPIs?
R&D KPIs are measurable indicators that evaluate the effectiveness and efficiency of research and development activities, such as innovation success rate, project completion time, and cost efficiency.
- Why should I use Excel for R&D dashboards?
Excel offers flexibility, accessibility, and ease of customization. You don’t need advanced software — the dashboard works with built-in Excel formulas and charts.
- Can I add more KPIs to this dashboard?
Yes. You can easily expand the dashboard by adding new KPIs in the KPI Definition and Data Input sheets.
- Is this dashboard suitable for small companies?
Absolutely. It’s designed to scale — whether you’re a small startup or a large organization, you can adapt it to your needs.
- Does the dashboard update automatically?
Yes. Once you input the monthly data, all charts and calculations update automatically without manual work.
- What types of charts are included?
The dashboard includes bar charts, line charts, and conditional formatting indicators for MTD and YTD comparisons.
- Can I compare multiple years?
Yes. The Previous Year sheet allows you to compare historical data and analyze year-on-year performance.
- How often should I update the dashboard?
It’s best to update it monthly to maintain accurate performance tracking and timely insights.
- Is the dashboard password-protected?
You can protect sheets in Excel to prevent accidental edits or data manipulation.
- Where can I get this template?
You can download the Research & Development KPI Dashboard in Excel template from your trusted business analytics template provider, such as NextGenTemplates.com or PK-AnExcelExpert.com.
Visit our YouTube channel to learn step-by-step video tutorials
Watch the step-by-step video tutorial:
Click to buy Research & Development (R&D) KPI Dashboard in Excel