Effective sales management requires a clear view of your pipeline. Tracking leads, opportunities, and conversions helps sales teams prioritize efforts, close deals faster, and increase revenue. Our ready-to-use Sales Funnel Report in Excel provides a comprehensive view of your sales process, from lead generation to deal closure.
In this article, we will explore the dashboard features, benefits, best practices, and opportunities for improvement.
What is a Sales Funnel Report in Excel?
A Sales Funnel Report is a visual tool that tracks potential sales at each stage of the sales process. It allows managers and sales teams to monitor conversion rates, analyze lead quality, and identify bottlenecks that slow down the sales cycle.
This Excel-based report is interactive, easy to use, and requires no advanced technical skills. All you need is your sales data, and the dashboard will help you make data-driven decisions.
Key Features of the Sales Funnel Report
Click to Buy Sales Funnel Report in Excel
The report includes three worksheet tabs, each designed for specific purposes:
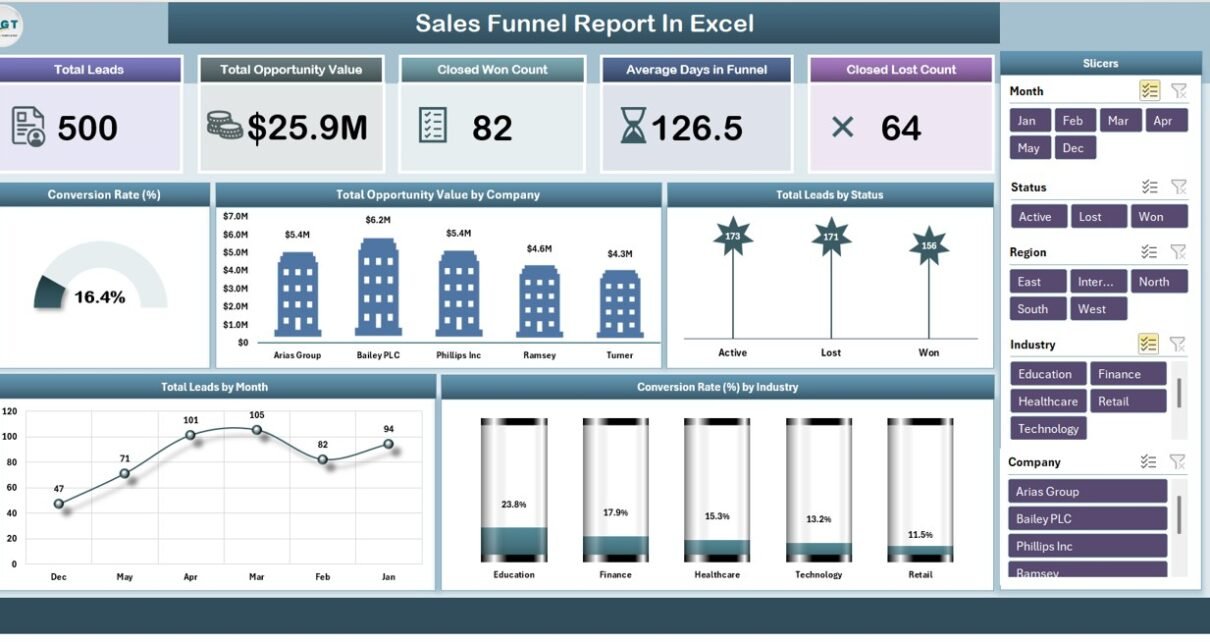
1. Summary Sheet Tab
The Summary sheet provides a high-level overview of your sales funnel with cards and charts:
Cards:
-
Total Leads – Count of all leads in the pipeline.
-
Total Opportunity Value – Total potential revenue from all opportunities.
-
Closed Won Count – Number of successfully closed deals.
-
Average Days in Funnel – Average time a lead spends in the sales funnel.
-
Closed Leads – Total number of closed leads, including won and lost.
Charts:
-
Conversion Rate (%) – Overall conversion percentage from lead to closure.
-
Total Opportunity Value by Company – Identify which companies contribute most to revenue potential.
-
Total Leads by Status – Track leads by status, such as New, Contacted, Qualified, or Lost.
-
Total Leads by Month – Monitor monthly lead generation trends.
-
Conversion Rate (%) by Industry – Analyze which industries have the highest conversion rates.
This sheet provides actionable insights to help sales managers focus on high-value leads and optimize the sales pipeline.

Click to Buy Sales Funnel Report in Excel
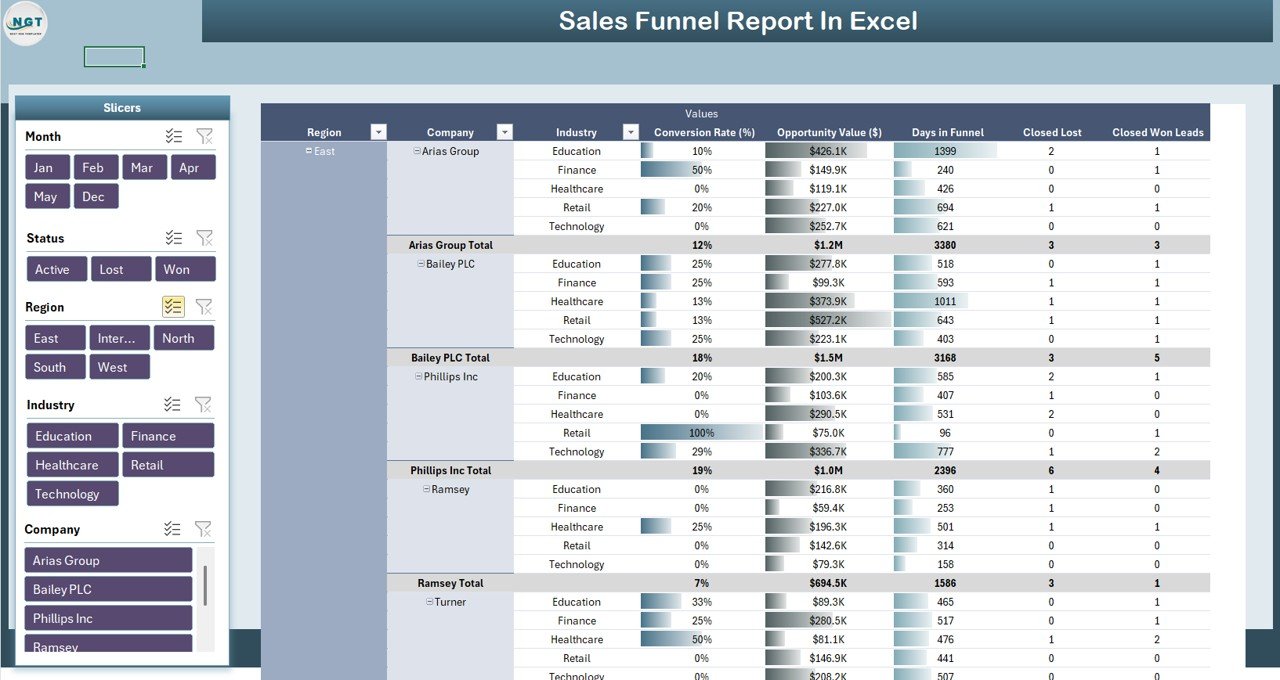
2. Report Sheet Tab
The Report sheet is a Power Pivot view, allowing you to:
-
Slice and dice data by company, industry, or lead status.
-
Filter by time periods, sales reps, or regions.
-
Visualize trends in conversion rates, lead volume, and opportunity value.
This tab helps managers perform in-depth analysis for strategy planning and performance evaluation.
Click to Buy Sales Funnel Report in Excel
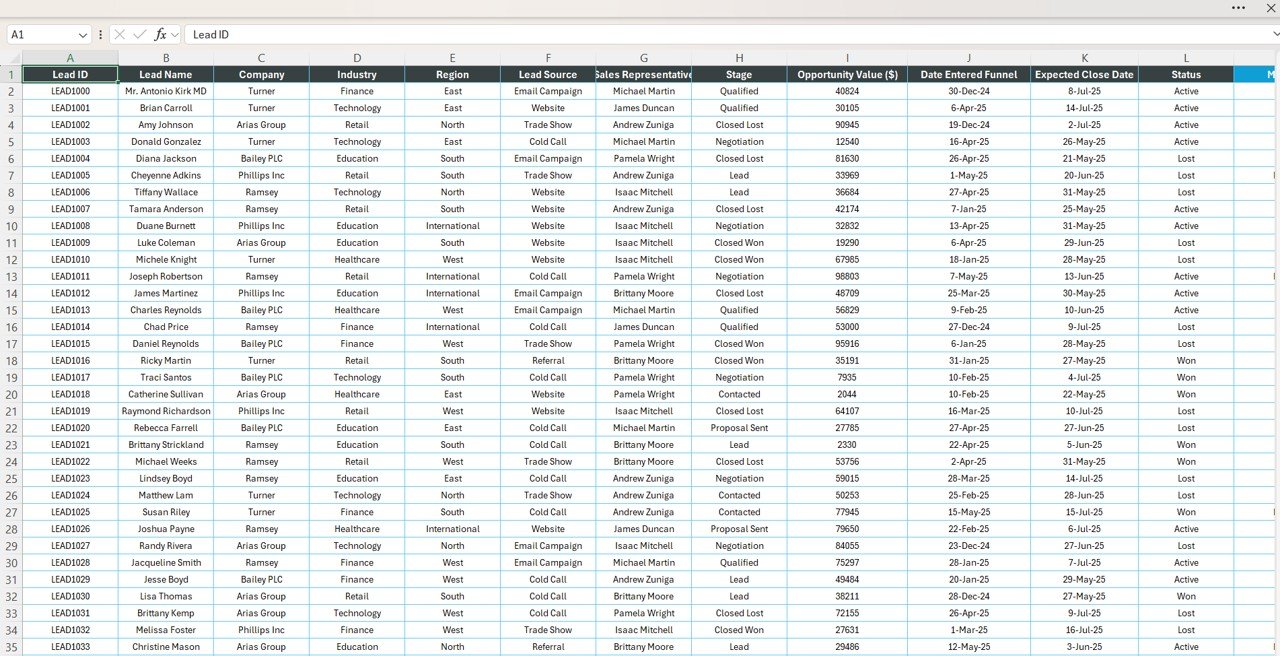
3. Data Sheet Tab
The Data sheet acts as the input database, where you can record:
- Lead ID
- Lead Name
- Company
- Industry
- Lead Status
- Opportunity Value ($)
- Lead Source
- Assigned Sales Rep
- Lead Created Date
- Lead Closed Date
All summary cards and charts are dynamically linked to this sheet, making updates and reporting seamless and efficient.
Click to Buy Sales Funnel Report in Excel
Advantages of Using This Sales Funnel Report
-
Real-Time Insights – Track leads, opportunities, and conversions in real-time.
-
Better Pipeline Management – Identify bottlenecks and optimize your sales funnel.
-
Industry & Company Analysis – Focus on high-value leads and profitable sectors.
-
Monthly & Trend Analysis – Monitor lead generation and conversion patterns over time.
-
Ease of Use – No complex software required; Excel is widely accessible.
Opportunities for Improvement
While the dashboard is robust, you can enhance it by:
-
Integrating with CRM systems like Salesforce or HubSpot for automatic lead updates.
-
Adding conditional formatting to highlight high-value opportunities.
-
Tracking lead source performance to evaluate marketing effectiveness.
-
Adding sales rep performance metrics for team-level analysis.
-
Implementing alerts for leads that have been in the funnel for too long.
Best Practices for Using the Sales Funnel Report
-
Keep Data Updated – Ensure the Data sheet is accurate for meaningful insights.
-
Monitor Conversion Rates – Identify areas with low conversion to take corrective actions.
-
Use Filters & Slicers – Customize the view for department or regional analysis.
-
Analyze Trends – Compare performance month-over-month to spot patterns.
-
Share Insights – Use the report to guide sales strategy and team meetings.
Conclusion
The Sales Funnel Report in Excel is a powerful tool for managing your sales pipeline. By tracking leads, opportunities, and conversions, it helps sales managers and teams make data-driven decisions, optimize resources, and boost revenue. With this ready-to-use Excel report, you can monitor your funnel, spot bottlenecks, and prioritize high-value opportunities effectively.
Visit our YouTube channel to learn step-by-step video tutorials
Watch the step-by-step video Demo:
Click to Buy Sales Funnel Report in Excel