In today’s digital world, data and infrastructure security stand as top priorities for every organization. Whether it’s a small business or a global enterprise, maintaining strong cybersecurity and physical protection is no longer optional — it’s a necessity.
However, measuring security effectiveness can be complex. That’s where a Security KPI Dashboard in Excel comes in. It helps organizations track, measure, and analyze key security metrics with clarity and precision — all in one place.
This ready-to-use Excel dashboard empowers managers and security professionals to gain real-time insights into performance indicators such as incident response time, system vulnerability, policy compliance, and risk reduction trends.
In this article, we’ll explore everything you need to know about creating and using a Security KPI Dashboard in Excel — its structure, features, benefits, best practices, and common FAQs. Let’s get started!
Click to buy Security KPI Dashboard in Excel
What Is a Security KPI Dashboard in Excel?
A Security KPI Dashboard in Excel is a powerful management tool that allows you to monitor and analyze key performance indicators (KPIs) related to information security, physical safety, and compliance.
It consolidates multiple data points — from incident counts to threat response times — into an interactive and visual dashboard. This makes it easier for decision-makers to evaluate how well their security strategies are performing.
Because it’s built in Excel, it’s:
- Affordable: No expensive software or subscriptions required
- Customizable: You can easily add, modify, or remove KPIs
- Visual and Interactive: Includes charts, slicers, and drop-downs
- Collaborative: Easily shareable across departments
Key Features of the Security KPI Dashboard in Excel
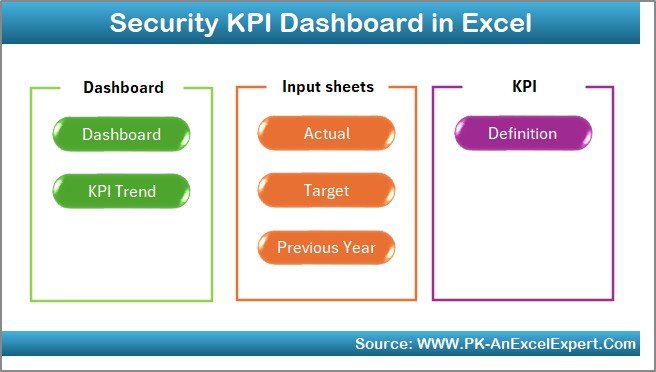
This dashboard is built to make performance tracking seamless and insightful. It includes 7 main worksheets, each serving a specific purpose:
Home Sheet
The Home sheet acts as a navigation hub. It includes buttons that help users jump to different sections instantly — such as the Dashboard, KPI Trend, and Target sheets.
This index-style interface improves user experience and ensures that you can access any part of the file quickly without scrolling endlessly.
Click to buy Security KPI Dashboard in Excel
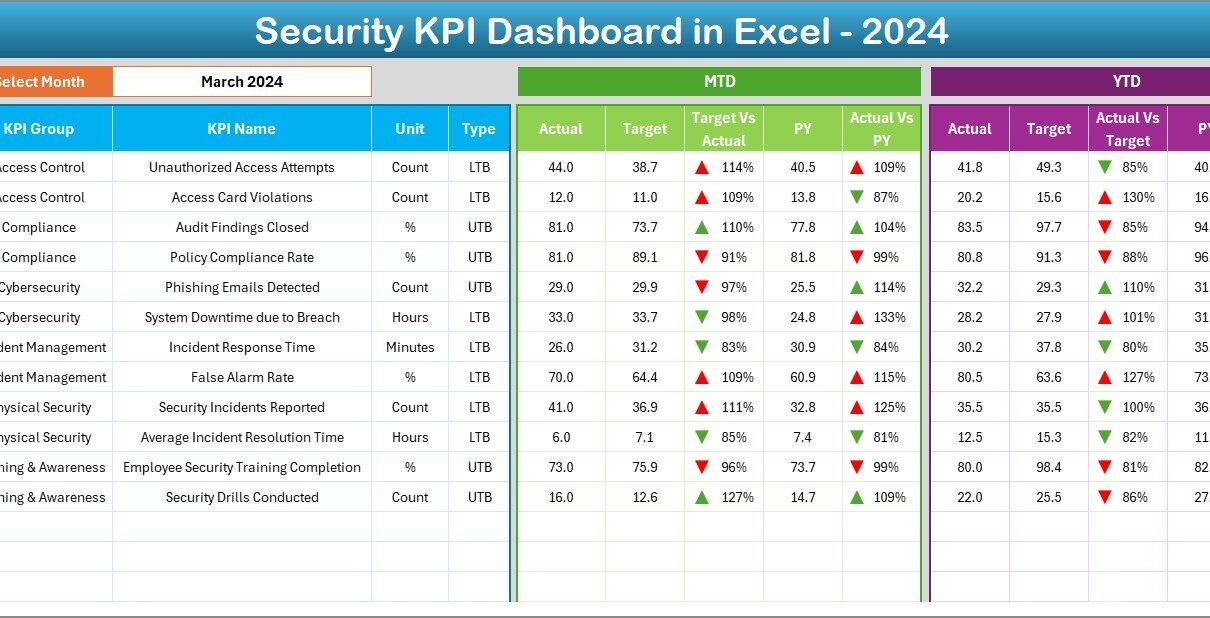
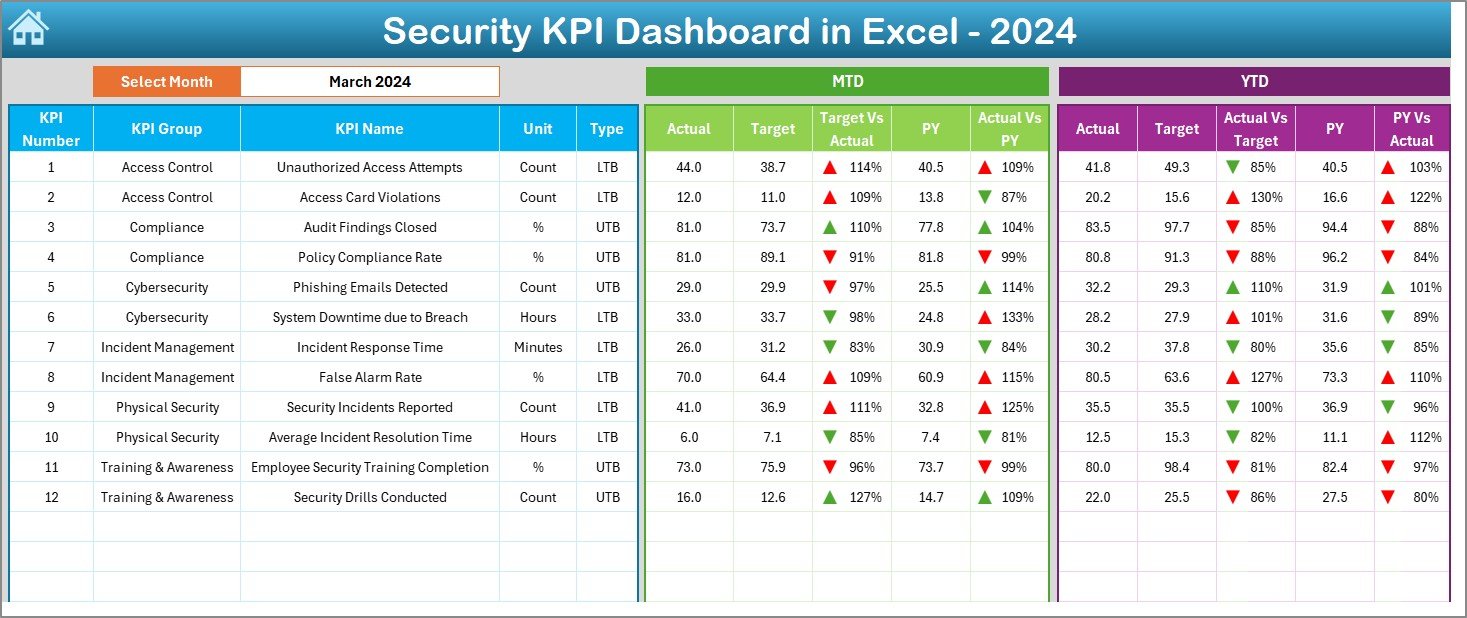
Dashboard Sheet Tab
The Dashboard is the heart of this Excel file.
Here’s what it includes:
- A drop-down menu (cell D3) to select the month you want to analyze
- Dynamic MTD (Month-to-Date) and YTD (Year-to-Date) values that update automatically
- Conditional formatting with arrows showing performance trends
- Comparison visuals between:
- Actual vs Target
- Actual vs Previous Year
This sheet allows you to visualize progress, detect patterns, and identify performance gaps at a glance. Whether it’s the number of incidents or the average resolution time, you get an immediate picture of your organization’s security posture.
Click to buy Security KPI Dashboard in Excel
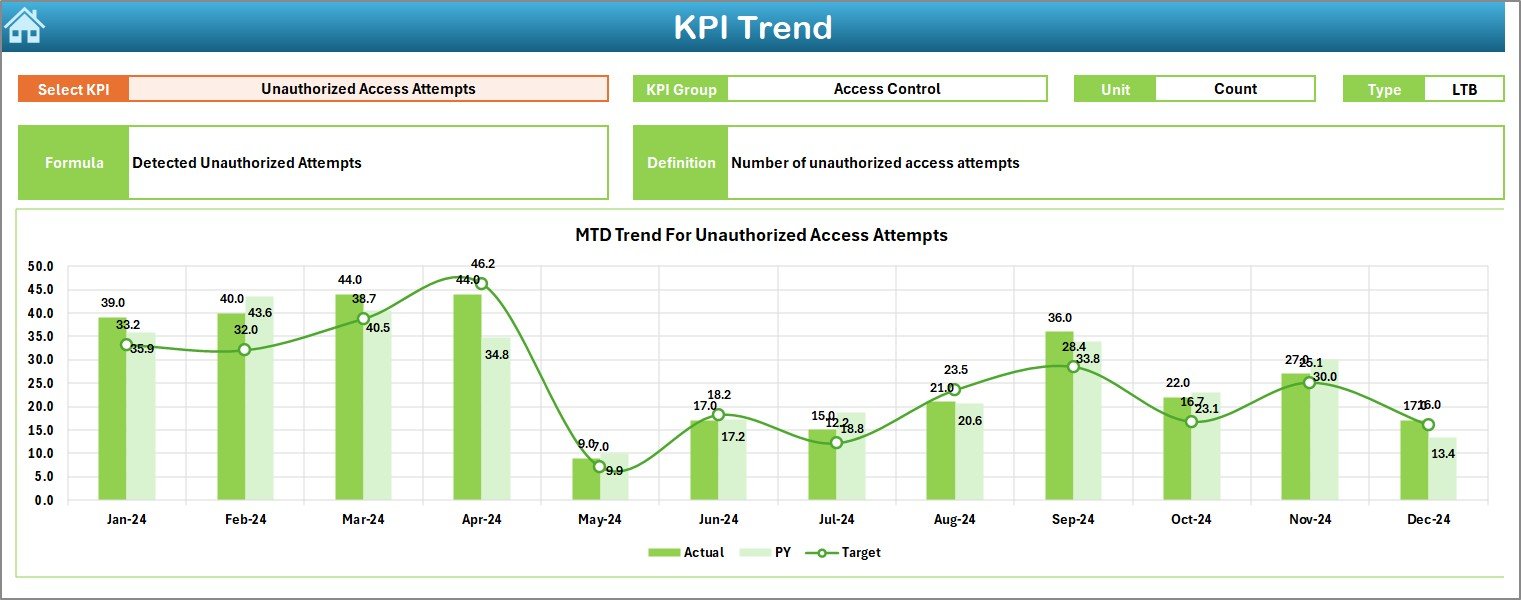
KPI Trend Sheet Tab
The KPI Trend sheet adds depth to your analysis.
You can select any KPI name from the drop-down menu in cell C3, and the sheet automatically displays:
- KPI Group
- Unit of measurement
- KPI Type — Lower the Better (LTB) or Upper the Better (UTB)
- Formula and Definition
It also includes trend charts for both MTD and YTD performance — comparing Actual, Target, and Previous Year values over time.
This page helps you uncover long-term patterns and seasonal variations in your security operations.
Click to buy Security KPI Dashboard in Excel
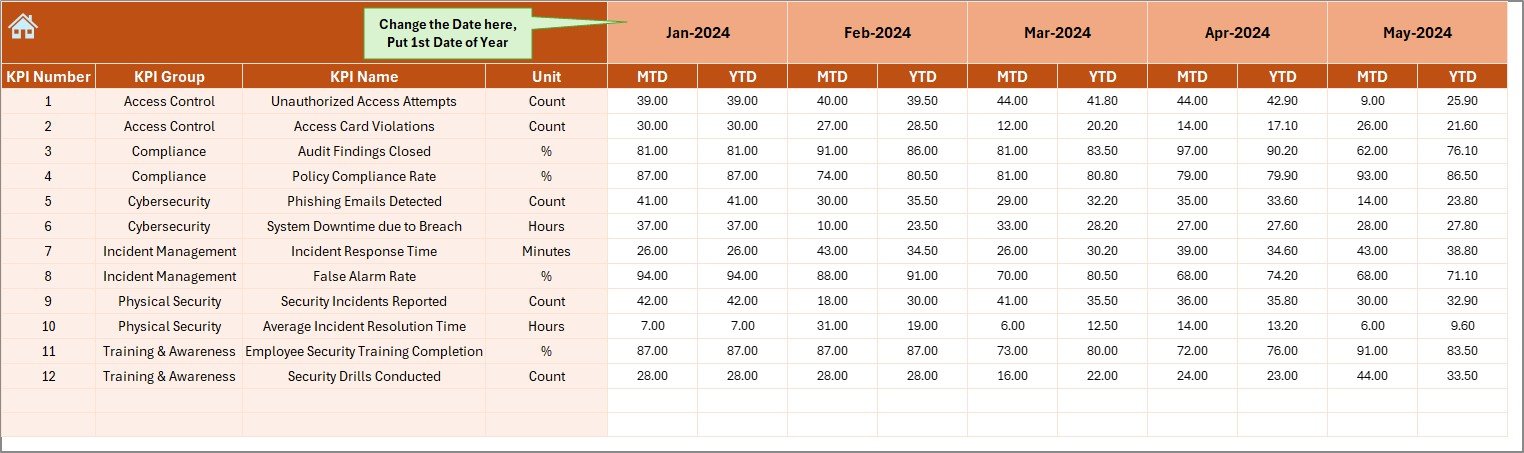
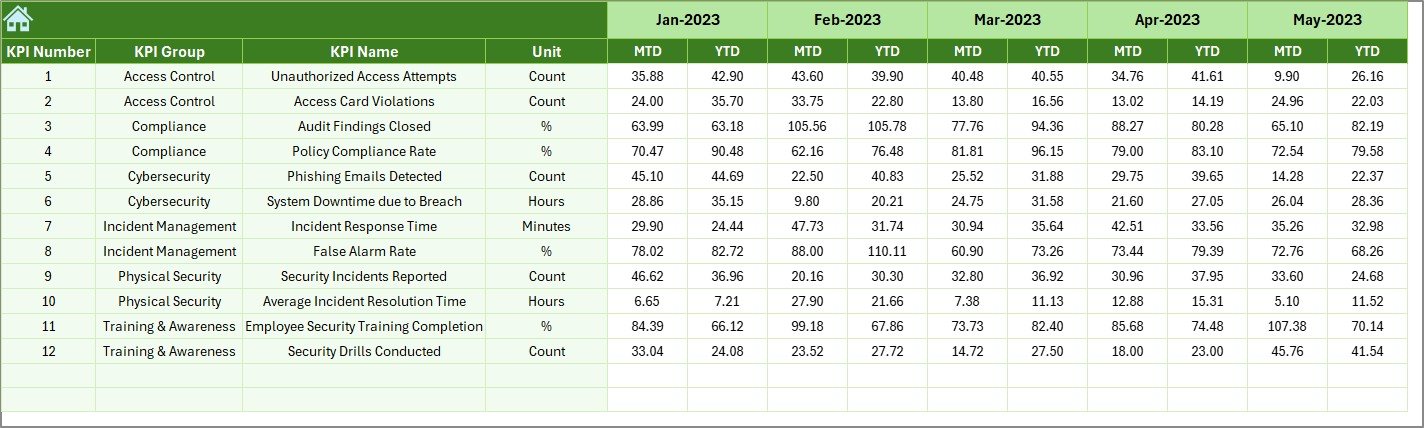
Actual Numbers Input Sheet
This is where the real data entry happens.
Users can input actual monthly performance values (MTD and YTD) for each KPI. The month can be selected from cell E1, which defines the reporting period.
This approach ensures flexibility and helps teams manage evolving datasets throughout the year.
Click to buy Security KPI Dashboard in Excel
Target Sheet Tab
The Target sheet stores performance goals for each KPI — both MTD and YTD.
It’s the benchmark against which actual results are compared on the dashboard. By keeping all target data in one sheet, organizations can ensure consistency and easily adjust objectives when needed.
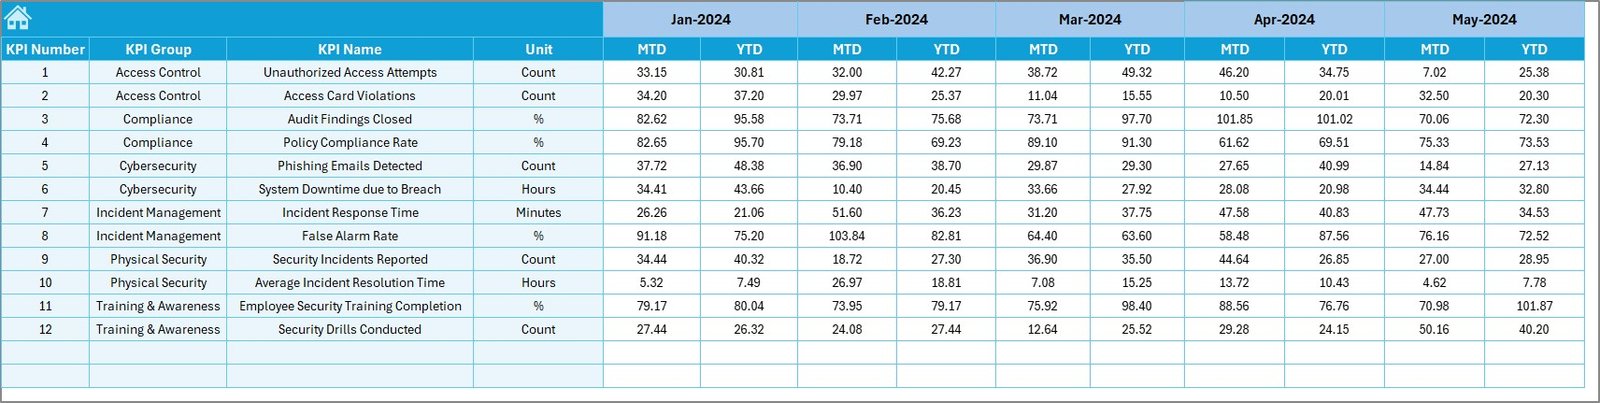
Previous Year Number Sheet
This sheet captures historical data from the previous year for each KPI.
Comparing current year performance with the previous one helps assess growth, identify weaknesses, and understand whether recent initiatives are driving improvements.
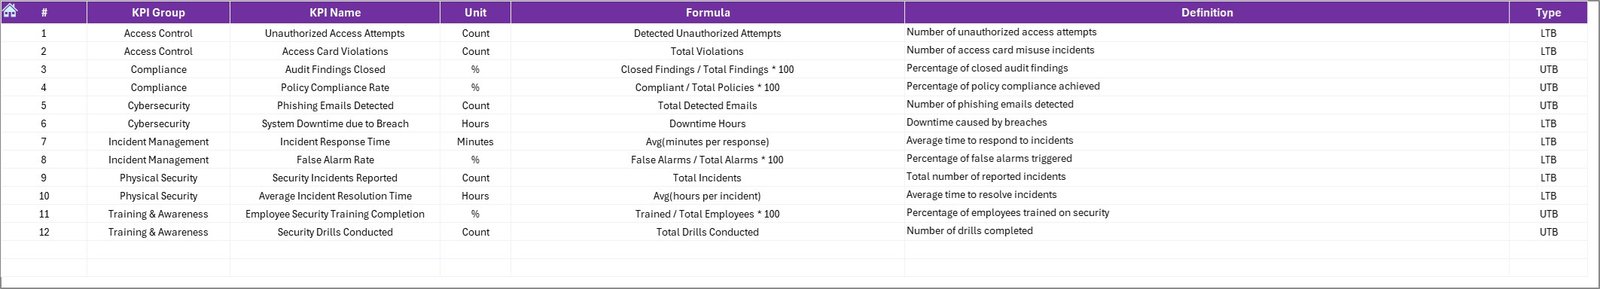
KPI Definition Sheet Tab
This section acts as your reference library.
It lists:
- KPI Names
- KPI Groups
- Units of measurement
- Formulas
- KPI Definitions
This makes it easier to maintain transparency and consistency, especially when multiple departments use the dashboard.
Why Use a Security KPI Dashboard in Excel?
A well-designed dashboard gives decision-makers a complete picture of security performance. Instead of browsing through endless reports, users can monitor metrics visually.
Centralized Monitoring
All key indicators — such as incident rates, vulnerability scores, and response times — are consolidated in one interactive dashboard.
Real-Time Insights
The dashboard updates automatically when new data is entered, offering instant insights into monthly and yearly performance.
Easy Comparison
Track performance against targets and previous years to evaluate security improvements or decline.
Simple Customization
Users can add or remove KPIs, modify visual elements, and even integrate additional sheets — without any coding knowledge.
Cost-Effective
Excel is widely available and doesn’t require any additional licenses, making it ideal for startups, SMEs, and large enterprises alike.
Common Security KPIs to Track
When designing a Security KPI Dashboard, selecting the right metrics is crucial. Below are some commonly used KPIs for tracking performance in cybersecurity and physical safety management.
Incident Response Metrics
- Average Response Time (minutes): Measures how quickly the security team responds to incidents.
- Incident Resolution Time: Indicates how long it takes to fully resolve an issue.
- Number of Security Incidents: Tracks total incidents reported in a given period.
Risk and Threat Metrics
- Vulnerability Detection Rate: Percentage of identified system vulnerabilities.
- Patch Compliance Rate: Measures how often updates and patches are applied on time.
- Malware Infection Rate: Tracks the number of systems affected by malware.
Compliance and Awareness Metrics
- Employee Training Completion (%): Shows how many staff members have completed security awareness programs.
- Access Control Violations: Counts the number of unauthorized access attempts.
- Policy Compliance Rate: Tracks adherence to security policies and procedures.
Financial and Efficiency Metrics
- Cost per Security Incident: Average cost incurred per incident.
- Security ROI (%): Evaluates return on security investments.
- Downtime Hours: Measures productivity loss caused by security breaches.
Advantages of Using a Security KPI Dashboard in Excel
A Security KPI Dashboard provides several advantages beyond simple data tracking:
Improved Visibility
All relevant KPIs appear in a single, easy-to-read view, helping management teams stay informed.
Faster Decision-Making
By visualizing performance trends, teams can quickly identify areas that need improvement and act promptly.
Enhanced Accountability
Each KPI clearly shows who is responsible for a metric, improving ownership and follow-through.
Better Compliance Tracking
The dashboard simplifies tracking of policy adherence and audit readiness.
Continuous Improvement
Historical data enables you to track improvements and adjust strategies to achieve better outcomes.
How to Create a Security KPI Dashboard in Excel — Step by Step
Building this dashboard doesn’t require complex programming skills. Here’s a simple approach:
Step 1: Identify Key KPIs
Start by listing the most relevant security KPIs for your organization. Ensure each KPI has a unit, target, formula, and owner.
Step 2: Design Input Sheets
Create structured tables for:
- Actual data
- Target data
- Previous year numbers
Ensure consistent column headers and data formats for easy analysis.
Step 3: Define KPIs
Prepare a KPI Definition Table that includes:
- KPI Name
- Formula
- Unit
- Type (UTB/LTB)
- Definition
Step 4: Build Calculations
Use Excel formulas like SUMIFS, AVERAGEIFS, and IFERROR to calculate monthly and yearly totals.
Step 5: Add Data Validation and Drop-Downs
Add drop-down lists for KPIs and Months using Excel’s Data Validation feature to improve usability.
Step 6: Create Pivot Tables
Use Pivot Tables to analyze data dynamically — by KPI group, month, or performance type.
Step 7: Add Visual Charts
Insert Pivot Charts such as:
- Column chart for “Incidents by Month”
- Line chart for “MTD/YTD Trends”
- Pie chart for “KPI Group Contribution”
Step 8: Apply Conditional Formatting
Add arrows, color scales, and bars to visualize performance instantly.
Step 9: Design Navigation Buttons
Use shapes and hyperlinks to create a Home page with navigation buttons.
Step 10: Finalize and Protect
Lock formulas, hide helper columns, and protect the workbook to prevent accidental edits.
Best Practices for Using the Security KPI Dashboard in Excel
To ensure you get the most accurate insights and maintain long-term effectiveness, follow these best practices:
Keep Data Updated
Update actuals monthly to maintain accuracy. Outdated data leads to misleading conclusions.
Validate Data Regularly
Cross-verify input numbers with reports from security tools or systems.
Use Consistent KPI Definitions
Ensure all stakeholders understand the same definition for each metric to avoid confusion.
Visualize for Impact
Use charts that best represent your data — line charts for trends, pie charts for distribution, and bar charts for comparisons.
Maintain Version Control
Save different dashboard versions monthly or quarterly to track historical improvements.
Backup Regularly
Since Excel is file-based, always maintain a secure backup copy.
Review KPIs Annually
Reassess whether your KPIs still align with business and regulatory goals.
Tips to Enhance Dashboard Performance
To make your Security KPI Dashboard faster and more professional:
- Reduce file size by removing unused rows and columns.
- Avoid volatile formulas like OFFSET and INDIRECT.
- Use named ranges for cleaner formulas.
- Add a professional color theme aligned with your organization’s brand.
- Use slicers to filter data dynamically without changing formulas.
Conclusion
A Security KPI Dashboard in Excel is more than just a spreadsheet — it’s a strategic tool for driving data-driven decision-making.
It helps organizations measure what matters most, streamline performance tracking, and maintain strong governance over both physical and digital security environments.
With features like dynamic slicers, trend analysis, conditional formatting, and clear data visualization, this dashboard brings transparency and accountability to every level of security management.
When used consistently, it becomes your go-to system for monitoring, reporting, and improving security operations — all within the familiar and flexible environment of Microsoft Excel.
Frequently Asked Questions (FAQs)
What is a Security KPI Dashboard?
A Security KPI Dashboard is a visual reporting tool that tracks performance metrics related to security operations. It helps teams monitor effectiveness, detect trends, and make informed decisions.
Why should I use Excel for a Security Dashboard?
Excel is cost-effective, customizable, and widely available. It allows you to build interactive dashboards without needing specialized software or coding expertise.
How many KPIs should I track in my Security Dashboard?
Ideally, start with 10–15 KPIs that reflect your core security goals. You can expand later as your operations grow.
What’s the difference between MTD and YTD in the dashboard?
- MTD (Month-to-Date): Shows performance from the start of the current month to date.
- YTD (Year-to-Date): Shows performance from the start of the year to the current date.
Can I automate data entry in this dashboard?
Yes. You can link the Excel dashboard to databases or security monitoring tools using Power Query or VBA automation to update data automatically.
Who should use this dashboard?
It’s ideal for security managers, IT administrators, compliance officers, and business leaders who need to monitor KPIs for reporting and strategic planning.
Is the dashboard suitable for both cybersecurity and physical security?
Absolutely. The dashboard structure is flexible enough to track both cybersecurity KPIs and facility-related safety metrics.
Can I share this dashboard with my team?
Yes. Excel dashboards can be shared via OneDrive, SharePoint, or Google Drive, ensuring team collaboration and real-time updates.
What are the most important security KPIs?
Some key KPIs include Incident Response Time, Policy Compliance Rate, Training Completion %, Malware Infection Rate, and Patch Compliance Rate.
How often should I update the Security KPI Dashboard?
It’s best to update it monthly to keep performance data relevant and actionable. Quarterly reviews can also provide strategic insights for long-term improvement.
Visit our YouTube channel to learn step-by-step video tutorials
Watch the step-by-step video tutorial:
Click to buy Security KPI Dashboard in Excel