Introduction
The Space Education Programs KPI Dashboard is a comprehensive and ready-to-use template designed to track and analyze Key Performance Indicators (KPIs) relevant to space education initiatives. This dashboard offers an intuitive interface and powerful insights to help educators, administrators, and program managers measure progress and make data-driven decisions. With a focus on clarity and usability, this dashboard provides a streamlined way to monitor multiple KPIs in one place.
Key Features of Space Education Programs KPI Dashboard
- Seven well-structured worksheets, each serving a specific function.
- Interactive dropdowns for dynamic data viewing by month and KPI name.
- Comprehensive KPI tracking with actual, target, and previous year values.
- Conditional formatting with up/down arrows for quick visual performance assessments.
- Trend charts to visualize Monthly-To-Date (MTD) and Year-To-Date (YTD) KPI progress.
- Clear definitions and formulas to understand KPI calculations and relevance.
- Easy data entry sheets for actual numbers, targets, and previous year data.
Dashboard Pages Explanation
1. Home Sheet
This serves as the index page of the dashboard with six navigation buttons that direct you to respective sheets for quick access.
 Home Page
Click to Buy Space Education Programs KPI Dashboard in Excel
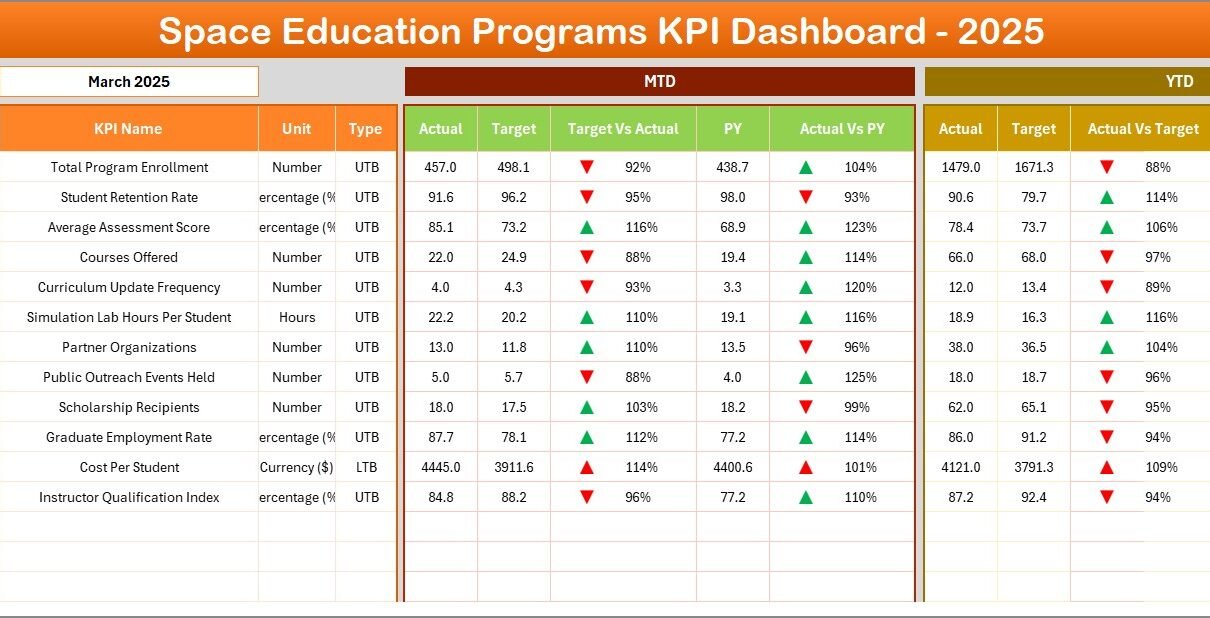
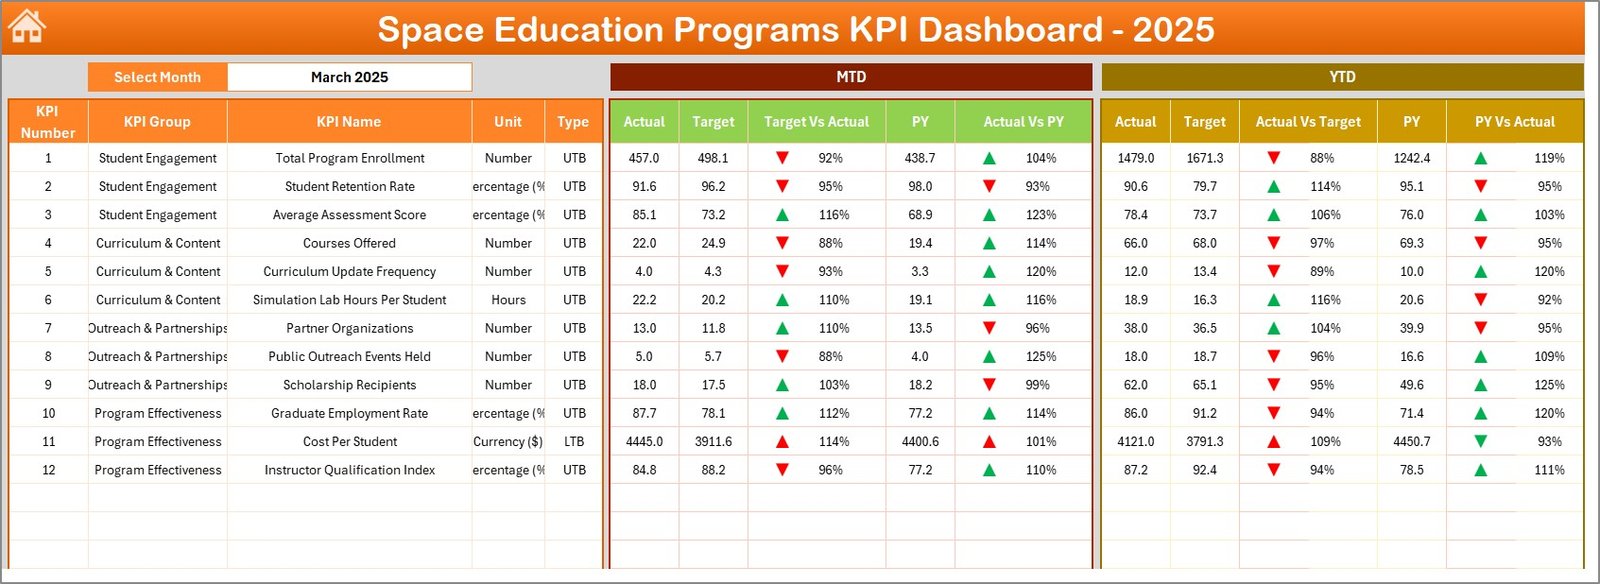
2. Dashboard Sheet Tab
This is the main analytics page displaying overall KPI data for the selected month. Users can select the month via a dropdown in cell D3, which updates all dashboard figures accordingly.
- Displays MTD Actual, Target, Previous Year data with visual indicators for Target vs Actual and PY vs Actual.
- Shows YTD Actual, Target, Previous Year information along with conditional formatting and arrows indicating performance trends.
 Space Education Programs KPI Dashboard
Click to Buy Space Education Programs KPI Dashboard in Excel
3. KPI Trend Sheet Tab
Allows the user to select a specific KPI via dropdown (cell C3) to review detailed information:
- KPI Group, Unit of measurement, KPI Type (Lower the Better or Upper the Better)
- Formula and Definition of the KPI for clarity
- Dynamic MTD and YTD trend charts comparing Actual, Target, and Previous Year data
 KPI Trend Sheet
Click to Buy Space Education Programs KPI Dashboard in Excel
4. Actual Numbers Input Sheet
This sheet is dedicated to entering actual KPI values for MTD and YTD for a particular month. The month can be adjusted by changing the value in cell E1, which represents the first month of the year.
 Actual Numbers Input sheet
5. Target Number Input Sheet
Here, users enter the target KPI numbers for each month, covering both MTD and YTD targets to enable goal tracking.
 Target Number Input sheet
Click to Buy Space Education Programs KPI Dashboard in Excel
6. Previous Year Number Sheet Tab
This is the data input sheet for previous year’s KPI values, structured identically to the current year data input for easy comparison.
 Previous Year Number Input sheet
Click to Buy Space Education Programs KPI Dashboard in Excel
7. KPI Definition Sheet Tab
This sheet holds metadata related to each KPI:
- KPI Name and Group
- Unit of measurement
- Formula and detailed definition
- KPI Type indicating whether Lower The Better (LTB) or Upper The Better (UTB)
 KPI Definition sheet
Advantages of Space Education Programs KPI Dashboard
- Easy Navigation: The Home Sheet provides quick access to all sections, improving workflow efficiency.
- Dynamic Data Visualization: Conditional formatting and trends visually highlight performance changes.
- Comprehensive Tracking: Monitoring MTD, YTD, and previous year data offers a holistic performance view.
- Flexible Data Entry: Separate sheets for actuals, targets, and previous year numbers streamline data management.
- Detailed KPI Information: Definitions and formulas aid understanding and ensure correct KPI interpretation.
- Adaptable Time Frame: Month selection dynamically changes dashboard values, allowing up-to-date insights.
Opportunities for Improvement
Click to Buy Space Education Programs KPI Dashboard in Excel
- Integration with live data sources to automate data updates and reduce manual input errors.
- Add user access controls to restrict sensitive data editing capabilities.
- Incorporate predictive analytics for forecasting KPI trends.
- Extend dashboard compatibility for mobile devices to support monitoring on the go.
Best Practices
Click to Buy Space Education Programs KPI Dashboard in Excel
- Regularly update the actual, target, and previous year numbers to keep insights accurate.
- Use the KPI definitions tab to ensure all team members understand what each KPI measures.
- Leverage the trend charts in the KPI Trend sheet for identifying patterns or anomalies.
- Utilize conditional formatting signals to prioritize focus areas for improvement.
- Periodically review KPI targets and align them with evolving strategic objectives.
FAQs
What is the main purpose of the Space Education Programs KPI Dashboard?
It is designed to track and evaluate key performance indicators for space education initiatives, enabling data-driven decision-making.
Can I customize the KPIs in this dashboard?
Yes, the KPI Definition sheet allows you to add or modify KPIs, including their names, formulas, units, and definitions.
Is this dashboard compatible with all Excel versions?
While the dashboard is created in Excel, compatibility is best with versions supporting dropdown lists and conditional formatting, such as Excel 2013 and newer.
How can I visualize trends over multiple months?
You can use the KPI Trend sheet, where you choose your KPI from the dropdown and view the MTD and YTD trend charts.
Can this dashboard be used for other education programs?
Yes, by updating the KPIs and associated data inputs, this dashboard can adapt to various educational program KPIs beyond space education.
Conclusion
Click to Buy Space Education Programs KPI Dashboard in Excel
The Space Education Programs KPI Dashboard is a powerful tool designed to simplify monitoring and analyzing performance indicators crucial to space education initiatives. Its user-friendly layout, combined with robust data visualization and customizable inputs, makes it an invaluable asset for program leaders aiming to optimize outcomes. By employing this dashboard, educators and administrators can quickly identify successes, challenges, and opportunities, leading to informed decisions and continuous program improvement.
For more information on KPI dashboards and Excel templates, visit the official Microsoft Excel support page.
Visit our YouTube channel to watch the demo.
Click to Buy Space Education Programs KPI Dashboard in Excel