Managing sports and recreation programs requires constant monitoring, timely decisions, and accurate insights. Whether you oversee a fitness center, a community sports club, a recreation department, or a private academy, you deal with countless data points every month — memberships, attendance, events, equipment maintenance, staff performance, and more.
To turn this complex data into meaningful insights, you need a simple yet powerful tool — the Sports & Recreation KPI Dashboard in Excel.
In this article, you’ll discover everything you need to know about this ready-to-use Excel dashboard — its structure, features, benefits, and best practices. You’ll also learn how it can transform how you manage sports and recreation activities efficiently.
Click to buy Sports & Recreation KPI Dashboard in Excel
What Is a Sports & Recreation KPI Dashboard in Excel?
A Sports & Recreation KPI Dashboard in Excel is an interactive template designed to track, analyze, and visualize key performance indicators (KPIs) in the sports and recreation industry.
Instead of relying on manual reports or scattered spreadsheets, this dashboard consolidates all your data in one place. It helps you measure month-to-date (MTD) and year-to-date (YTD) performance across areas such as member engagement, facility utilization, revenue generation, and operational efficiency.
Built entirely in Microsoft Excel, the dashboard combines formulas, charts, and slicers to create a dynamic performance management system. With just a few clicks, you can evaluate progress, compare performance against targets, and identify areas that need improvement.
Structure of the Sports & Recreation KPI Dashboard
This dashboard template consists of 7 interactive worksheets, each serving a specific purpose. Together, they form a complete performance management system for sports and recreation organizations.
Summary Page
The Summary Page acts as your navigation control center. It includes six smart buttons that let you jump to different sheets with a single click.
This page simplifies user experience and ensures that even non-technical users can navigate easily. Whether you want to view the Dashboard, enter data, or update KPIs, you can access everything directly from the Summary Page.

Click to buy Sports & Recreation KPI Dashboard in Excel
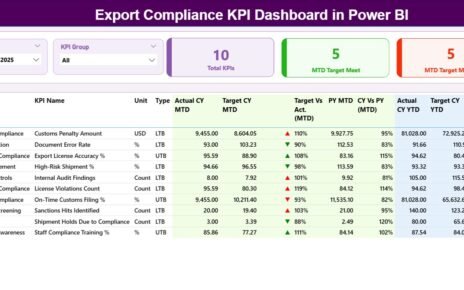
Dashboard Sheet Tab
The Dashboard sheet is the heart of this KPI system. It displays all the essential metrics for the selected month.
You can choose any month using the dropdown menu in cell D3, and the entire dashboard updates instantly to reflect that period’s data.
The page includes dynamic cards showing:
- MTD (Month-to-Date) Actual vs Target vs Previous Year (PY)
- YTD (Year-to-Date) Actual vs Target vs PY
Conditional formatting automatically displays performance indicators — green arrows for improvement and red arrows for decline — helping you quickly grasp progress and problem areas.
This page ensures that managers, coaches, and administrators can make fast, data-driven decisions without deep analysis.

Click to buy Sports & Recreation KPI Dashboard in Excel
Trend Sheet Tab
The Trend sheet provides in-depth performance analysis over time. It helps you identify growth patterns and performance fluctuations for individual KPIs.
You can select any KPI from the dropdown in cell C3 to view:
- KPI Group
- Unit of measurement
- KPI Type (Lower the Better or Upper the Better)
- Formula
- Definition
It also features two line charts showing MTD and YTD trends for Actual, Target, and Previous Year data. These visual trends help management teams evaluate consistency, detect anomalies, and predict future performance.

Click to buy Sports & Recreation KPI Dashboard in Excel
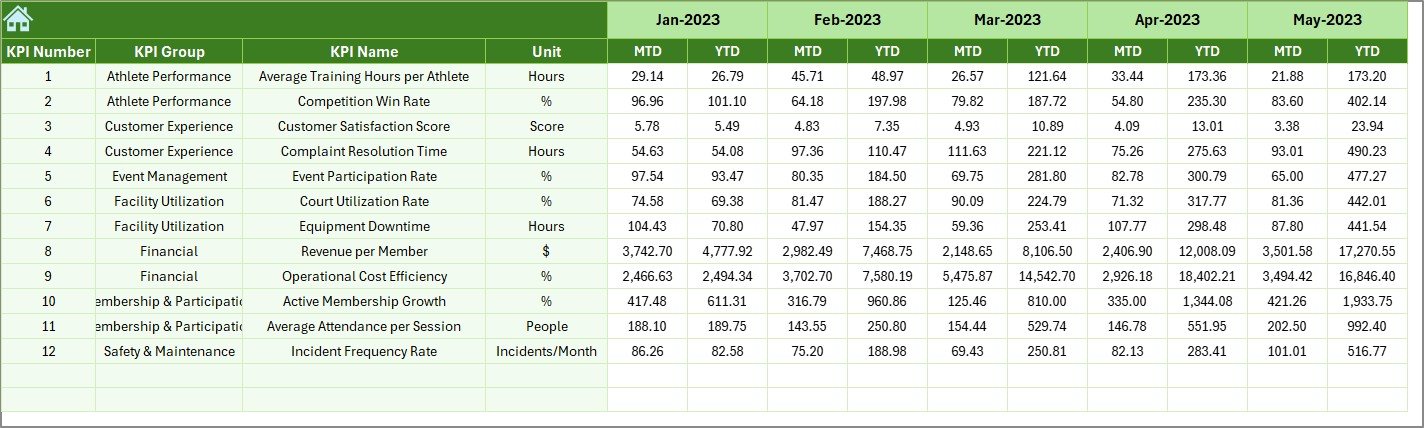
Actual Numbers Input Sheet
Data accuracy is the backbone of every dashboard, and this sheet ensures you have a clean input system.
In the Actual Numbers Input sheet, you’ll enter both MTD and YTD actuals for every KPI and month. You can change the starting month of the year in cell E1, and the dashboard will auto-update the reporting timeline accordingly.
This simple input structure ensures flexibility and keeps data entry intuitive for users of all skill levels.

Target Sheet Tab
The Target Sheet allows you to define monthly and yearly performance benchmarks for each KPI.
By setting MTD and YTD targets, you can measure how close your organization is to achieving its objectives. The dashboard automatically compares these targets with actual values and highlights any deviations.
This sheet promotes accountability and transparency across teams by linking performance goals directly to measurable outcomes.

Previous Year Numbers Sheet
The Previous Year (PY) Sheet provides a baseline for year-over-year comparison.
You can enter corresponding figures from the previous year — both MTD and YTD — using the same structure as the current year data.
This comparison helps evaluate progress and supports continuous improvement by showing whether your sports or recreation programs are growing, stagnating, or declining.
KPI Definition Sheet Tab
The KPI Definition Sheet serves as your master reference document.
Here, you define:
- KPI Name
- KPI Group
- Unit
- Formula
- Definition
This tab ensures clarity and consistency across the organization. Every stakeholder understands what each KPI means and how it’s calculated — eliminating confusion during performance reviews or strategy meetings.

How Does the Dashboard Work?
The Sports & Recreation KPI Dashboard in Excel is entirely formula-driven. It uses functions such as SUMIFS, INDEX-MATCH, and dynamic references to automatically update results whenever you change month, data, or targets.
Each KPI card and chart is powered by linked tables and pivot data models. The visuals instantly reflect performance gaps using conditional formatting.
The system design enables non-technical users to analyze large datasets without coding, macros, or add-ins. All you need to do is update your monthly data — the dashboard handles the rest!
Key KPIs You Can Track
The dashboard can track any KPIs relevant to your organization. Common examples include:
Operational KPIs
- Facility Utilization Rate
- Equipment Downtime
- Maintenance Response Time
Financial KPIs
- Total Revenue
- Cost per Member
- Profit Margin
Customer & Member KPIs
- Member Retention Rate
- Average Membership Duration
- Customer Satisfaction Score
Sports Performance KPIs
- Participation Rate
- Coaching Hours Delivered
- Player Improvement Index
These indicators help management evaluate not only financial performance but also the quality and impact of sports and recreation programs.
Advantages of the Sports & Recreation KPI Dashboard in Excel
A well-designed dashboard offers several advantages that make it an indispensable tool for every sports or recreation organization.
- Centralized Performance Tracking
You no longer need multiple files for different metrics. Everything is available in one place.
- Real-Time Insights
Whenever you update data, the visuals and KPIs refresh instantly. You can make decisions faster.
- Easy Customization
You can modify KPIs, colors, and layouts based on your organization’s needs.
- Improved Accountability
Clear visibility of actual vs target data ensures teams remain aligned and responsible for results.
- Enhanced Forecasting
With MTD, YTD, and PY comparisons, it’s easy to predict trends and set future goals realistically.
- Cost-Effective Solution
Unlike costly BI tools, this Excel-based dashboard provides a complete analytics system at minimal cost.
- Data-Driven Culture
Regular monitoring builds a culture of transparency, improvement, and excellence within your organization.
Best Practices for Using the Sports & Recreation KPI Dashboard
To get the best results from your Excel dashboard, follow these expert tips:
Define KPIs Clearly
Ensure every KPI has a clear purpose, formula, and target value. Use the KPI Definition sheet to maintain consistency.
Keep Data Updated
Regularly enter your Actual, Target, and Previous Year numbers to keep reports accurate.
Review Trends Monthly
Analyze MTD and YTD charts to identify issues early. Early intervention helps prevent long-term declines.
Use Conditional Formatting Wisely
Color-coded indicators are powerful, but use them strategically to highlight only key variances.
Back Up Your Data
Create backups before updating any file. It helps avoid data loss and ensures you can track historical changes.
Involve All Stakeholders
Share the dashboard with coaches, managers, and administrators so everyone understands performance status.
Link Targets to Strategy
Set KPI targets aligned with your organization’s annual goals, not arbitrary figures.
Because it’s Excel-based, no complex setup or technical skill is required. Anyone familiar with Excel can start using it within minutes.
Why Choose Excel for Sports & Recreation KPIs?
Although tools like Power BI and Tableau are popular, Excel remains one of the most accessible and versatile options for many organizations.
Here’s why Excel continues to lead:
- Familiar Interface: Most users already know Excel basics, reducing the learning curve.
- High Customization: You can adjust formulas, layouts, and visuals easily.
- Offline Accessibility: Work without internet connectivity.
- Cost Efficiency: No software subscription fees.
- Integration Flexibility: You can link Excel with Power BI or Google Sheets for advanced reporting later.
For small to medium sports and recreation organizations, Excel provides the perfect balance between functionality and simplicity.
How the Dashboard Supports Better Decision-Making
The Sports & Recreation KPI Dashboard turns raw data into insights. Here’s how it helps leadership teams make smarter decisions:
- Identify Underperforming Areas: Quickly detect KPIs falling below targets.
- Allocate Resources Wisely: Understand which departments need attention or investment.
- Improve Member Experience: Use data on retention, satisfaction, and participation to refine programs.
- Enhance Revenue: Track profit margins and event revenues to optimize pricing and offerings.
- Strengthen Strategy: Align decisions with data-backed evidence rather than intuition.
Ultimately, the dashboard empowers leaders to make informed, confident choices that drive results.
How to Get Started
- Download the Sports & Recreation KPI Dashboard in Excel from NextGenTemplates.com.
- Enter your KPI definitions in the KPI Definition sheet.
- Fill in your actuals, targets, and previous year data.
- Use the Summary Page buttons to navigate and explore insights.
- Review monthly performance using the Dashboard and Trend tabs.
Within minutes, you’ll have a fully functional KPI system to monitor performance, boost engagement, and enhance decision-making.
Conclusion
In today’s data-driven world, sports and recreation organizations must go beyond intuition. They need precise, actionable insights to improve performance, enhance experiences, and achieve growth.
The Sports & Recreation KPI Dashboard in Excel is a powerful, easy-to-use solution that brings all your key data together — helping you make faster, smarter, and more strategic decisions.
Whether you manage a local gym, a recreation center, or a multi-sport academy, this dashboard can transform your operations and set a new standard for efficiency.
Frequently Asked Questions (FAQs)
- What is a KPI in sports and recreation management?
A KPI (Key Performance Indicator) is a measurable value that shows how effectively your organization is achieving key objectives. Examples include attendance rate, customer satisfaction, or equipment utilization.
- Can beginners use this Excel dashboard?
Yes, absolutely! The dashboard is designed for users with basic Excel skills. You just enter data — everything else updates automatically.
- How many KPIs can I track in this template?
You can track as many as you like. The structure supports unlimited KPIs, but 10–15 key metrics per category is ideal for clarity.
- Can I modify the layout or KPIs?
Yes. You can edit KPI names, add new charts, or change color schemes as per your organization’s branding.
- Does the dashboard work on Mac and Windows?
Yes, it’s fully compatible with both. All features, including dropdowns and charts, work smoothly on both platforms.
- How often should I update data?
Update MTD and YTD actuals every month. The dashboard will automatically update visuals for accurate performance reporting.
- Can I link this Excel dashboard to Power BI later?
Yes, you can easily connect it to Power BI for advanced analytics, drill-downs, and interactive reporting.
Visit our YouTube channel to learn step-by-step video tutorials
Watch the step-by-step video tutorial:
Click to buy Sports & Recreation KPI Dashboard in Excel