Every startup dreams of scaling fast, achieving profitability, and staying ahead of the competition. But to grow sustainably, you need to track what truly matters — your key performance indicators (KPIs). That’s where the Startup Growth KPI Scorecard in Excel comes in.
This ready-to-use Excel template provides a structured way to measure, analyze, and visualize your startup’s performance. Whether you’re tracking revenue growth, customer acquisition, or operational efficiency, this scorecard gives you everything you need to turn data into decisions.
Click to buy Startup Growth KPI Scorecard in Excel
What Is a Startup Growth KPI Scorecard in Excel?
A Startup Growth KPI Scorecard is a performance-tracking tool that consolidates all critical business metrics into one interactive Excel file. It enables founders, investors, and managers to monitor growth trends, compare actual results against targets, and make data-driven decisions.
Unlike generic reports, this Excel-based scorecard offers dynamic dashboards, dropdown selections, and visual performance indicators. It helps startups track monthly and yearly performance and identify areas for improvement — all without needing complex software.
This tool is perfect for:
- Founders and CEOs who want quick insights into performance.
- Financial analysts monitoring growth and cash flow.
- Marketing or sales teams tracking lead generation and conversions.
- Investors evaluating startup progress and scalability.
Structure of the Startup Growth KPI Scorecard in Excel
To keep the dashboard efficient and user-friendly, the Startup Growth KPI Scorecard includes four core worksheets:
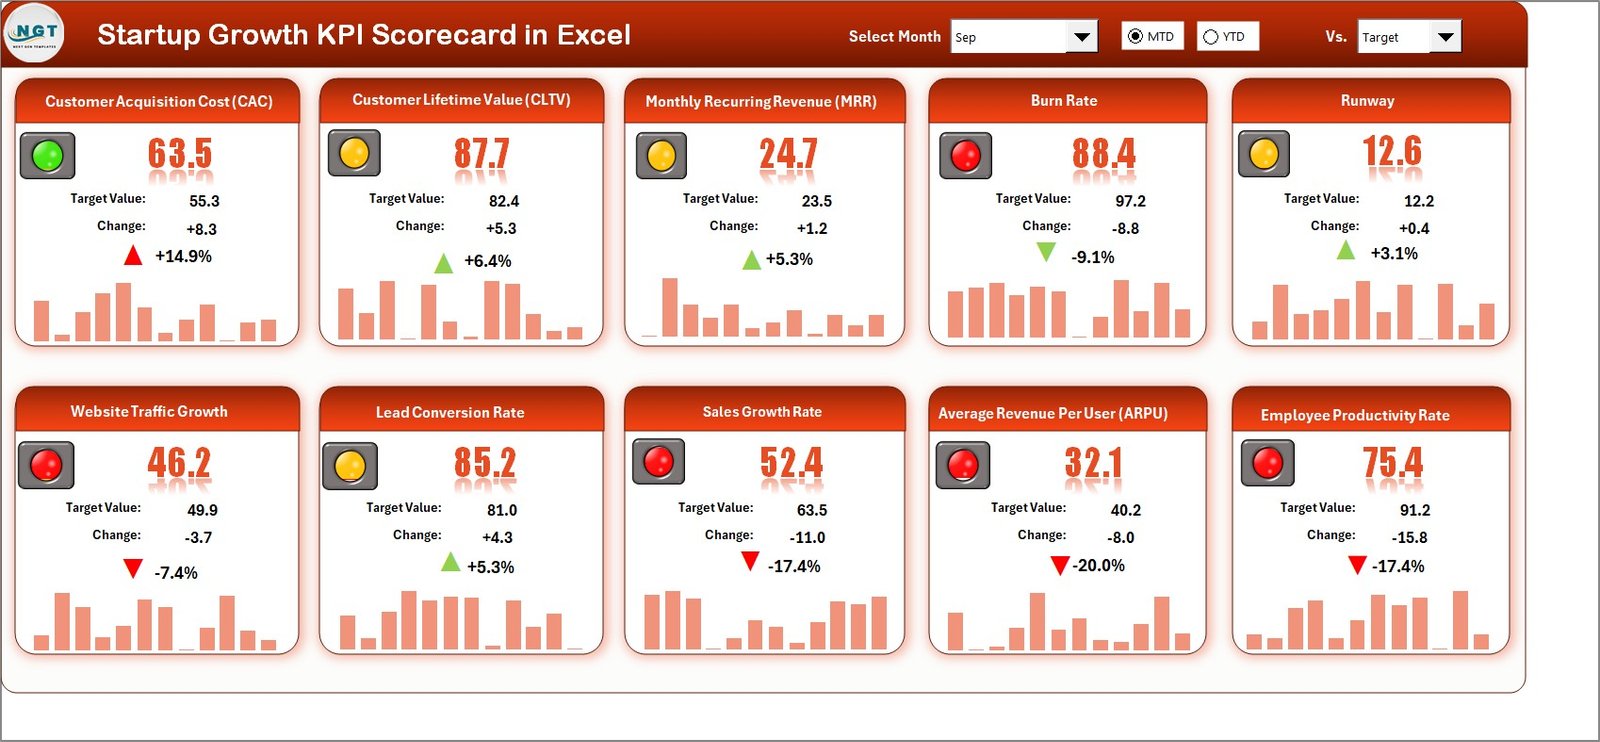
Scorecard Sheet — The Main Dashboard
This is the central interface where you can see how your startup is performing at a glance.
Key Features:
- Dropdown Menus: Select the period (Month, MTD, or YTD) to customize the analysis.
- Actual vs Target Values: Instantly compare actual performance against targets for each KPI.
- Color-Coded Indicators: Quickly identify high-performing or under-performing metrics.
- Comprehensive Overview: View up to 10 KPIs simultaneously with summarized results.
- Interactive Design: Makes performance analysis simple, visual, and actionable.
This sheet acts as the heartbeat of the scorecard — where every metric tells a story of your startup’s growth journey.
Click to buy Startup Growth KPI Scorecard in Excel
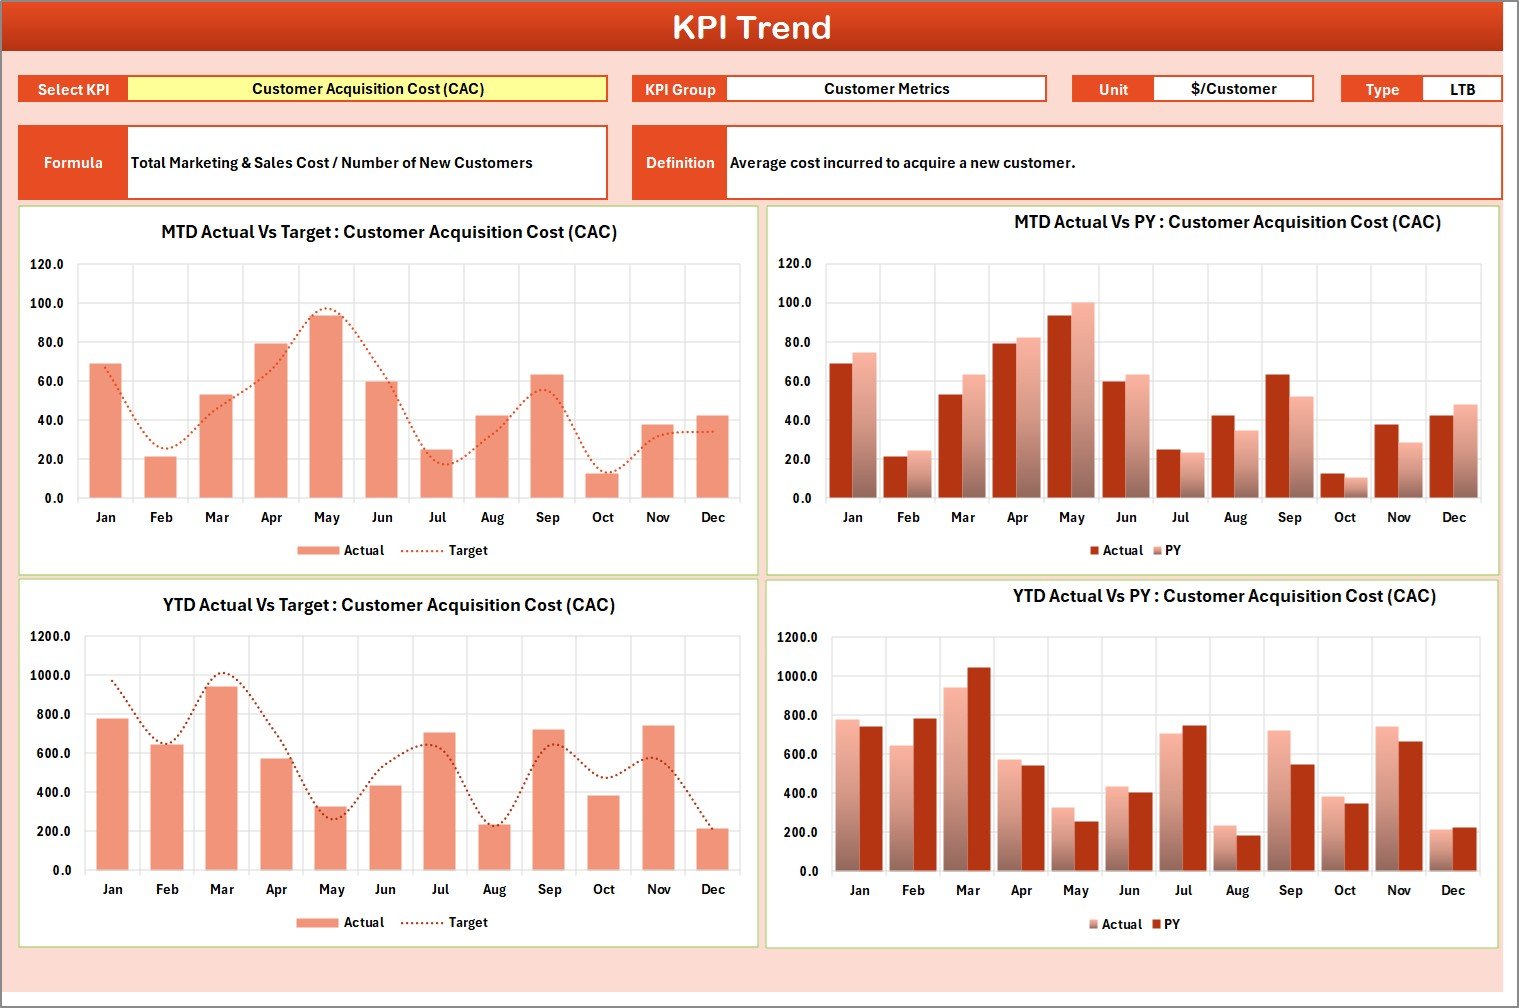
KPI Trend Sheet — Visualizing Performance Over Time
The KPI Trend Sheet lets you analyze progress dynamically.
Highlights:
- Choose any KPI from the dropdown menu (cell C3).
- Instantly view KPI Group, Unit, Type (LTB or UTB), Formula, and Definition.
- Analyze Month-to-Date (MTD) and Year-to-Date (YTD) trends for Actual, Target, and Previous Year (PY) data.
- Interactive trend charts display whether performance is improving or declining.
This sheet helps you spot early warnings, identify seasonal trends, and measure consistency in your startup’s growth metrics.
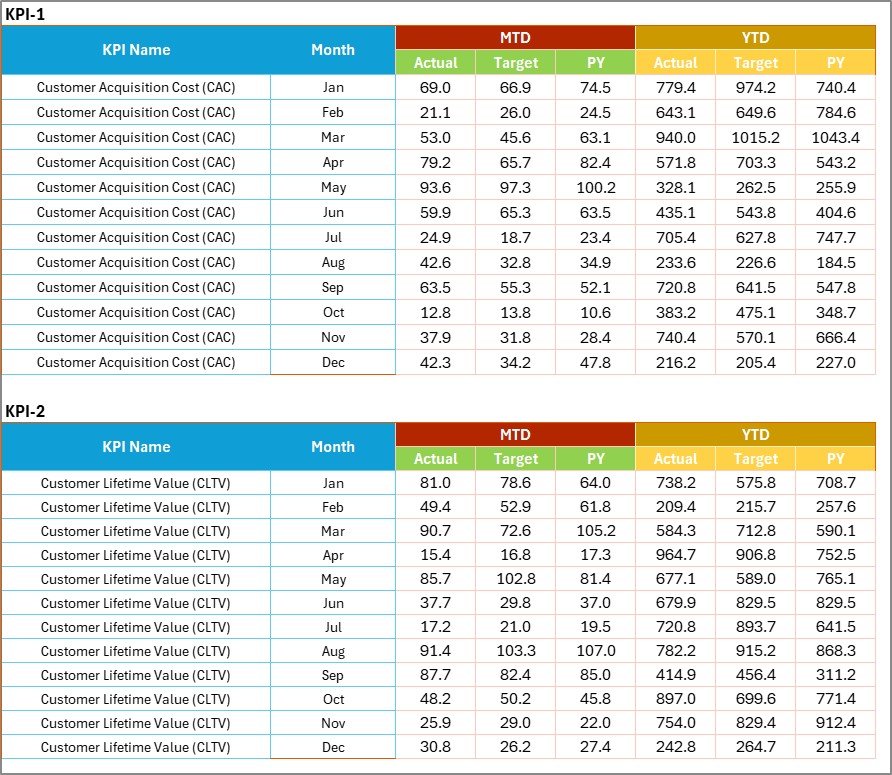
Input Data Sheet — Enter and Update KPI Values
This is where the data entry magic happens.
Features:
- Record actual values, targets, and previous year data for each KPI.
- Flexible structure allows easy updates as new results become available.
- Seamless linkage to other sheets ensures real-time updates in the scorecard and charts.
The Input Sheet ensures that your scorecard always reflects the most current and accurate business data.
KPI Definition Sheet — The Reference for Every Metric
Every KPI in your startup must have a clear meaning and formula. That’s what the KPI Definition Sheet ensures.
Here you can define:
- KPI Name
- KPI Group (e.g., Sales, Finance, Marketing)
- Unit of Measurement
- Formula Used
- KPI Definition
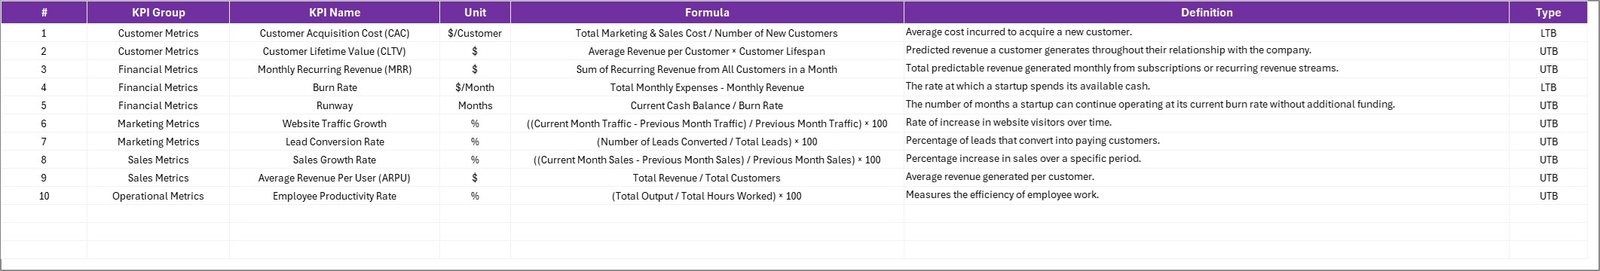
This structured approach keeps everyone aligned — from the finance team to department heads — ensuring there’s no confusion about what each KPI represents or how it’s calculated.
Why Do Startups Need a KPI Scorecard?
Tracking KPIs is not just about numbers — it’s about navigating growth intelligently. A well-designed KPI scorecard empowers startups to:
- Stay Focused on Priorities: Concentrate on metrics that truly matter to business success.
- Make Data-Driven Decisions: Replace gut feelings with real-time insights.
- Boost Transparency: Improve accountability within teams through measurable results.
- Identify Risks Early: Detect performance gaps before they become serious issues.
- Enhance Investor Confidence: Present structured, evidence-based performance reports.
For startups, where every decision counts, this scorecard becomes a growth compass — helping you move from chaos to clarity.
Key Performance Indicators to Include in a Startup Growth Scorecard
Here are some essential KPI categories and examples commonly included in startup scorecards:
- Financial KPIs
- Revenue Growth %
- Gross Profit Margin %
- Operating Cash Flow
- Burn Rate
- Customer Lifetime Value (CLV)
- Return on Investment (ROI)
- Customer & Market KPIs
- Customer Acquisition Cost (CAC)
- Customer Retention Rate %
- Monthly Active Users (MAU)
- Net Promoter Score (NPS)
- Marketing KPIs
- Lead Conversion Rate %
- Website Traffic Growth %
- Cost Per Lead (CPL)
- Campaign ROI
- Operational KPIs
- On-Time Delivery %
- Employee Productivity Index
- Project Completion Rate %
- Average Response Time
- Team & Culture KPIs
- Employee Satisfaction Score
- Training Hours per Employee
- Attrition Rate %
- Innovation Index
These KPIs collectively help you evaluate your startup’s financial health, customer experience, marketing impact, operational performance, and team culture.
Advantages of Using a Startup Growth KPI Scorecard in Excel
The Startup Growth KPI Scorecard is not just a reporting tool — it’s a performance transformation system.
Here are the top advantages:
Simplifies Complex Data
Instead of managing multiple reports, the scorecard consolidates all metrics into one visual dashboard.
Enables Quick Decision-Making
Color indicators and trend charts make it easy to spot deviations and act fast.
Prootes Accountability
Each department can view its targets versus actuals, promoting ownership and responsibility.
Fully Customizable
You can modify KPIs, add new categories, or adjust formulas as your business grows.
Zero Coding Needed
No complex setup — just plug in your data and let Excel handle the rest.
Boosts Investor Reporting
Present structured and visually clear insights during investor updates or board meetings.
How to Use the Startup Growth KPI Scorecard Effectively
To get the most from your scorecard, follow these steps:
- Define Your KPIs Clearly: Use the KPI Definition Sheet to create measurable and realistic indicators.
- Set Monthly and Yearly Targets: Align targets with your growth strategy and financial forecasts.
- Regularly Update Input Data: Keep the Input Sheet current with real-time results.
- Analyze Trends Weekly: Use the KPI Trend Sheet to track changes and adapt strategies quickly.
- Review Performance Meetings: Discuss insights and actions during weekly or monthly reviews.
This simple process ensures that your scorecard becomes a living tool — always relevant and insightful.
The dashboard instantly highlights the revenue gap and celebrates retention success. This visibility encourages teams to focus efforts where improvement is needed most.
Integration Possibilities
The Excel-based KPI Scorecard can easily integrate with:
- Power BI for advanced data visualization.
- Google Sheets for cloud collaboration.
- Accounting or CRM systems for automated updates.
This flexibility ensures that startups can grow their analytics as they scale.
Best Practices for the Startup Growth KPI Scorecard
To ensure your scorecard delivers maximum impact, follow these best practices:
Keep KPIs Actionable
Track metrics that drive decisions — not vanity numbers.
Use Consistent Timeframes
Always analyze KPIs using consistent monthly or quarterly periods.
Leverage Conditional Formatting
Highlight positive and negative performance with color codes and icons for quick understanding.
Update Regularly
Refresh your data weekly or monthly to maintain accuracy.
Align KPIs with Business Goals
Every KPI must link directly to your startup’s strategic objectives — such as revenue, customer base, or efficiency.
Encourage Cross-Department Collaboration
Share mmon Challenges Startups Face While Tracking KPIs
Even with powerful tools, startups often make mistakes while tracking performance. Here are some pitfalls to avoid:
- Tracking Too Many KPIs: Focus on the 10-15 metrics that truly impact growth.
- Ignoring Data Quality: Inconsistent or inaccurate data can mislead decisions.
- Setting Unrealistic Targets: Goals should be challenging yet achievable.
- Not Reviewing Regularly: KPI tracking loses meaning without periodic analysis.
- Lack of Accountability: Assign clear ownership for each metric.
By avoiding these mistakes, your startup can maximize the benefits of KPI-based tracking.
Who Can Benefit from the Startup Growth KPI Scorecard?
This Excel scorecard suits a wide range of professionals:
- Startup Founders: Get real-time visibility into performance.
- Operations Managers: Monitor team efficiency and process improvement.
- Investors: Evaluate startup performance through clear visuals.
- Marketing & Sales Teams: Track campaign effectiveness and lead conversions.
- HR Leaders: Measure workforce productivity and engagement.
Regardless of your industry — SaaS, FinTech, E-commerce, or Manufacturing — the scorecard adapts seamlessly to your business model.
How This Scorecard Supports Strategic Decision-Making
By connecting KPIs to goals, startups can:
- Identify growth bottlenecks.
- Optimize marketing spend.
- Improve retention and reduce churn.
- Forecast revenue with higher accuracy.
- Build confidence in scaling decisions.
This turns your Excel file into a strategy enabler, not just a spreadsheet.
Conclusion
The Startup Growth KPI Scorecard in Excel is more than a reporting tool — it’s your startup’s performance engine. It helps you measure what matters, monitor growth consistently, and take smarter actions every month.
By adopting this structured scorecard, your startup gains:
- A clear vision of success metrics.
- Real-time performance tracking.
- Improved communication across teams.
- Data-backed confidence for investors and leadership.
Start using this ready-to-use scorecard today and take control of your growth journey with clarity, consistency, and confidence.
Frequently Asked Questions (FAQs)
- What is a Startup Growth KPI Scorecard?
It’s an Excel-based tool that helps startups track and analyze key performance indicators (KPIs) related to growth, revenue, marketing, and operations.
- How many KPIs can I track in this scorecard?
You can view up to 10 KPIs at once, but the template allows customization to include more as needed.
- Can I modify the KPIs?
Yes, the scorecard is fully editable. You can change KPI names, formulas, and target thresholds.
- Does it require advanced Excel knowledge?
Not at all. It’s designed for ease of use — you only need basic Excel skills like data entry and dropdown selection.
- Can I link it with other tools like Power BI or Google Sheets?
Yes, you can integrate it easily for automated data visualization and team collaboration.
- How often should I update the data?
For best results, update your KPI data monthly or weekly to ensure accurate tracking.
- Is this template suitable for investors’ presentations?
Absolutely. It provides visually appealing charts and summary metrics that are ideal for investor or board reporting.
- What industries can use this KPI Scorecard?
Any startup — from SaaS, Healthcare, and FinTech to E-commerce and Manufacturing — can benefit from it.
- Can I add my company branding to the scorecard?
Yes, you can personalize the Excel template with your logo and color scheme to match your brand identity.
- Where can I download it?
You can get the ready-to-use Startup Growth KPI Scorecard in Excel from NextGenTemplates.com.
Visit our YouTube channel to learn step-by-step video tutorials
Watch the step-by-step video tutorial:
Click to buy Startup Growth KPI Scorecard in Excel