Stock exchanges move fast. Prices change every second, trading activity goes up and down, and investor behavior never stays the same. Because markets shift quickly, stock exchange teams must track every important metric with speed and clarity. A Stock Exchanges KPI Dashboard in Excel helps teams do that with ease. It brings all essential indicators into one simple and interactive view so analysts, regulators, and decision-makers can monitor performance without confusion.
In this detailed guide, you will learn everything about this dashboard—how it works, why it matters, which KPIs you must track, and how you can build and use it inside Excel. You will also discover key features, advantages, best practices, and clear answers to common questions related to stock exchange reporting.\
Click to buy Stock Exchanges KPI Dashboard in Excel
What Is a Stock Exchanges KPI Dashboard in Excel?
A Stock Exchanges KPI Dashboard in Excel is a structured reporting tool that displays real-time or periodic performance data for stock markets. It allows you to track trading volume, liquidity, market capitalization, settlement timings, compliance status, and many other KPIs in a simple visual format. Because Excel provides flexibility, you can update data monthly or daily, compare trends, monitor targets, and gain insights without using complex tools.
This dashboard helps stock exchanges:
- Track market performance over time
- Monitor financial stability
- Evaluate investor participation
- Measure efficiency and speed
- Improve compliance and governance
- Understand trading behavior
- Detect unusual activity
Since the dashboard displays MTD (Month-to-Date) and YTD (Year-to-Date) numbers, you can make quick decisions with confidence. Moreover, Excel’s formatting, formulas, conditional highlights, and charts help you transform raw numbers into meaningful insights.
Why Do Stock Exchanges Need a KPI Dashboard?
Stock exchanges handle millions of trades every single day, and even a small delay in settlement, data reporting, or decision-making can cause major issues. Therefore, speed and accuracy matter. A KPI dashboard ensures that stakeholders get a clear picture of what is working and what needs improvement.
You need this dashboard because:
- The stock market creates massive amounts of data.
- Stakeholders require quick access to accurate insights.
- Regulators expect transparent reporting.
- Investors want smooth trade execution and efficient processes.
- Exchanges need to measure performance against targets.
Since Excel offers automation, dropdowns, and dynamic visuals, the dashboard becomes a reliable source for continuous monitoring.
Key Features of the Stock Exchanges KPI Dashboard in Excel
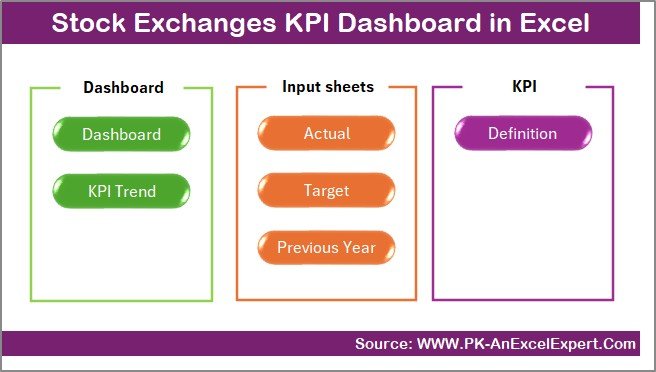
This dashboard includes 7 powerful worksheets, each designed to make tracking easier. Although the structure is simple, the insights it provides are extremely valuable.
Summary Page
The Summary Page acts as the index page. It includes navigation buttons so users can jump to different worksheets instantly. This makes the dashboard simple to use even for beginners.
You can click any button to move to:
- Dashboard
- Trend
- Actual Numbers Input
- Target Input
- Previous Year Numbers
- KPI Definition
This improves workflow because users don’t have to search through multiple tabs.
Click to buy Stock Exchanges KPI Dashboard in Excel
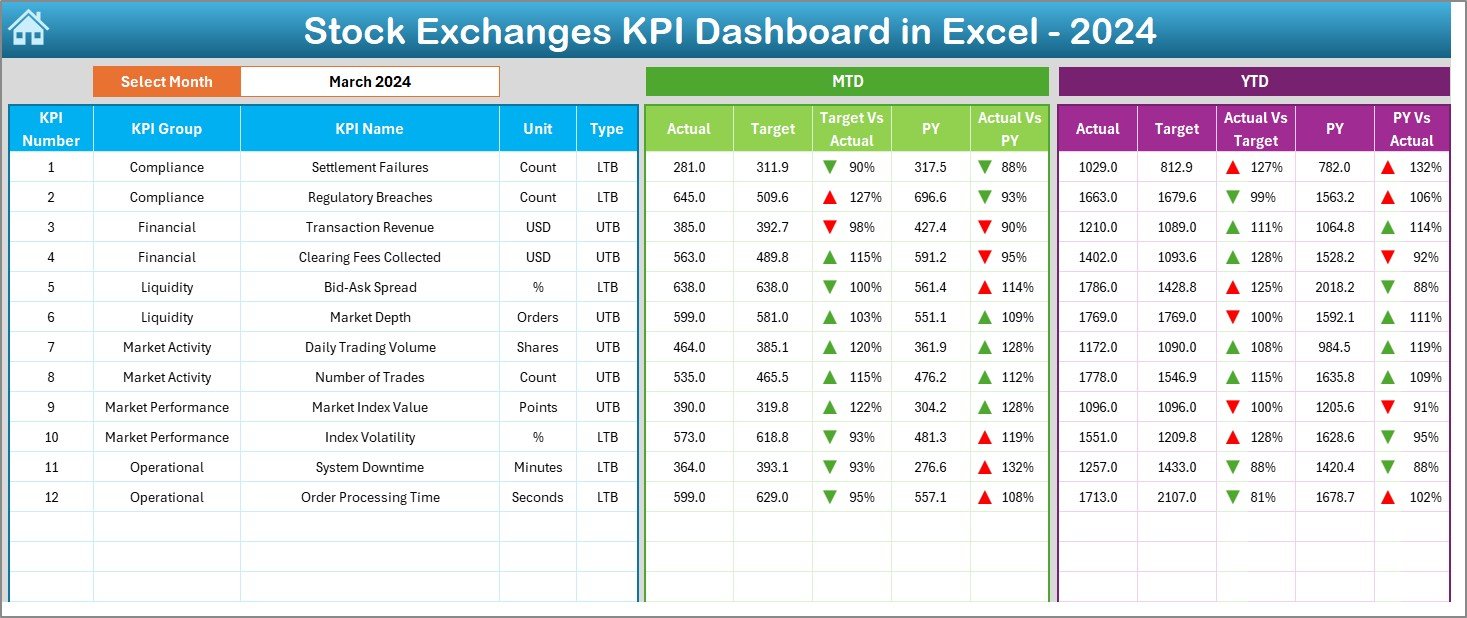
Dashboard Sheet Tab
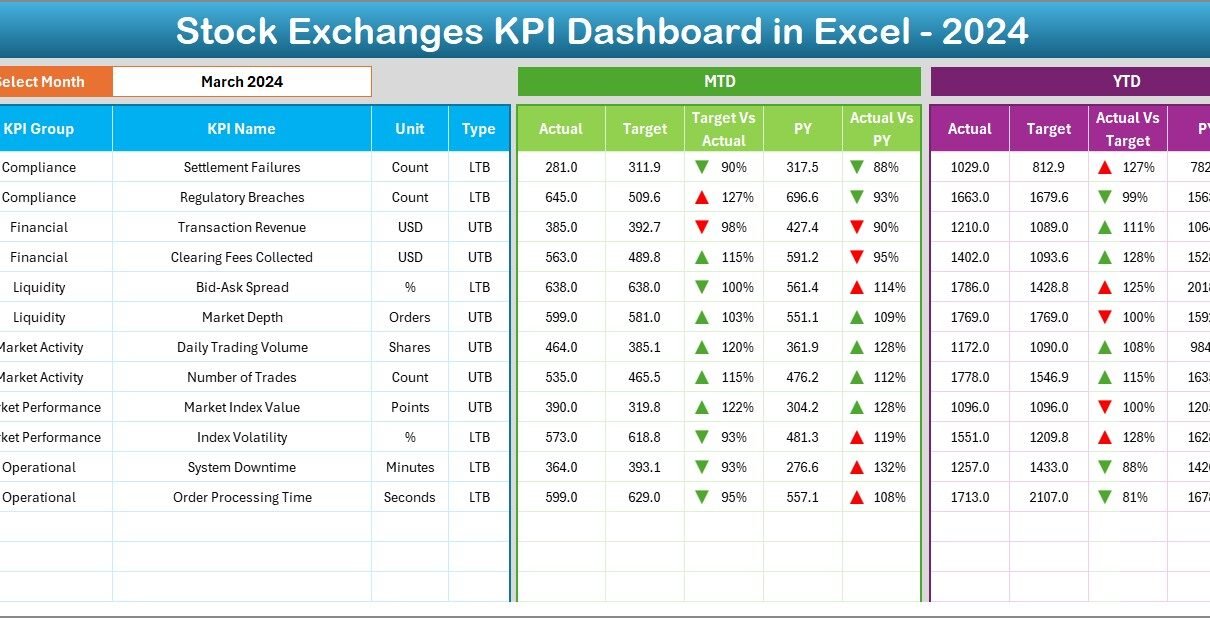
The Dashboard sheet displays all KPIs in one place. It allows you to select the month from a dropdown menu (located at cell D3), and the entire dashboard updates automatically. This saves time and improves accuracy.
On this sheet, you can monitor:
- MTD Actual vs Target
- MTD Actual vs Previous Year
- YTD Actual vs Target
- YTD Actual vs Previous Year
Excel automatically highlights positive and negative performance using up and down arrows, making interpretation easier.
This section helps stock exchange teams quickly understand whether they are meeting trading goals, maintaining liquidity, and handling settlements efficiently.
Click to buy Stock Exchanges KPI Dashboard in Excel
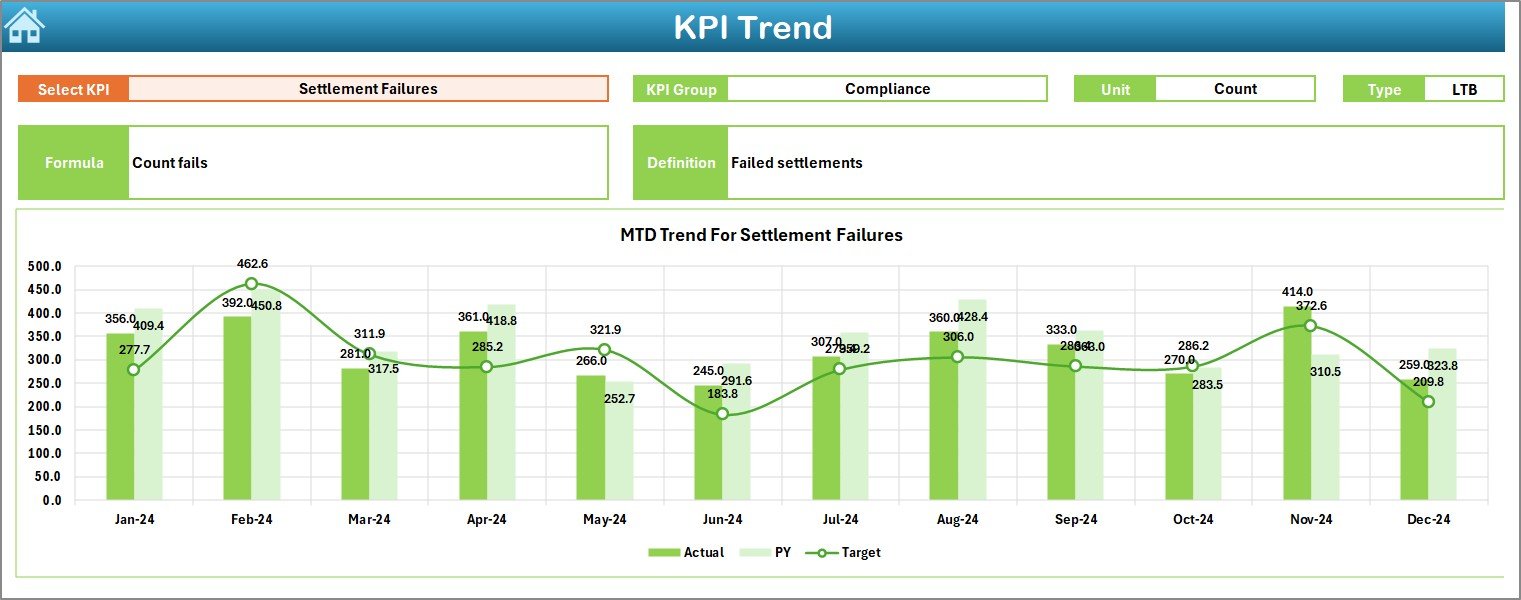
Trend Sheet Tab
The Trend sheet allows users to analyze the monthly and yearly trends for each KPI. You can select a KPI from the dropdown menu available at cell C3.
This sheet displays:
- KPI Group
- KPI Unit
- KPI Type (Upper the Better / Lower the Better)
- KPI Formula
- KPI Definition
- Monthly MTD Trends
- Monthly YTD Trends
The dashboard compares Actual, Target, and Previous Year values using a trend chart. This helps users understand movement over time and identify patterns.
Click to buy Stock Exchanges KPI Dashboard in Excel
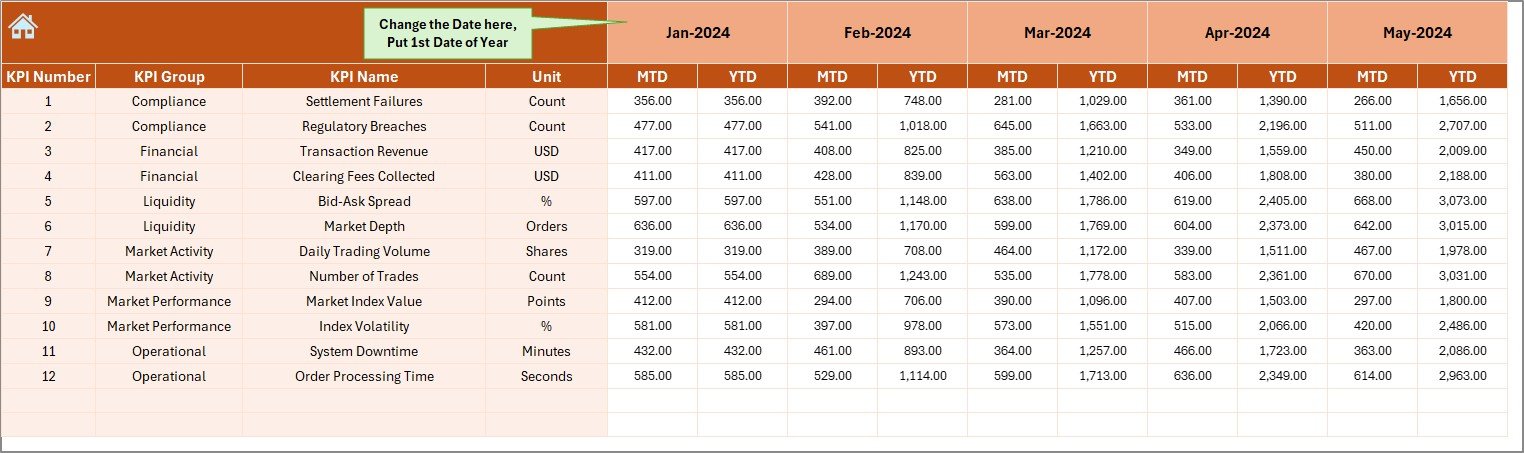
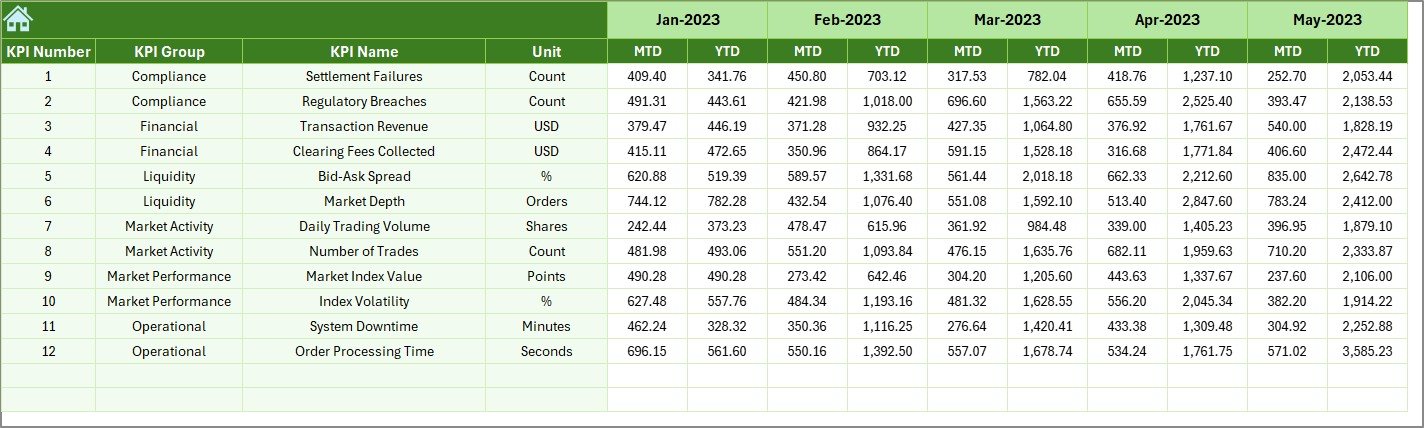
Actual Numbers Input Sheet
This sheet allows you to enter actual MTD and YTD values for each KPI. You can set the first month of the year in cell E1. Once you update actual numbers, the full dashboard reflects those changes automatically.
This sheet improves accuracy because the entire process becomes systematic and structured.
Click to buy Stock Exchanges KPI Dashboard in Excel
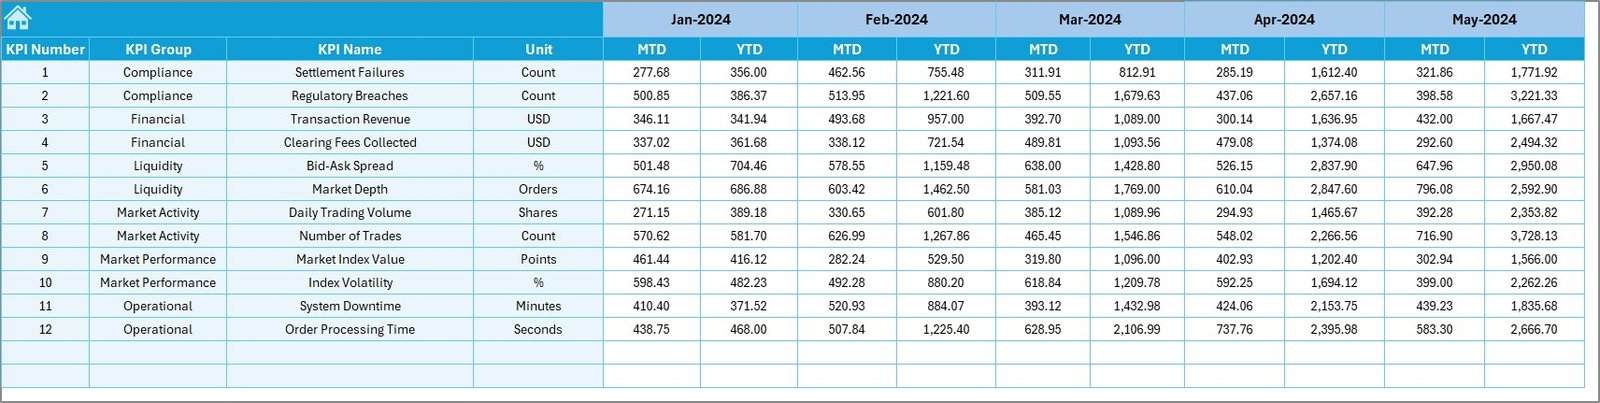
Target Sheet Tab
Every KPI needs a target. On this sheet, you can enter:
- Monthly MTD Targets
- Monthly YTD Targets
Targets help stock exchanges measure progress and understand whether performance is improving or declining.
Click to buy Stock Exchanges KPI Dashboard in Excel
Previous Year Numbers Sheet Tab
This is where you enter all previous year values for each KPI. The dashboard uses this data for comparisons and performance evaluations.
This page helps you perform year-on-year analysis.
Click to buy Stock Exchanges KPI Dashboard in Excel
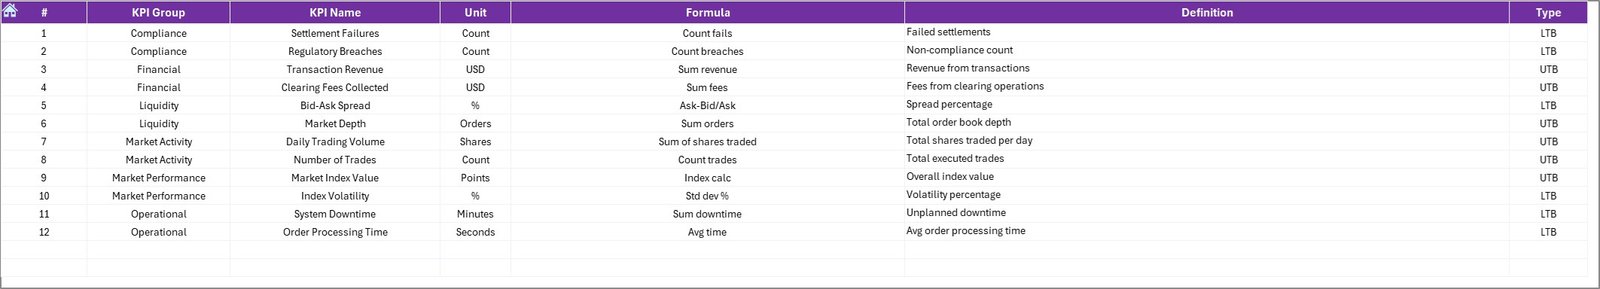
KPI Definition Sheet Tab
This sheet contains complete details of each KPI, including:
- KPI Name
- KPI Group
- KPI Unit
- KPI Type
- KPI Formula
- KPI Definition
This ensures consistency, transparency, and accuracy while updating or reviewing KPIs.
Most Important KPIs to Track in Stock Exchanges
You must monitor the right KPIs to understand market performance. Below is a well-structured list of essential indicators used worldwide.
Trading Activity KPIs
- Total Number of Trades
Tracks how many trades executed during a period. It reflects market activity and investor participation.
- Trading Volume
Measures the total number of shares traded. High volume indicates a healthy and active market.
- Market Capitalization
Shows the total value of all listed securities. It helps assess the size and strength of the market.
Liquidity & Efficiency KPIs
- Bid-Ask Spread
Measures the difference between buying and selling prices. A lower spread suggests a more efficient and liquid market.
- Order Execution Time
Calculates how quickly orders get executed. A faster system improves investor satisfaction.
- Liquidity Ratio
Evaluates the ease of entering or exiting a trade without affecting the price.
Compliance & Governance KPIs
- Listing Compliance Rate
Shows the percentage of companies meeting exchange listing requirements.
- Regulatory Breach Incidents
Tracks non-compliance cases. Lower incidents indicate strong governance.
Financial KPIs
- Transaction Fee Revenue
Highlights income generated from trade-related charges.
- Clearing & Settlement Efficiency
Monitors how quickly and accurately settlements happen.
Technology & Reliability KPIs
- System Downtime
Tracks how long trading systems remain unavailable. Lower downtime means better reliability.
- Technical Error Rate
Measures frequency of errors in order processing or data update.
These KPIs help exchanges maintain transparency, monitor risk, and improve investor confidence.
How to Use the Stock Exchanges KPI Dashboard Effectively
To get the best out of your dashboard, follow these steps:
- Enter monthly actual data in the Actual Numbers Input sheet.
- Update targets at the beginning of the year.
- Enter previous year figures for comparison.
- Use the month selector on the Dashboard sheet to switch periods.
- Use the Trend sheet to study long-term performance.
- Update the KPI Definition sheet whenever you add new metrics.
This routine ensures accuracy and supports long-term decision-making.
Advantages of Using a Stock Exchanges KPI Dashboard in Excel
A Stock Exchanges KPI Dashboard provides many benefits. Because it simplifies complex information, teams can focus on decision-making rather than data searching.
Here are the major advantages:
- Clear and Real-Time Insights
The dashboard updates instantly when you change any value. This gives you quick information whenever you need it.
Easy Comparison with Targets
The dashboard shows whether you meet your MTD and YTD targets. You also see how numbers compare with the previous year.
Trend Visibility
You can easily monitor monthly and yearly trends. Because you can visualize trends, you understand what needs your attention.
Better Transparency
Since the dashboard displays formulas, definitions, and units, everyone uses the same standards and there is no confusion.
Customization and Flexibility
Excel offers unmatched flexibility. You can add KPIs, change layouts, update charts, or modify formulas without depending on external tools.
Improved Efficiency
Teams save time because the dashboard reduces manual work. Automated charts and formatting make it easier to analyze data.
Best Practices for the Stock Exchanges KPI Dashboard in Excel
To create a reliable and long-lasting dashboard, follow these best practices:
Use Clear KPI Definitions
Always define each KPI clearly. This ensures consistency when different users update data.
Maintain Clean Data Inputs
Keep the input sheets simple and organized. Avoid mixing formulas and manual entries in the same cells.
Use Dropdowns for Accuracy
Dropdowns prevent typing errors and ensure standardized entries.
Highlight Performance Comparisons
Use conditional formatting to show positive or negative performance. Arrows, icons, and color coding improve clarity.
Update Data Regularly
Make sure actual numbers, targets, and previous year data stay updated. This keeps your dashboard accurate.
Protect Critical Cells
Lock formulas, charts, and structures to avoid accidental edits.
Keep the File Light
Avoid unnecessary images or heavy formatting. This ensures the dashboard runs smoothly.
Conclusion
A Stock Exchanges KPI Dashboard in Excel brings structure, clarity, and speed to market monitoring. Because it shows MTD, YTD, targets, and previous year comparisons in one place, it becomes a powerful analysis tool for exchanges, brokers, and regulators. The dashboard simplifies decisions, improves transparency, and helps teams understand trends with accuracy. With automated charts, slicers, dropdowns, and definitions, you can track performance with confidence and stay ahead in a fast-moving market.
By following best practices, updating your data regularly, and tracking the right KPIs, you can transform Excel into a professional monitoring tool that meets global reporting standards.
Frequently Asked Questions (FAQs)
- What is a Stock Exchanges KPI Dashboard?
It is an Excel-based tool that helps you track market-related KPIs like trading volume, market capitalization, execution time, and settlement efficiency.
- Who should use this dashboard?
Market analysts, stock exchange officials, regulators, brokers, and financial researchers can use this dashboard to monitor performance.
- Can I customize the KPIs?
Yes, Excel gives full control. You can add, remove, or modify KPIs based on your needs.
- How often should I update the dashboard?
Update MTD and YTD numbers every month. If you track daily trades, you can update it more frequently.
- Does the dashboard support charts and visuals?
Yes. It includes trend charts, comparison visuals, conditional formatting, and automated icons.
- Do I need advanced Excel skills to use it?
Not at all. Basic Excel knowledge is enough because the dashboard uses simple dropdowns and formulas.
Visit our YouTube channel to learn step-by-step video tutorials
Watch the step-by-step video tutorial:
Click to buy Stock Exchanges KPI Dashboard in Excel