Managing supplier risk is an essential part of maintaining a smooth supply chain, ensuring compliance, and minimizing potential disruptions. The Supplier Risk Dashboard in Excel is a powerful tool designed to help businesses monitor and analyze the risks associated with their suppliers. By tracking key metrics such as risk scores, delivery performance, compliance status, and financial exposure, this dashboard allows businesses to make data-driven decisions to optimize supplier management and mitigate risks.
In this article, we will walk you through the features of the Supplier Risk Dashboard in Excel and explain how it can help businesses manage supplier risks, ensure compliance, and track performance effectively.
What is the Supplier Risk Dashboard in Excel?
The Supplier Risk Dashboard in Excel is a ready-to-use tool that provides a comprehensive overview of supplier performance and risk factors. The dashboard consolidates essential metrics into easy-to-understand cards and charts, allowing businesses to track and assess supplier risk in real time. This tool helps businesses identify potential risks related to suppliers, such as delivery issues, non-compliance, and financial exposure, enabling proactive management.
The dashboard consists of multiple sheets, each focusing on different aspects of supplier risk and performance:
Key Features of the Supplier Risk Dashboard
Click to buy Supplier Risk Dashboard In Excel
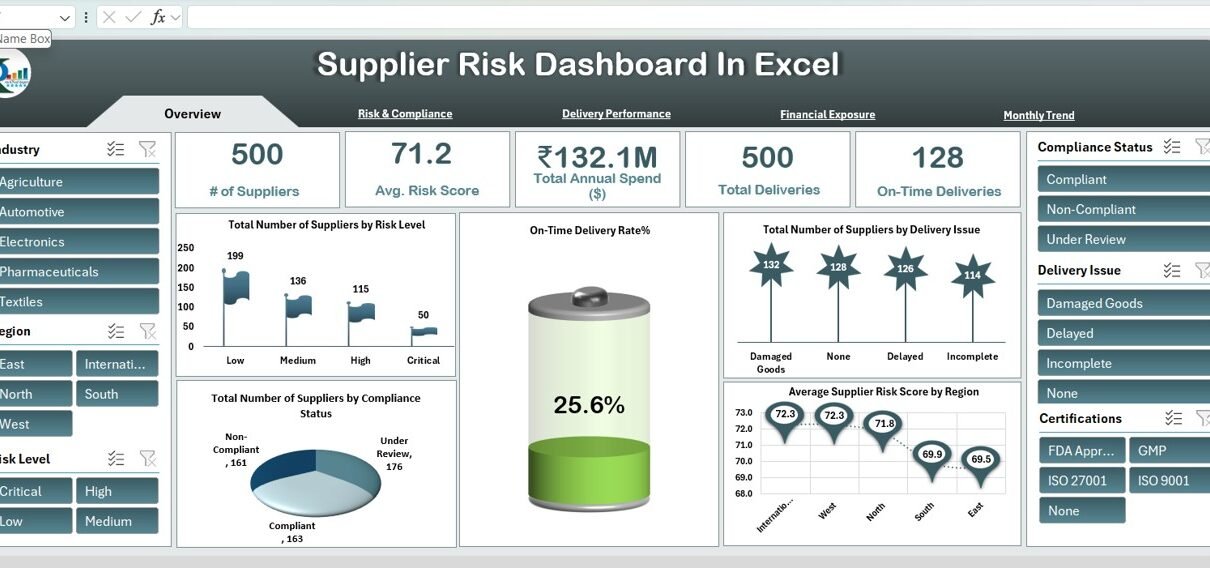
1) Overview Sheet Tab: High-Level Supplier Metrics
The Overview Sheet provides an overview of key supplier metrics through cards and charts. This sheet includes the following elements:
Cards:
- # of Suppliers: Displays the total number of suppliers tracked in the system.
- Avg. Risk Score: Shows the average risk score for all suppliers.
- Total Annual Spend ($): Displays the total amount spent annually on suppliers.
- Total Deliveries: Shows the total number of deliveries made by suppliers.
- On-Time Deliveries: Tracks the number of deliveries made on time.
Charts:
- Total Number of Suppliers by Risk Level: A chart showing suppliers categorized by their risk level (e.g., low, medium, high).
- On-Time Delivery Rate%: Displays the percentage of on-time deliveries for all suppliers.
- Total Number of Suppliers by Delivery Issue: Tracks the number of suppliers with delivery issues.
- Average Supplier Risk Score by Region: Displays the average risk score for suppliers based on their region (e.g., North America, Europe).
- Total Number of Suppliers by Compliance Status: Shows the number of suppliers categorized by their compliance status (e.g., compliant, non-compliant).
These charts and cards provide an at-a-glance view of key supplier performance and risk metrics, making it easier to monitor and assess supplier risk across your supply chain.

Click to buy Supplier Risk Dashboard In Excel
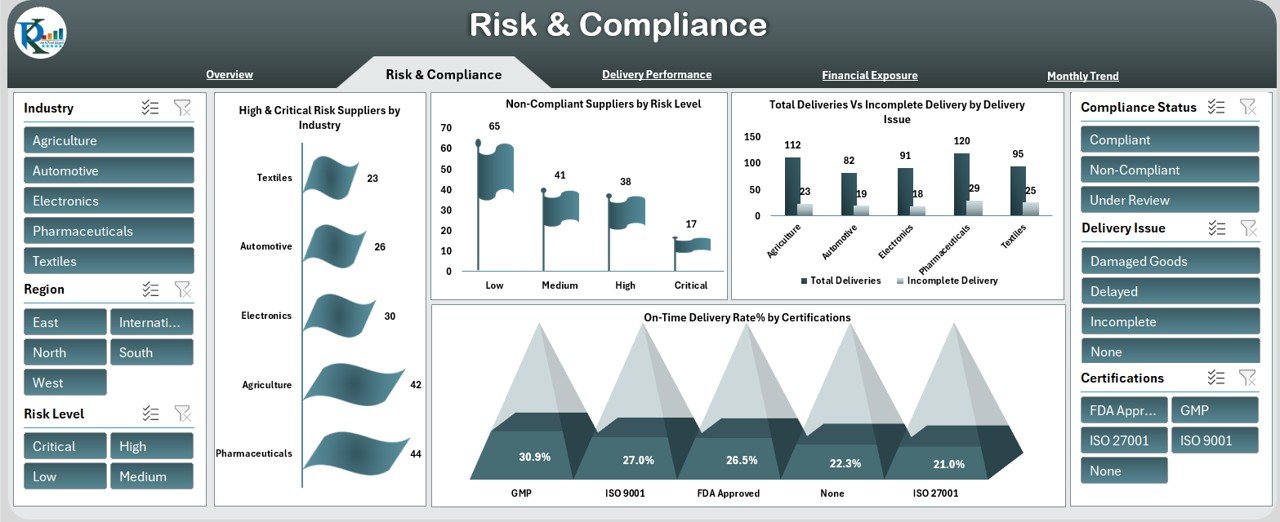
2) Risk & Compliance Sheet Tab: Monitor Risk and Compliance
The Risk & Compliance Sheet focuses on tracking supplier risks and compliance statuses. Key charts include:
-
High & Critical Risk Suppliers by Industry: Displays the number of suppliers with high and critical risk levels, broken down by industry (e.g., manufacturing, logistics, IT).
-
Non-Compliant Suppliers by Risk Level: Tracks the number of non-compliant suppliers categorized by their risk level.
-
Total Deliveries Vs Incomplete Delivery by Delivery Issue: Compares total deliveries with incomplete deliveries, based on delivery issues.
-
On-Time Delivery Rate% by Certifications: Shows the on-time delivery rate for suppliers based on their certifications (e.g., ISO-certified, quality certifications).
This page helps businesses track the compliance status of their suppliers and assess the risks associated with non-compliance, enabling better decision-making.
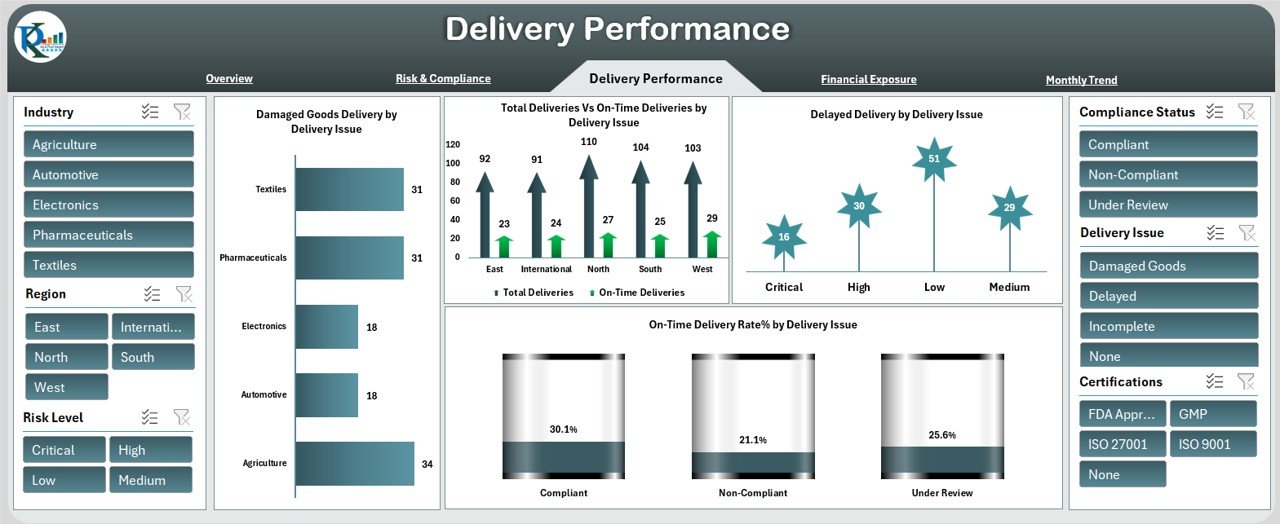
3) Delivery Performance Sheet Tab: Track Supplier Delivery Metrics
The Delivery Performance Sheet focuses on the performance of suppliers in terms of deliveries. Key charts include:
-
Damaged Goods Delivery by Delivery Issue: Tracks the number of deliveries with damaged goods categorized by delivery issue.
-
Total Deliveries Vs On-Time Deliveries by Delivery Issue: Compares the total number of deliveries with the number of on-time deliveries, categorized by delivery issue.
-
Delayed Delivery by Delivery Issue: Displays the number of deliveries that were delayed, broken down by delivery issue.
-
On-Time Delivery Rate% by Delivery Issue: Shows the on-time delivery rate for each type of delivery issue (e.g., late shipment, damaged goods).
This sheet helps businesses monitor the reliability and efficiency of their suppliers in meeting delivery expectations, providing insights into areas that need improvement.
Click to buy Supplier Risk Dashboard In Excel
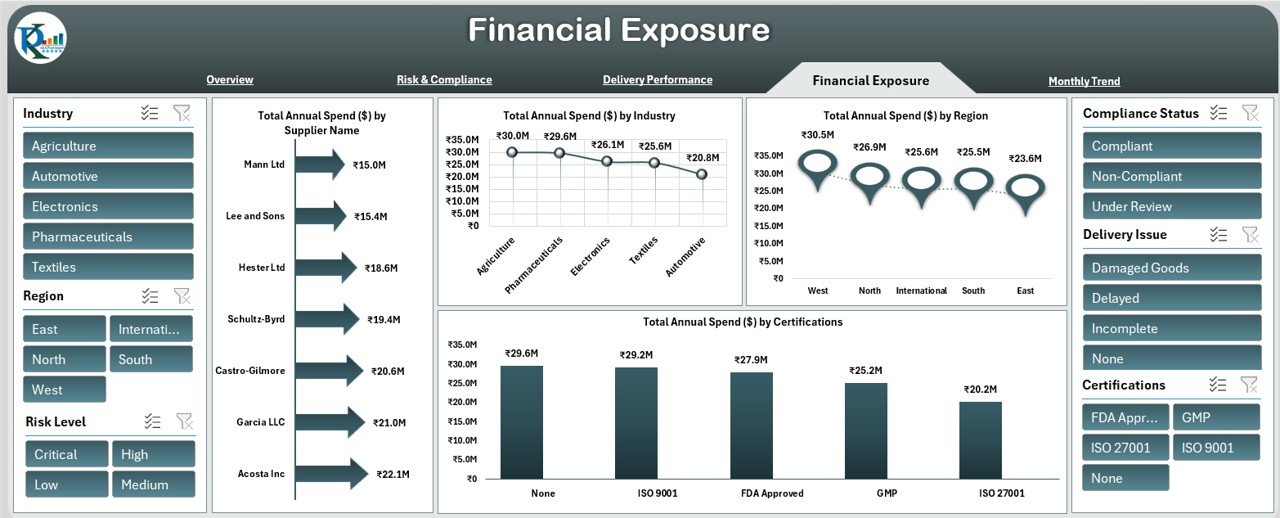
4) Financial Exposure Sheet Tab: Assess Supplier Spend and Financial Risks
The Financial Exposure Sheet helps track the financial exposure and spend across suppliers. Key charts include:
-
Total Annual Spend ($) by Supplier Name: Displays the total annual spend for each supplier.
-
Total Annual Spend ($) by Industry: Tracks total annual spend across different supplier industries (e.g., manufacturing, logistics, IT).
-
Total Annual Spend ($) by Region: Displays the total spend for each region.
-
Total Annual Spend ($) by Certifications: Tracks total spend by supplier certifications.
This page helps businesses assess financial exposure and identify suppliers with high financial impact, enabling more effective budgeting and risk management.
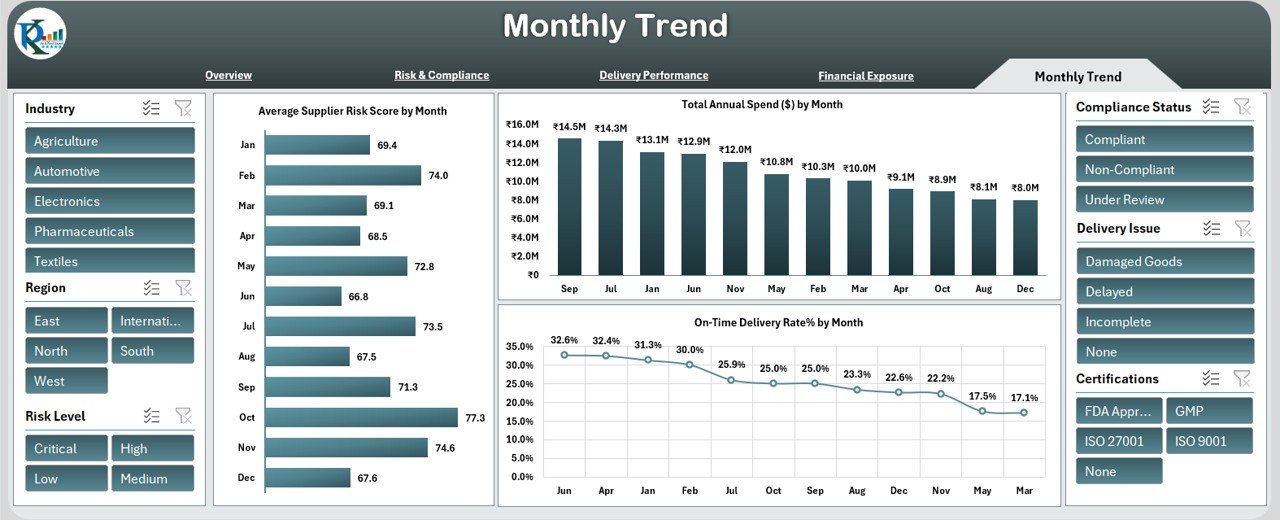
5) Monthly Trend Sheet Tab: Analyze Trends Over Time
The Monthly Trend Sheet allows you to track and analyze supplier performance trends over time. Key charts include:
-
Average Supplier Risk Score by Month: Displays the trend of average supplier risk scores over multiple months, helping you track improvements or deteriorations in supplier risk.
-
Total Annual Spend ($) by Month: Shows the total annual spend by month, helping you identify spending trends.
-
On-Time Delivery Rate% by Month: Tracks the on-time delivery rate over time, helping you assess improvements or declines in delivery performance.
This sheet is ideal for identifying trends in supplier performance, enabling businesses to take proactive actions to manage risks and optimize supplier relationships.
Click to buy Supplier Risk Dashboard In Excel
6) Data Sheet Tab: Input and Manage Raw Data
The Data Sheet is where all supplier data is entered and managed. Key columns include:
Benefits of Using the Supplier Risk Dashboard
The Supplier Risk Dashboard offers several benefits that can help businesses manage and mitigate supplier risks effectively:
-
Centralized Data: All supplier data, including risk scores, delivery performance, and financial exposure, is captured in one place, making it easy to track and manage.
-
Visual Insights: The charts and graphs provide visual insights into supplier performance, allowing for quicker decision-making and improved risk management.
-
Real-Time Monitoring: The dashboard updates in real-time, ensuring that businesses always have access to the most current data on supplier performance.
-
Financial and Risk Management: By tracking financial exposure and assessing risk levels, businesses can make more informed decisions about supplier relationships.
-
Customizable: The dashboard is customizable, allowing businesses to adjust the metrics and charts based on their specific needs.
Best Practices for Using theSupplier Risk Dashboard
Click to buy Supplier Risk Dashboard In Excel
To get the most out of the Supplier Risk Dashboard, follow these best practices:
- Update Data Regularly: Ensure that the Data Sheet is regularly updated with the latest supplier information, including risk scores, delivery data, and spend figures.
- Monitor Risk Levels: Use the Risk & Compliance and Delivery Performance sheets to track high-risk suppliers and address issues promptly.
- Track Financial Exposure: Review the Financial Exposure sheet regularly to monitor high spend areas and manage financial risks effectively.
- Analyze Trends Over Time: Use the Monthly Trend Sheet to track supplier performance and identify potential risks or improvements.
- Collaborate with Your Team: Share the dashboard with your procurement, compliance, and risk management teams to ensure everyone is aligned on supplier performance.
Conclusion
The Supplier Risk Dashboard in Excel is an essential tool for businesses looking to manage supplier risks, monitor performance, and track key metrics. By providing insights into risk levels, delivery performance, compliance status, and financial exposure, the dashboard enables businesses to make informed decisions and take proactive measures to mitigate risks. With customizable features and real-time data tracking, this dashboard is an invaluable resource for businesses looking to optimize their supplier relationships and minimize supply chain disruptions.
Frequently Asked Questions (FAQs)
1. How often should I update the Supplier Risk Dashboard?
It is recommended to update the Data Sheet regularly, ideally after each supplier update or change in status, to ensure that the dashboard is always up-to-date.
2. Can I track multiple suppliers across different industries?
Yes, the Supplier Risk Dashboard allows you to track suppliers across different industries by categorizing them in the Industry column and visualizing their data in charts.
3. Can I customize the charts and data columns?
Yes, the dashboard is fully customizable. You can modify the charts, add new columns, or track additional metrics as needed.
4. How does the Financial Exposure section help with supplier management?
The Financial Exposure section helps you track total spend by supplier, industry, region, and certifications, allowing you to manage financial risk and optimize budgeting.
5. Can I share the dashboard with my team?
Yes, since the dashboard is built in Excel, it can be easily shared with your team, allowing for collaboration and real-time data updates.
Visit our YouTube channel to learn step-by-step video tutorials
Watch the step-by-step video Demo:
Click to buy Supplier Risk Dashboard In Excel