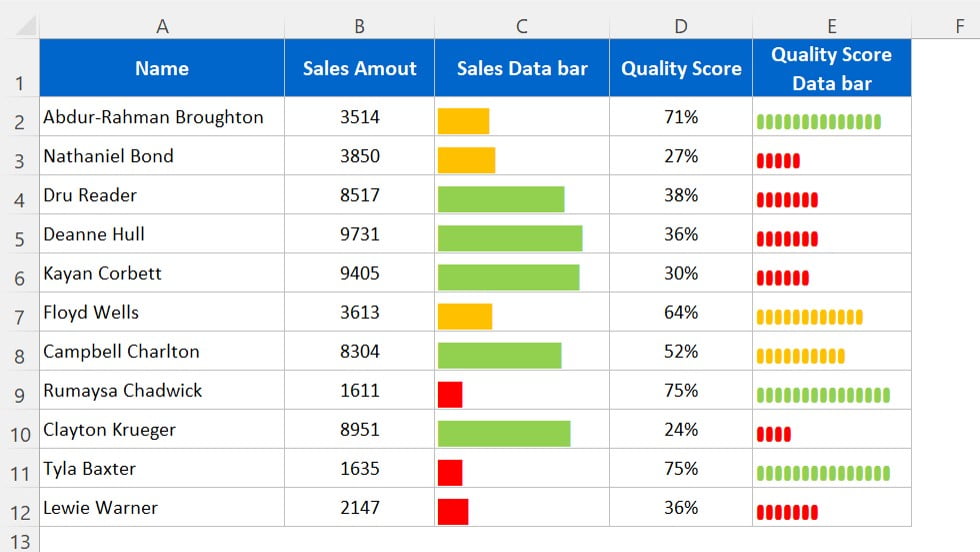
Multi-color Data bar with REPT function
In this article, we have created multi-color Data bar with REPT function in Excel. We have used the conditional formatting to change the color based on certain criteria. Multi-color Data
Transforming Data into Decisions