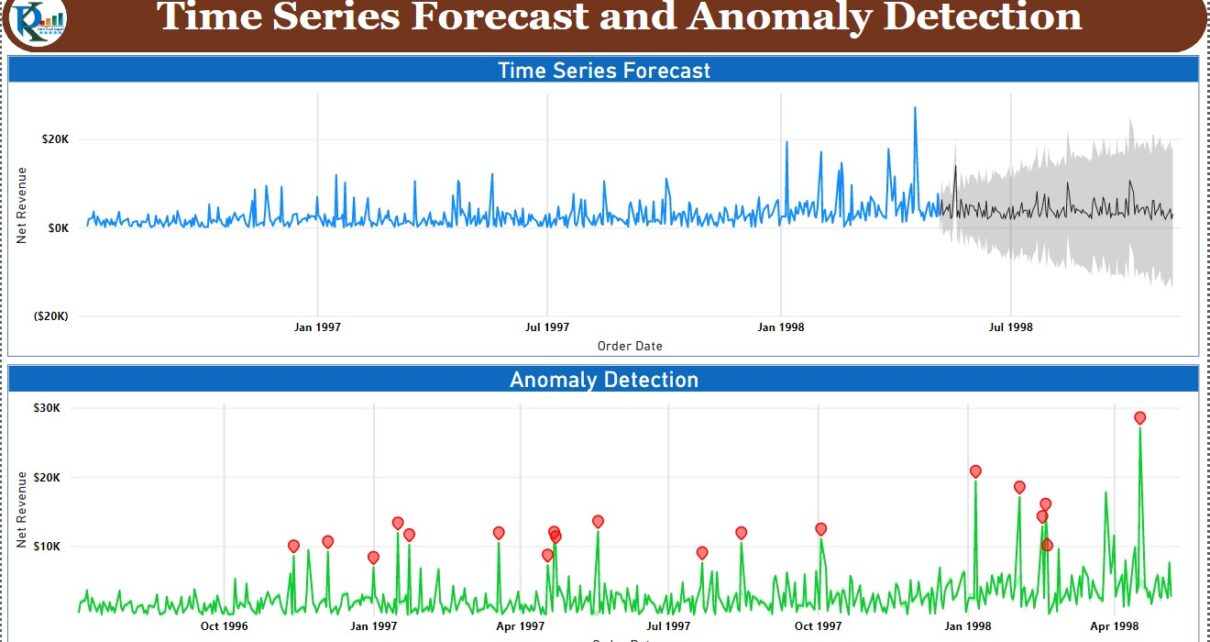
In this article, we have created the Time Series Forecast and Anomaly Detection in Microsoft Power BI. You can use this for Data Analysis, Sales Forecast, find Outliers in your data. You can also see the Explanation for the Anomalies.
Learn Forecasting in Microsoft Excel:
Time Series Forecast:
Time Series Forecast is used to get the predicted values like Sales, Revenue, etc. in coming periods (in days, months, year, etc). In the Power BI, you can achieve it using a Line chart.
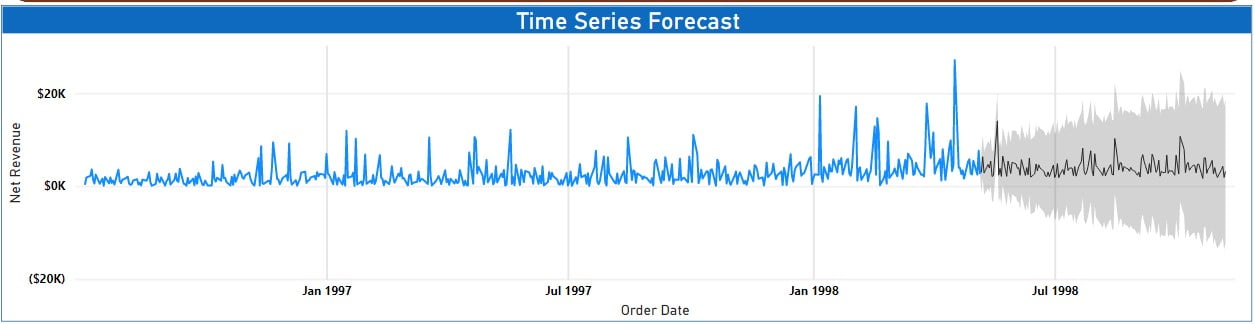
To show the forecast in your line chart, follow the below steps:
- Go to the “Analytics” tab available under Visualizations Pane.
- Go to the Forecast option available at the bottom side in this tab.
- Click on Add button.
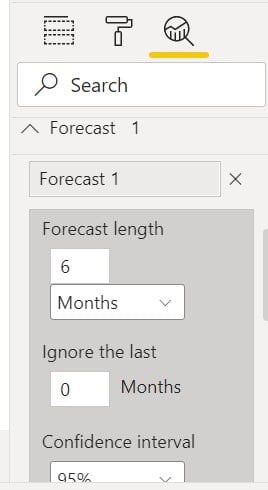
- Fill the forecast length like 6 months or any other.
- You can choose “Ignore the last” few intervals to gauge the accuracy of your forecast. For example, if you want to show the forecast for the next 6 months then you can choose to Ignore the last 2 months. Now it will show forecasted and actual value for 2 months and only forecasted value for 4 months.
- Confidence Interval: The default value for the confidence interval is 95% but you can choose it from the drop-down.
- Seasonality: Power BI can auto-detect the seasonality from your data. You can set seasonality to none, 2, 3, 4, 5, 6, 7, 12, 24, 52, or 365,
- Click on Apply button.
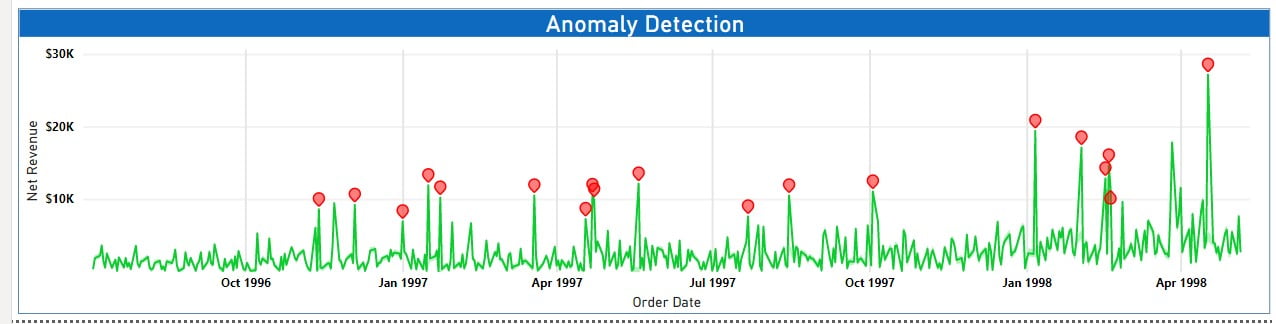
Anomaly Detection:
Using this feature, you can automatically detect anomalies in your time-series data. You can also see the possible explanations for the highlighted anomalies.
To show the anomalies on your line chart, below are the steps:
- Go to the “Analytics” tab available under Visualizations Pane.
- Go to the “Find anomalies” option available at the bottom side of this tab.
- Click on Add button.
Format Anomalies:
You can format the anomalies by changing the Anomaly Shape, Anomaly Shape Size, Anomaly Color, Expected Range Style, Expected range transparency, and Expected range color.
See Explanation:
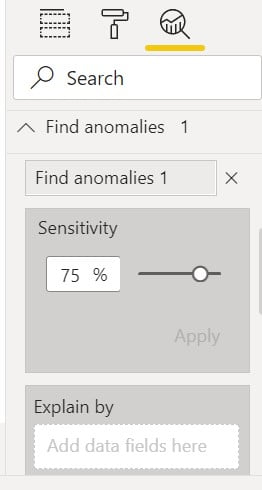
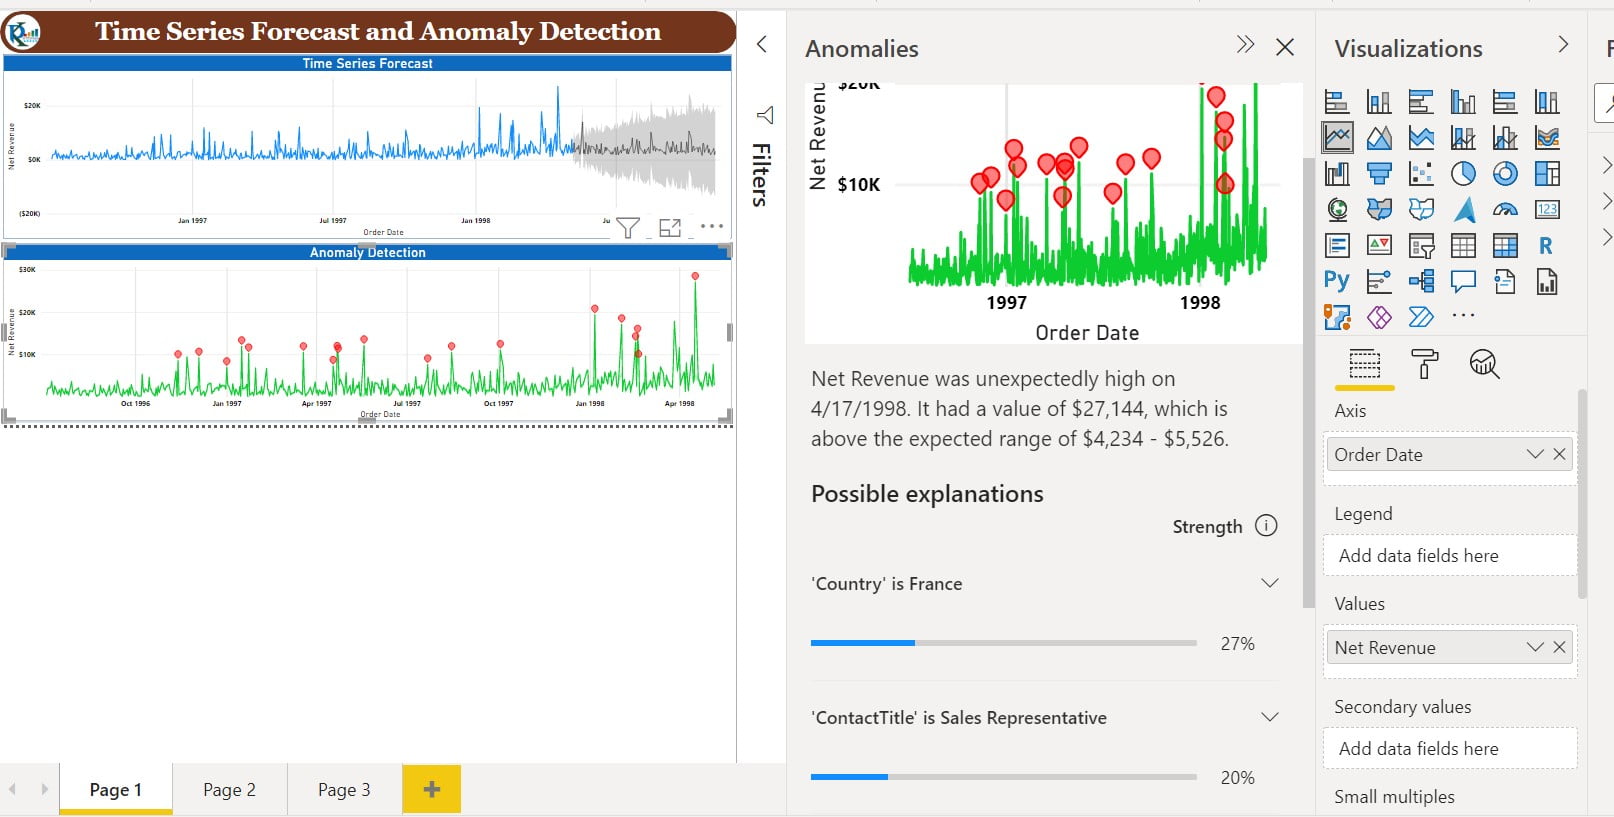
To see the explanations, you can click on any anomaly marker. It will open a new “Anomalies” pane, wherein you see the various explanation from data models in natural language as well as visuals. You can add that visual chart to your report after clicking on Add to report button available on the chart in the Anomalies pane.
You can define the field in “Explain by” box available in the Find anomalies pane.
See the live view in Power BI
7
Visit our YouTube channel to learn step-by-step video tutorials