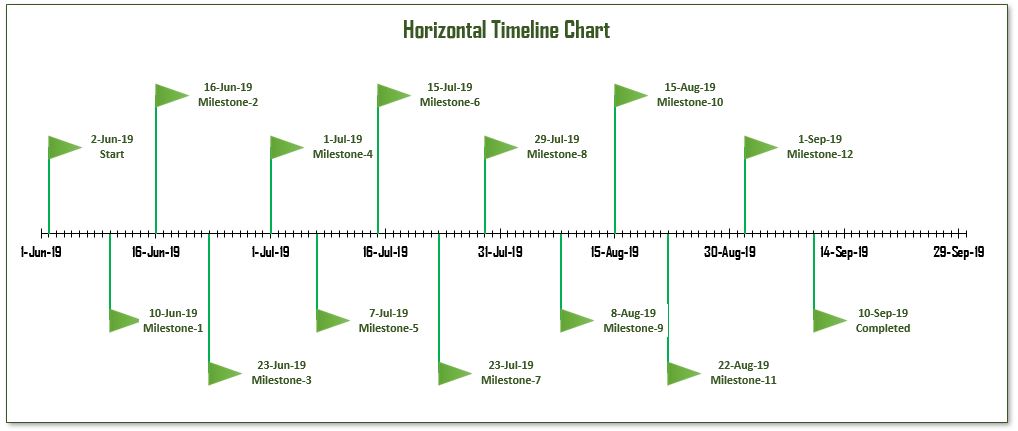
Horizontal Timeline Chart using Scatter chart in Excel
Project management is a complex task that involves multiple aspects, including planning, execution, control, and closure. Among the crucial elements of successful project management is the use of timeline charts,