New: NextGenTemplates Academy - video courses on Excel formulas with AI and Pivot Tables & dashboards. Early-bird: 20% off with code EARLYBIRD20 - first 20 orders only. See the courses →
  • Learn Excel (Free Course)
    • 1. Shortcut Keys
    • 2. Fill & Flash Fill
    • 3. Find & Replace
    • 4. Sort & Filter
    • 5. Formulas & Functions
    • 6. Data Validation
    • 7. Conditional Formatting
    • 8. Basic Charts
    • 9. Advanced Charts
    • 10. Pivot Tables
    • 11. Excel Dashboards
    • 12. VBA Course
    • 13. Excel Formulas with AI
  • Templates
  • Tutorials
    • Charts and Visualization
    • VBA
    • Excel Tips and Tricks
    • Excel Dashboards
    • Power Pivot & DAX
  • Power BI
  • Template Store
    • Ready to Use Templates
  • Courses
  • Academy
    • Excel + AI Mastery: 100 Formulas
    • Excel Pivot Tables & Dashboards
  • About Us
  • Contact Us

PK: An Excel Expert

Transforming Data into Decisions
Tag: KPI Dashboard

Blogs

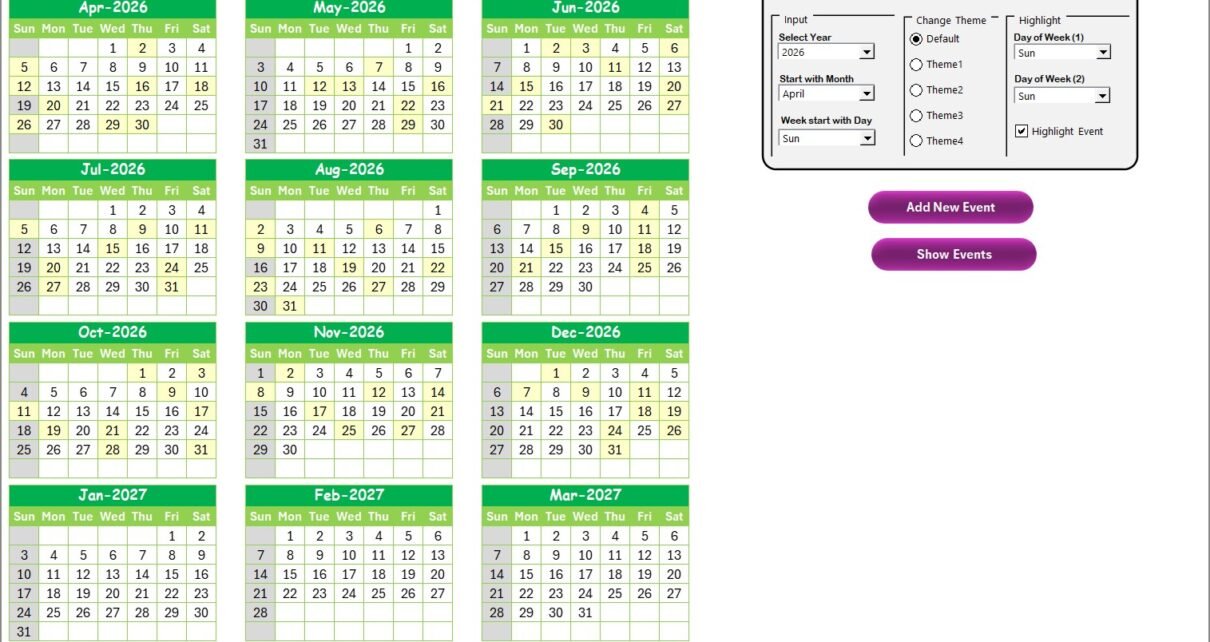
Small Business Cash Flow Calendar in Excel

April 29, 2026April 29, 2026 PKComments Off on Small Business Cash Flow Calendar in Excel
Introduction Small Business Cash Flow Calendar in Excel is a powerful tool designed to help business owners manage their cash flow efficiently throughout the year. This ready-to-use Excel template offers
Read More
Blogs

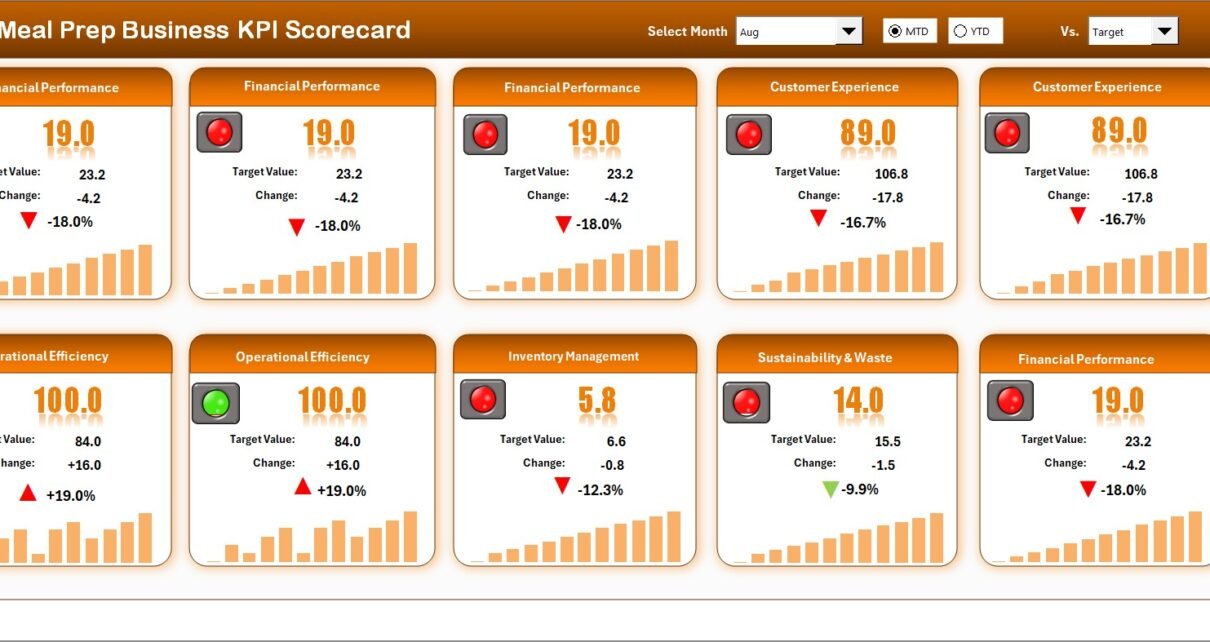
Meal Prep Business KPI Scorecard in Excel

April 29, 2026April 29, 2026 PKComments Off on Meal Prep Business KPI Scorecard in Excel
Introduction Managing a Meal Prep Business successfully requires a keen eye on performance metrics. This Meal Prep Business KPI Scorecard is a comprehensive, ready-to-use template designed to help you monitor,
Read More
Power BI

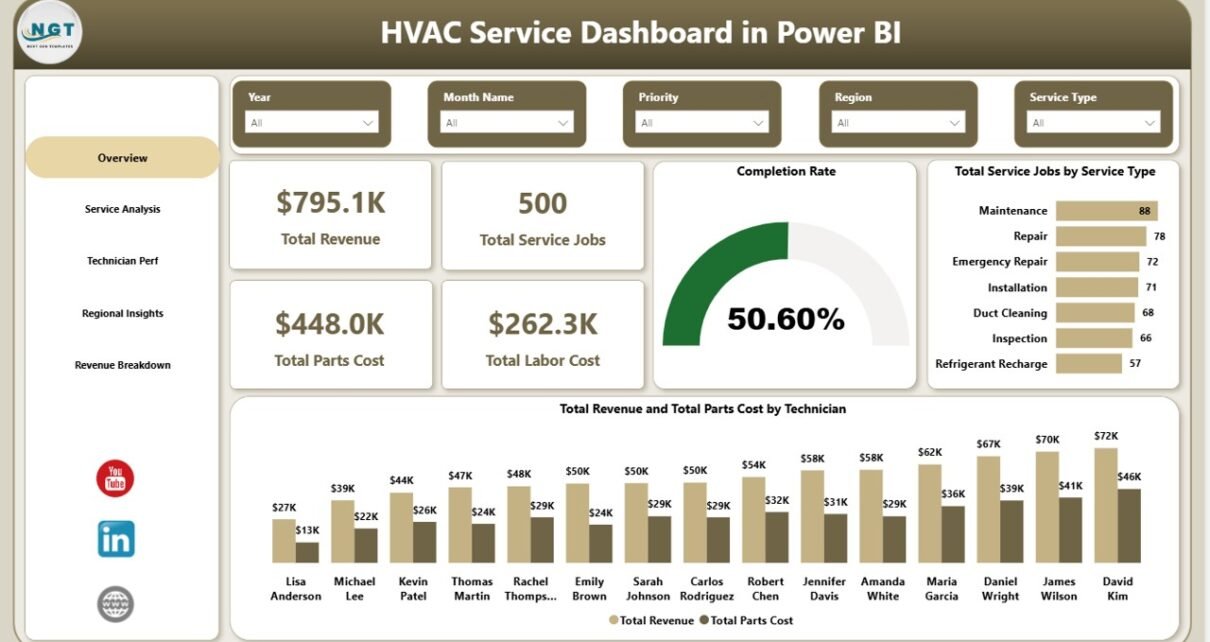
HVAC Service Dashboard in Power BI

April 20, 2026April 20, 2026 PKComments Off on HVAC Service Dashboard in Power BI
Running an HVAC service business means juggling dozens of data points every week — service calls, technician dispatches, parts cost, response times, customer ratings, and regional profit. When all of
Read More
Dashboard

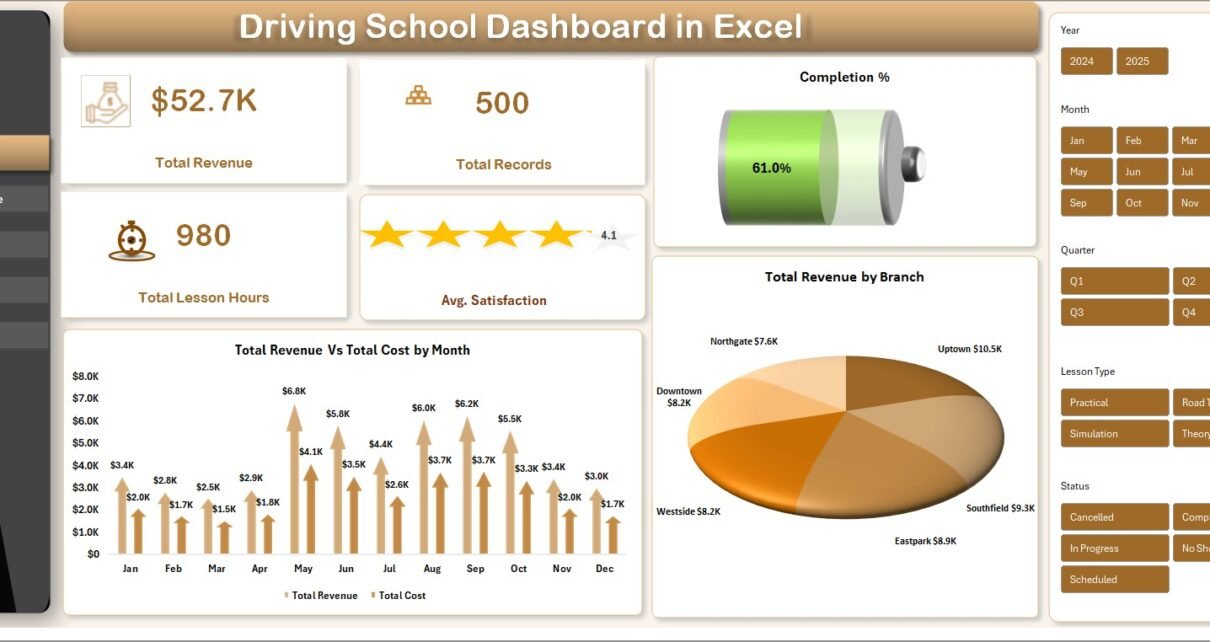
Driving School Dashboard in Excel

April 20, 2026April 20, 2026 PKComments Off on Driving School Dashboard in Excel
Driving School Dashboard in Excel is a ready-to-use analytics template built for driving school owners, training managers, and multi-branch driving academies who need to track revenue, branch performance, instructor results,
Read More
Power BI

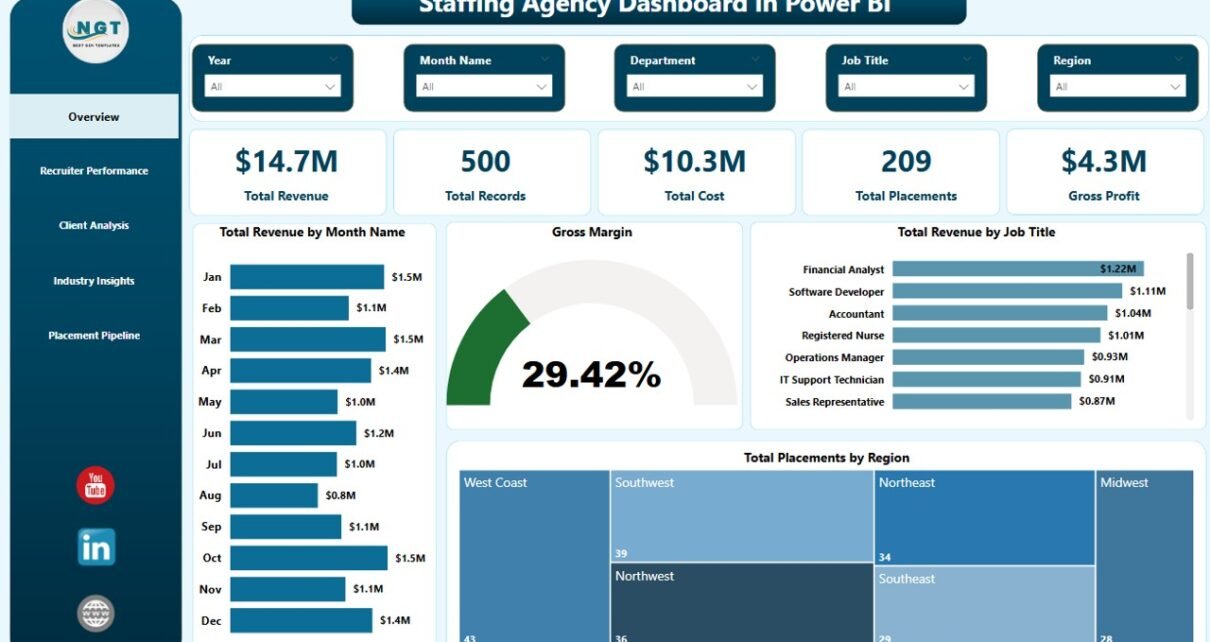
Staffing Agency Dashboard in Power BI

April 19, 2026April 20, 2026 PKComments Off on Staffing Agency Dashboard in Power BI
The Staffing Agency Dashboard in Power BI tracks 5 headline KPIs and 12+ chart visualizations across 5 interactive pages — Overview, Recruiter Performance, Client Analysis, Industry Insights, and Placement Pipeline.
Read More
Power BI

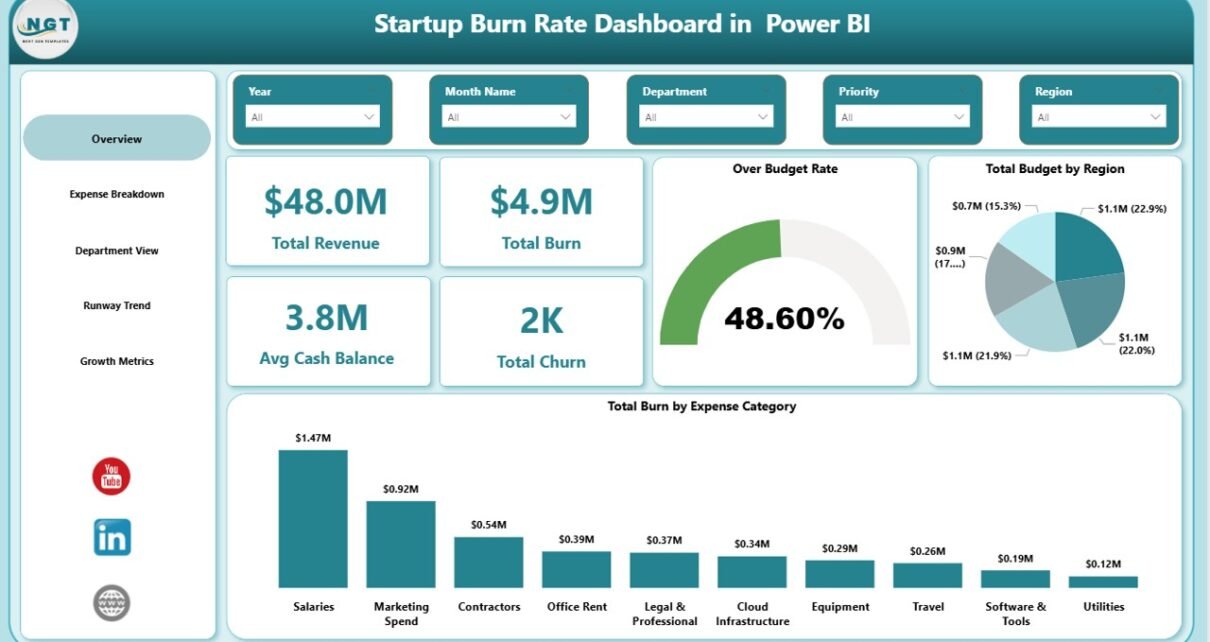
Startup Burn Rate Dashboard in Power BI

April 13, 2026April 13, 2026 PKComments Off on Startup Burn Rate Dashboard in Power BI
Startup Burn Rate Dashboard in Power BI is a comprehensive, ready-to-use Power BI dashboard template designed to give startup founders, CFOs, finance teams, and investors complete visibility into cash burn,
Read More
Dashboard

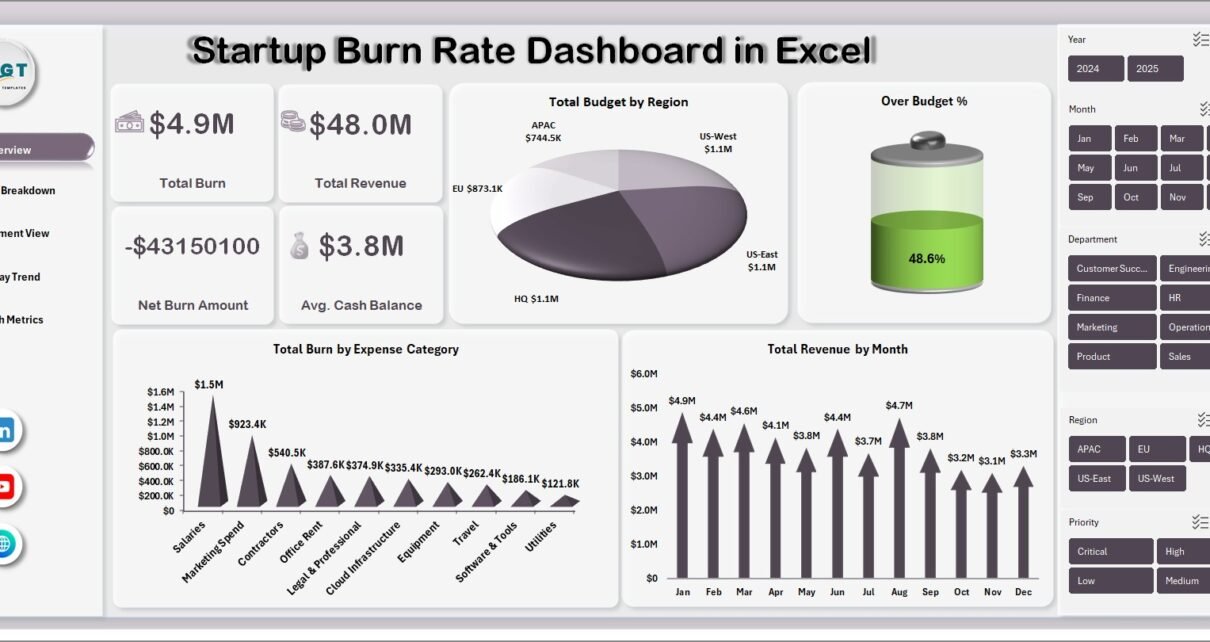
Startup Burn Rate Dashboard in Excel

April 11, 2026April 11, 2026 PKComments Off on Startup Burn Rate Dashboard in Excel
Startup Burn Rate Dashboard in Excel is a professionally designed, pivot-powered analytics template that gives startup founders, CFOs, and finance teams complete visibility into cash burn, revenue performance, expense breakdown,
Read More
Dashboard

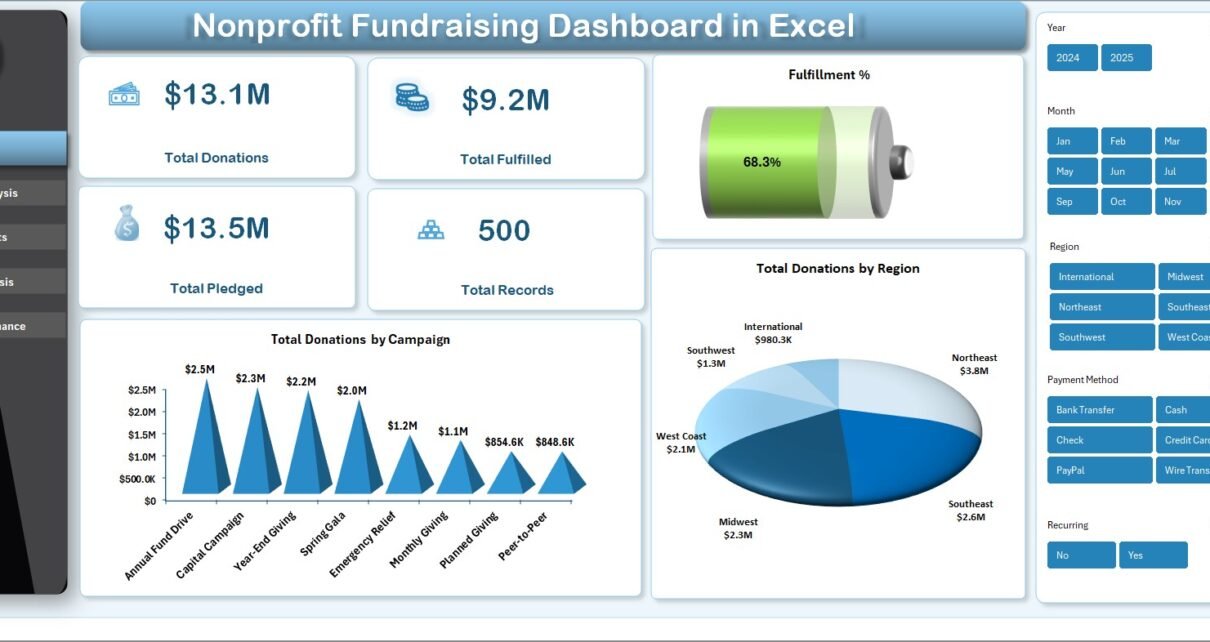
Nonprofit Fundraising Dashboard in Excel

April 9, 2026April 9, 2026 PKComments Off on Nonprofit Fundraising Dashboard in Excel
Nonprofit Fundraising Dashboard in Excel — Complete Analytics for Fundraising Success Nonprofit Fundraising Dashboard in Excel is a comprehensive, ready-to-use analytics template designed specifically for nonprofit organizations, charity managers, fundraising
Read More
Dashboard

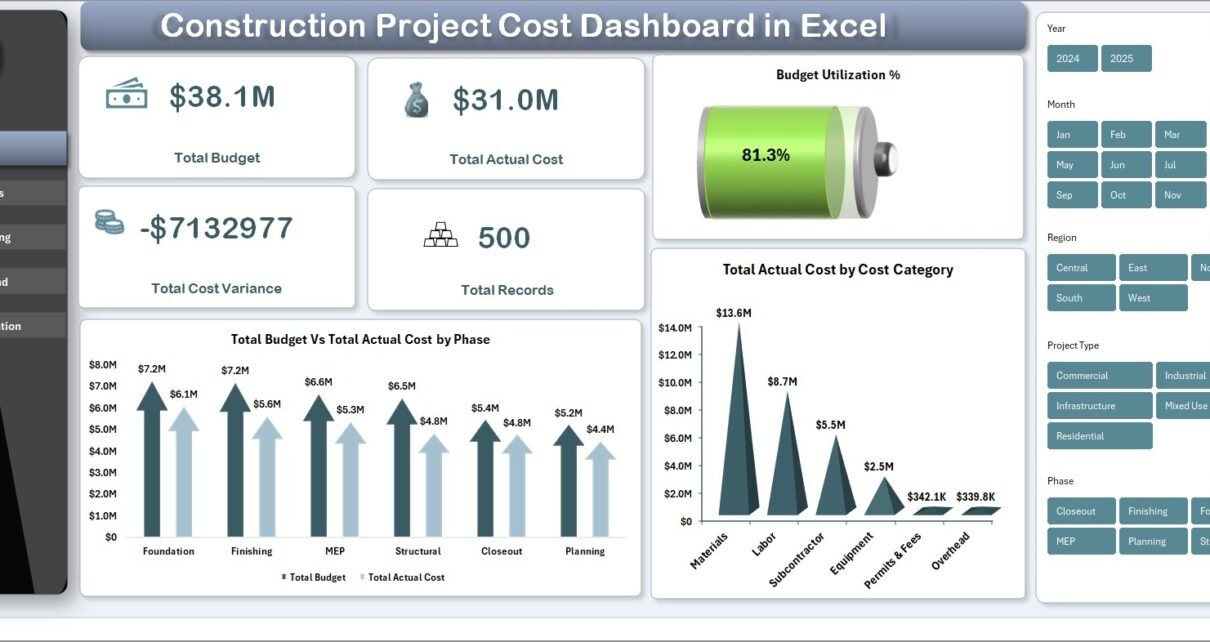
Construction Project Cost Dashboard in Excel

April 8, 2026April 8, 2026 PKComments Off on Construction Project Cost Dashboard in Excel
Construction Project Cost Dashboard in Excel is a powerful, pivot-driven analytics template designed for construction professionals who need to monitor budgets, track actual costs, analyze cost variances, and manage resources
Read More
Dashboard Power BI

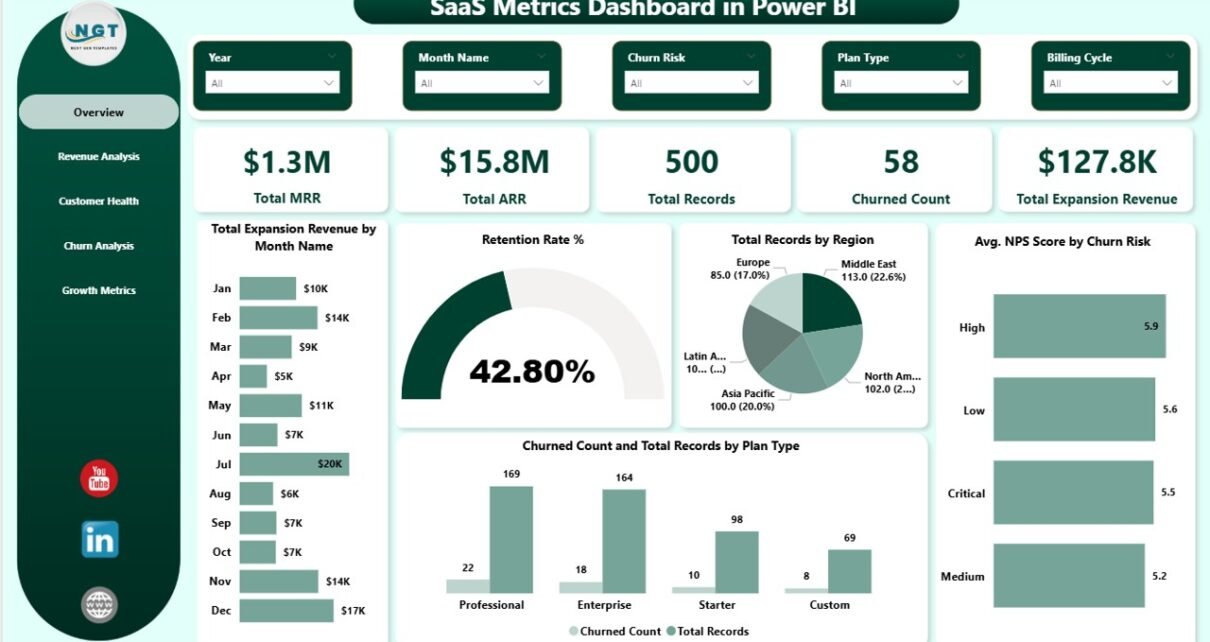
SaaS Metrics Dashboard in Power BI

April 5, 2026April 5, 2026 PKComments Off on SaaS Metrics Dashboard in Power BI
SaaS Metrics Dashboard in Power BI is a professionally designed, interactive analytics template built for SaaS founders, subscription business owners, revenue operations managers, and customer success leaders who want to
Read More

Posts pagination

Previous 1 … 5 6 7 … 83 Next
  • Learn Excel (Free Course)
    • 1. Shortcut Keys
    • 2. Fill & Flash Fill
    • 3. Find & Replace
    • 4. Sort & Filter
    • 5. Formulas & Functions
    • 6. Data Validation
    • 7. Conditional Formatting
    • 8. Basic Charts
    • 9. Advanced Charts
    • 10. Pivot Tables
    • 11. Excel Dashboards
    • 12. VBA Course
    • 13. Excel Formulas with AI
  • Templates
  • Tutorials
    • Charts and Visualization
    • VBA
    • Excel Tips and Tricks
    • Excel Dashboards
    • Power Pivot & DAX
  • Power BI
  • Template Store
    • Ready to Use Templates
  • Courses
  • Academy
    • Excel + AI Mastery: 100 Formulas
    • Excel Pivot Tables & Dashboards
  • About Us
  • Contact Us
Copyright © 2023 PK-AnExcelExpert.com - Privacy Policy