Nonprofit Fundraising Dashboard in Excel — Complete Analytics for Fundraising Success
Nonprofit Fundraising Dashboard in Excel is a comprehensive, ready-to-use analytics template designed specifically for nonprofit organizations, charity managers, fundraising coordinators, and development officers who need to track donations, monitor campaign effectiveness, analyze donor behavior, and evaluate regional performance — all from a single Excel workbook. Whether you run a small community nonprofit or manage a large-scale fundraising operation, this dashboard provides the visual clarity and data-driven insights you need to make smarter fundraising decisions.Nonprofit Fundraising Dashboard in Excel
This template includes 5 interactive analysis pages, a structured Data Sheet for easy data entry, and a Support Sheet powered by pivot tables that auto-refresh every chart and KPI with a single click. It tracks key metrics including Total Donations, Total Fulfilled, Total Pledged, Total Records, and Fulfillment Percentage — giving you a complete picture of your fundraising health at a glance. You can click here to purchase the Nonprofit Fundraising Dashboard in Excel on NextGenTemplates.
Key Features of the Nonprofit Fundraising Dashboard in Excel
- 5 Interactive Dashboard Pages — Overview, Campaign Analysis, Donor Insights, Program Analysis, and Regional Performance for 360-degree fundraising visibility.
- 5 Key Metric Cards — Instantly view Total Donations, Total Fulfilled, Total Pledged, Total Records, and Fulfillment % on the Overview page.
- Campaign Performance Tracking — Compare completed donations by campaign, analyze donation channels, and track monthly record trends.
- Donor Segmentation Analysis — Break down donations by donor type, payment method, acquisition cost, and recurring donor patterns.
- Program Area Evaluation — Identify which programs attract the most funding and where fulfillment gaps exist.
- Regional Performance Insights — Compare Total Fulfilled Vs Total Pledged by region and track Average Donor Rating geographically.
- Interactive Slicers & Filters — Filter the entire dashboard by campaign, region, donor type, or time period for targeted analysis.
- Pivot-Powered Auto-Refresh — Update your data and click Refresh All — every chart and KPI updates automatically across all pages.
- No VBA or Macros Required — Built entirely with standard Excel formulas and pivot tables for maximum compatibility.
- Professional & Print-Ready Design — Clean, boardroom-ready layouts perfect for stakeholder presentations and donor reports.
Dashboard Pages Explained
1. Overview Page
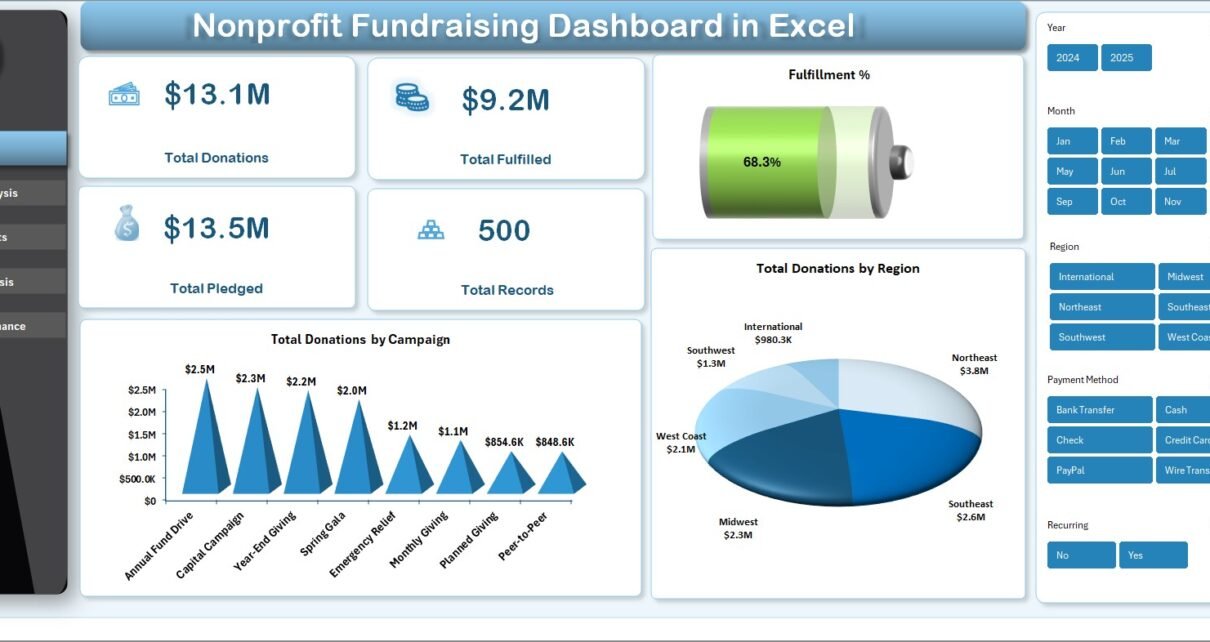
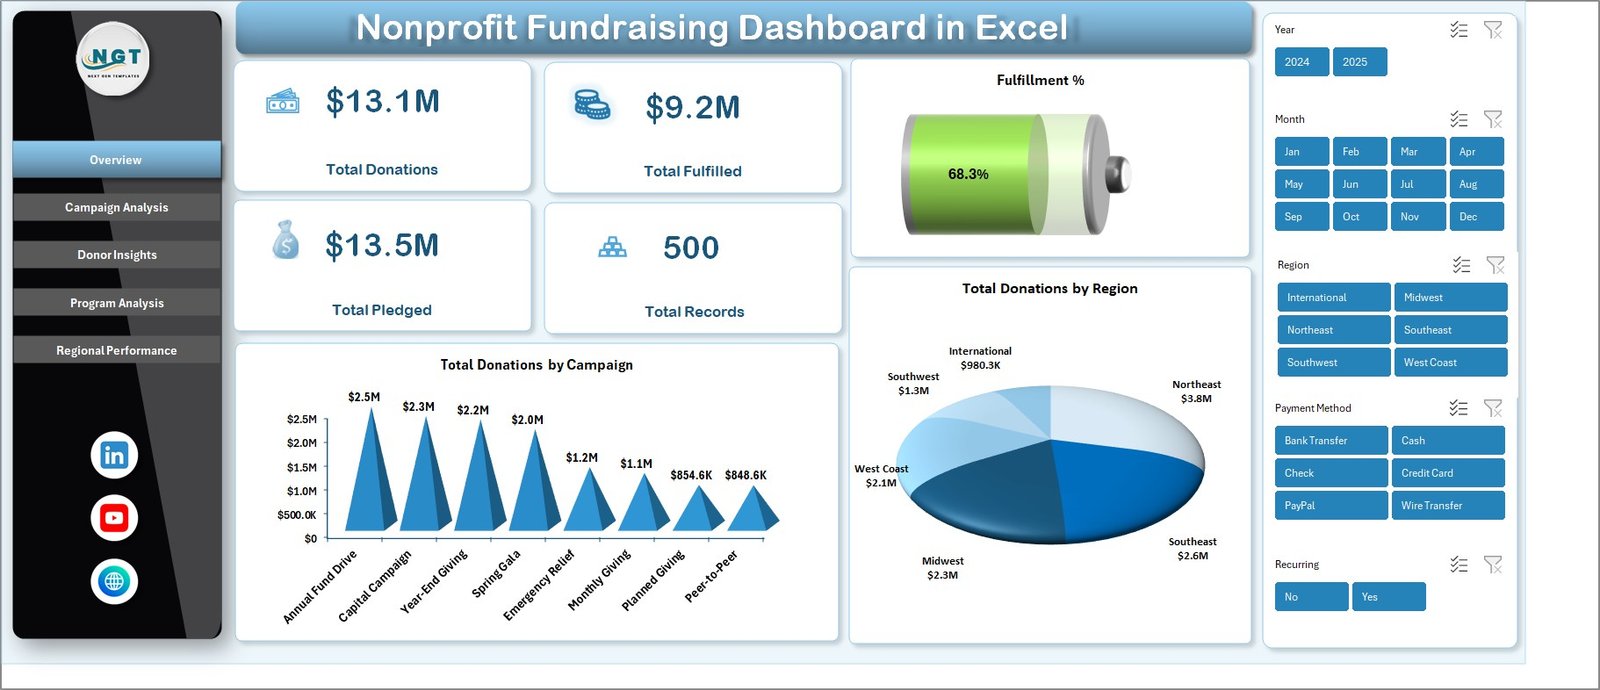
The Overview page serves as your high-level command center for nonprofit fundraising analytics. At the top, you will find 5 key metric cards displaying Total Donations, Total Fulfilled, Total Pledged, Total Records, and Fulfillment %. These cards provide an instant snapshot of your organization’s fundraising health.
Below the cards, interactive charts visualize Total Donations by Campaign and Total Donations by Region, helping you quickly identify which campaigns and geographic areas are driving the most revenue. Multiple slicers allow you to filter the entire dashboard by various dimensions for quick, targeted analysis.
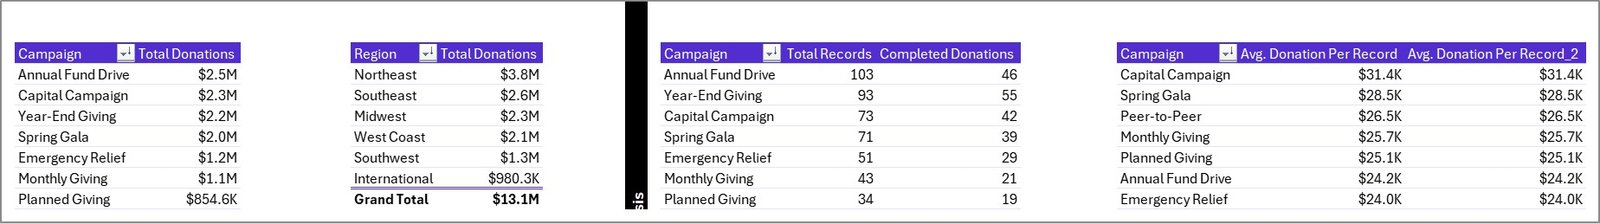
Nonprofit Fundraising Dashboard in Excel2. Campaign Analysis
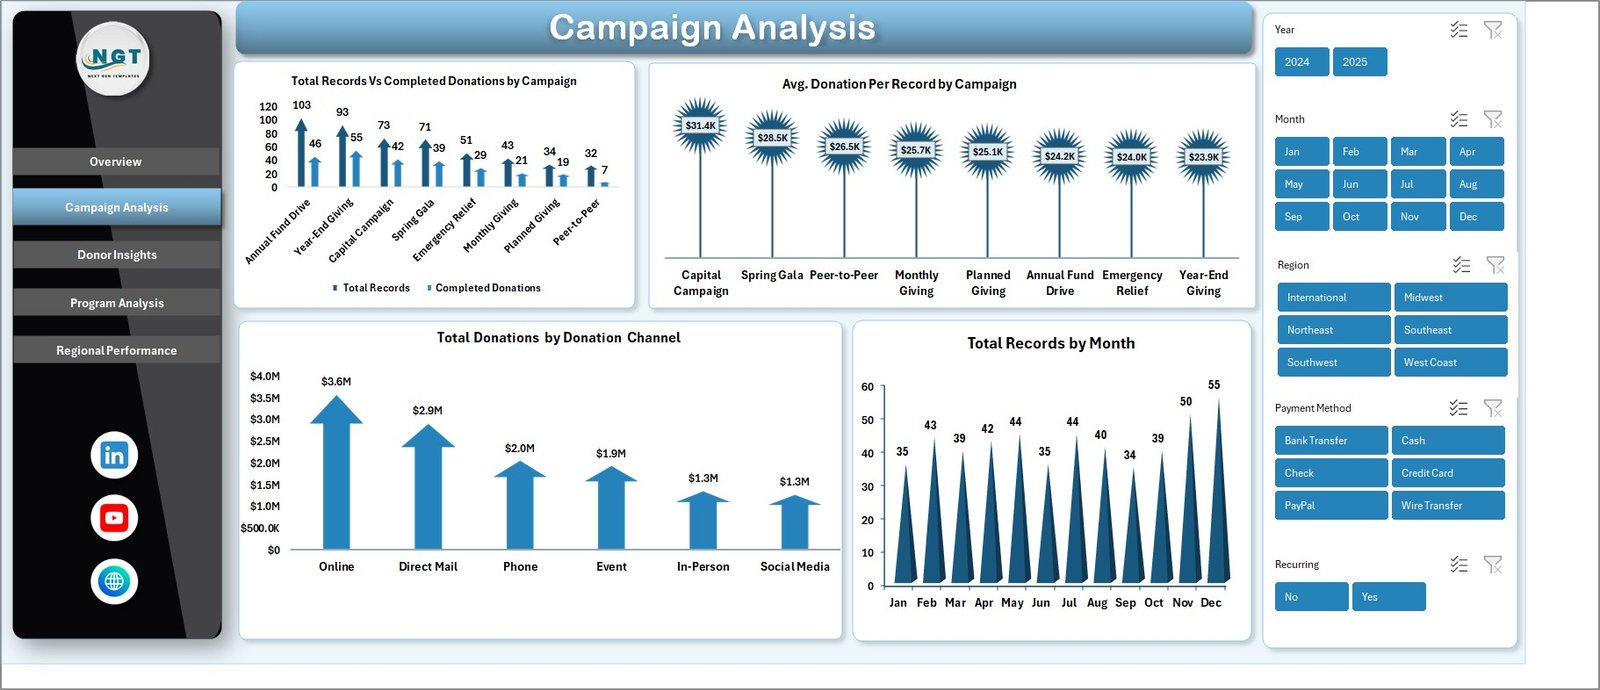
The Campaign Analysis page dives deep into campaign-level performance metrics. It features charts showing Total Records Vs Completed Donations by Campaign, which helps you understand conversion rates across different fundraising campaigns. The Average Donation Per Record by Campaign chart reveals which campaigns attract higher-value donors.
Additional visualizations include Total Donations by Donation Channel (online, offline, events, etc.) and Total Records by Month, enabling you to identify seasonal patterns and optimize your campaign timing throughout the year.
 Campaign Analysis
3. Donor Insights
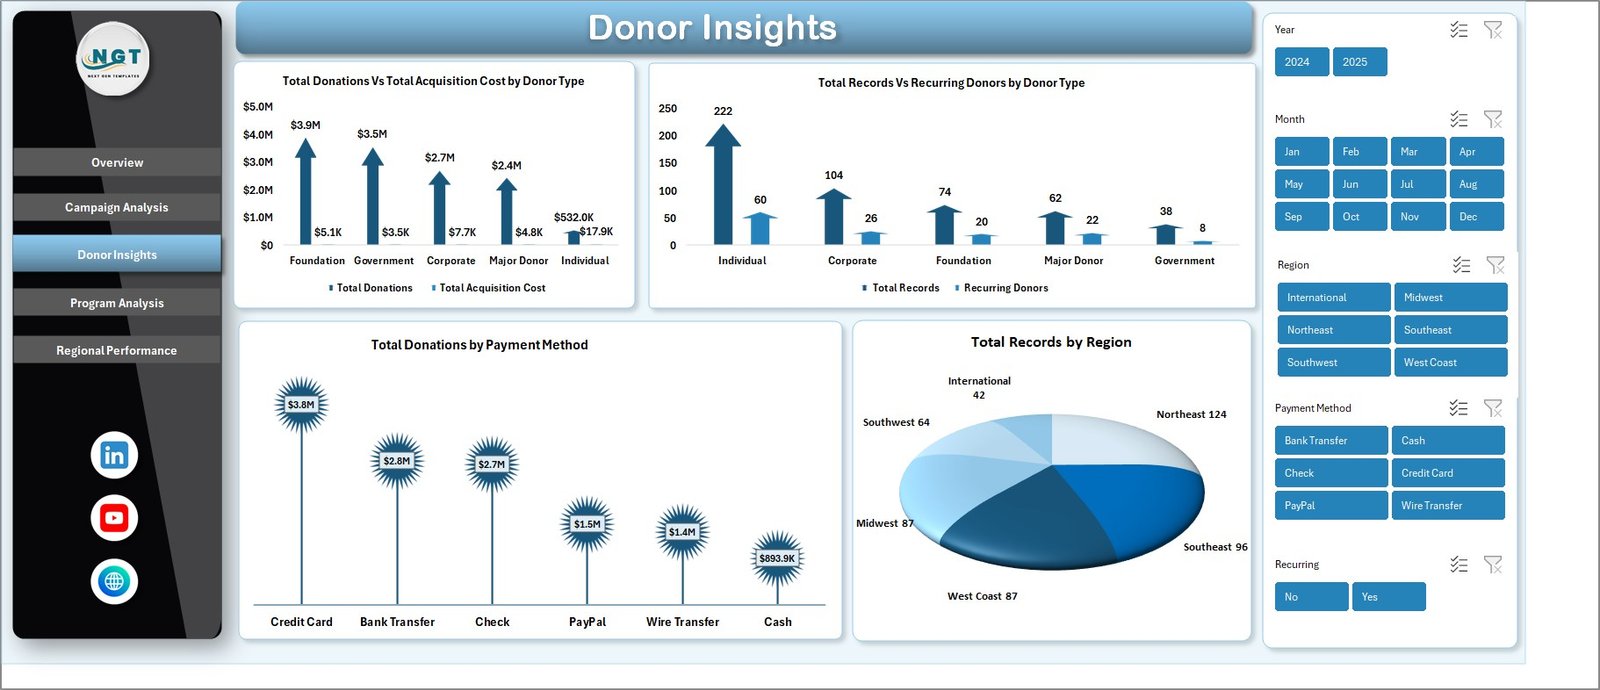
The Donor Insights page provides a comprehensive view of your donor base. The Total Donations Vs Total Acquisition Cost by Donor Type chart helps you evaluate ROI across different donor segments, while Total Records Vs Recurring Donors by Donor Type shows which segments have the highest retention rates.
You can also analyze Total Donations by Payment Method to understand preferred giving channels and Total Records by Region to see geographic distribution of your donor base. This page is essential for optimizing donor acquisition strategies and reducing costs.
 Donor Insights
4. Program Analysis
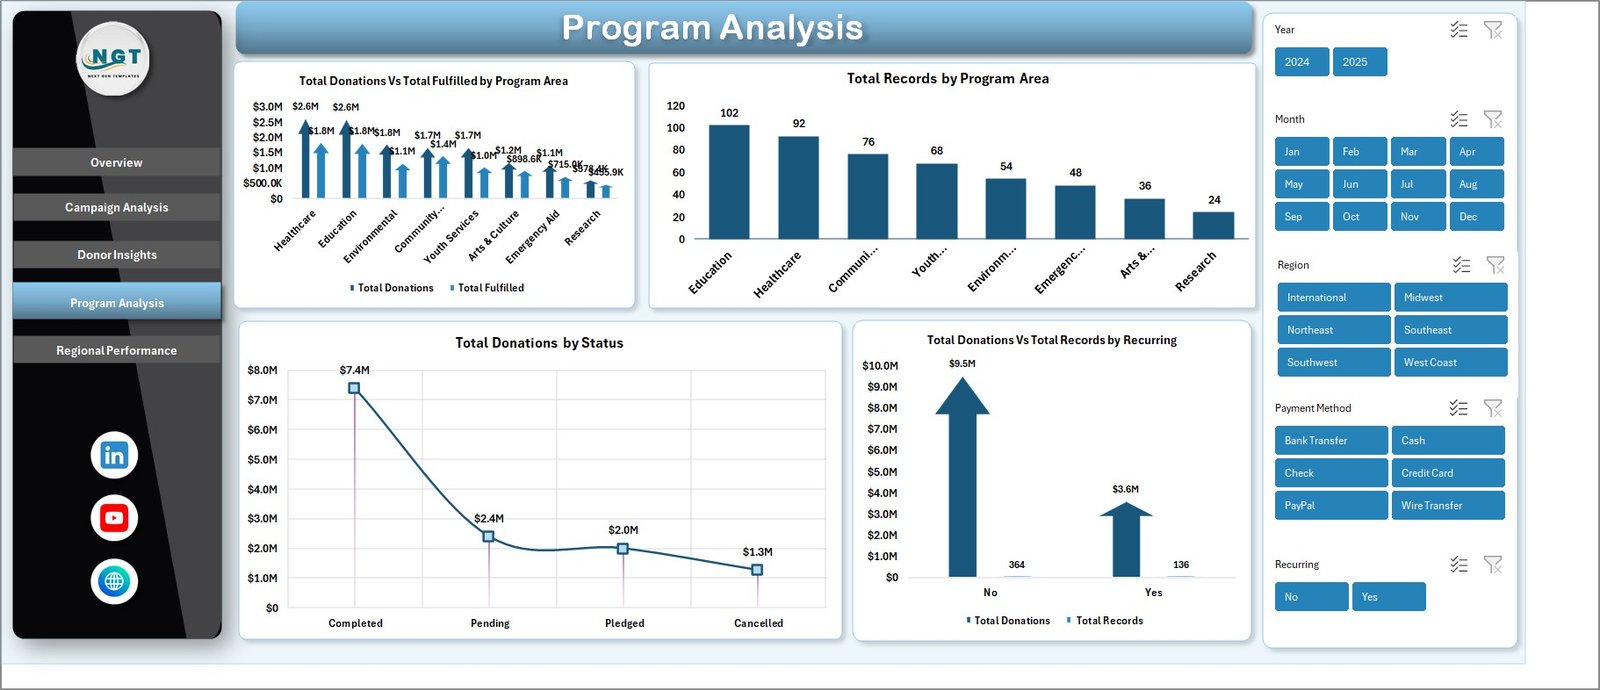
The Program Analysis page evaluates the effectiveness of your organization’s programs. Charts display Total Donations Vs Total Fulfilled by Program Area, revealing where funding is going and how much is being fulfilled. Total Records by Program Area shows which programs attract the most donors.
Additional analysis includes Total Donations by Status (completed, pending, pledged) and Total Donations Vs Total Records by Recurring, which highlights the impact of recurring giving programs on your overall fundraising performance.
 Program Analysis
5. Regional Performance
The Regional Performance page compares fundraising results across geographic areas. The Total Fulfilled Vs Total Pledged by Region chart reveals which regions are meeting their pledged targets and which have fulfillment gaps. Average Donor Rating by Region provides a quality metric to evaluate donor satisfaction geographically.
A Total Donations by Year trend chart rounds out this page, allowing you to track year-over-year fundraising growth and identify long-term performance patterns across regions.
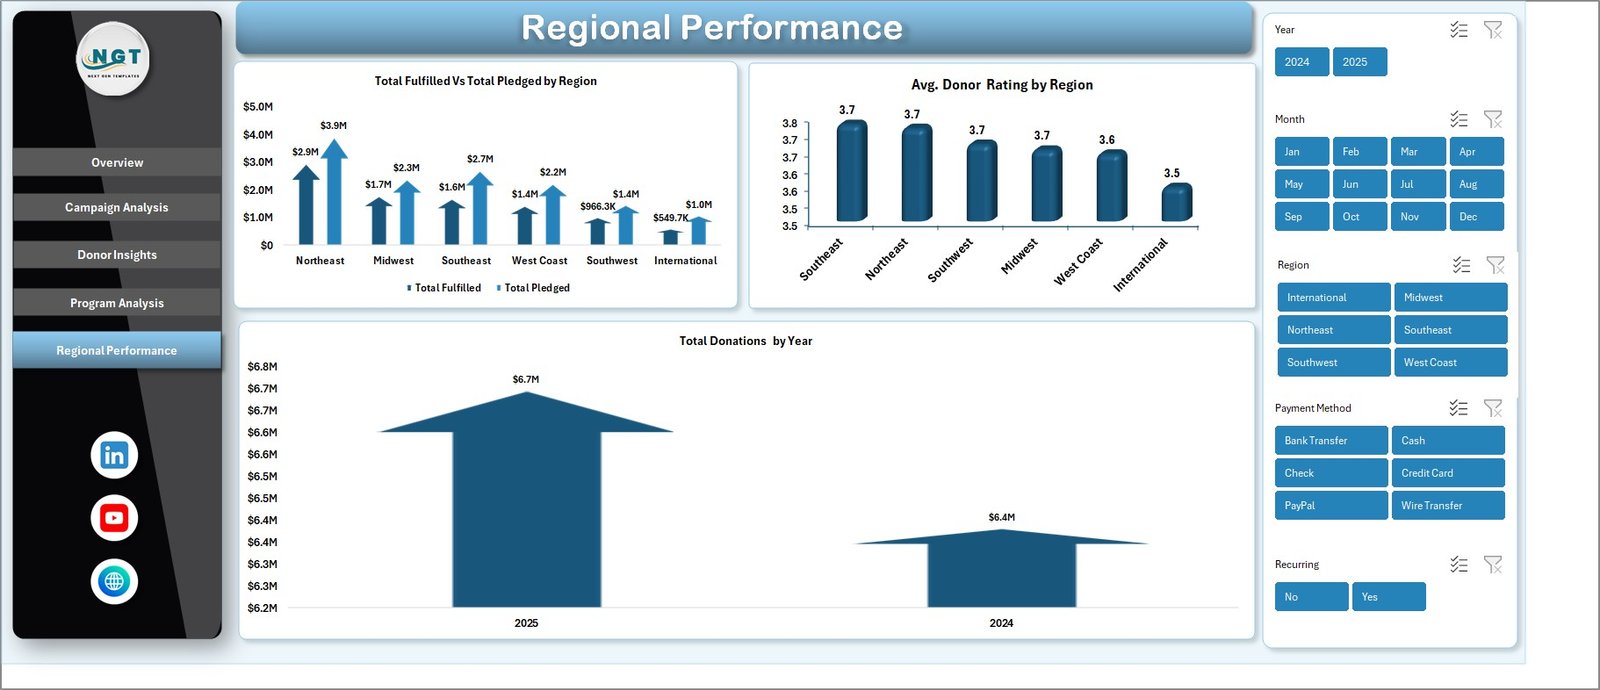 Regional Performance
6. Data Sheet
The Data Sheet is your structured data entry area. Simply add your fundraising records in the same column format — including donation amounts, campaign names, donor types, regions, program areas, payment methods, and statuses. After updating your data, the entire dashboard refreshes automatically when you click Refresh All.
 Data Sheet Tab
7. Support Sheet
The Support Sheet contains multiple pivot tables that power the entire dashboard dynamically. After updating your data in the Data Sheet, navigate to the Data tab in the Excel Ribbon and click Refresh All — every pivot table and chart across all 5 dashboard pages updates automatically. You can keep this sheet hidden for a cleaner user experience.
 Support Sheet Tab
Advantages of the Nonprofit Fundraising Dashboard in Excel
This dashboard template offers several compelling advantages for nonprofit organizations of all sizes. First, it eliminates the need for expensive BI software — everything runs in Microsoft Excel, which most organizations already have. The pivot-powered architecture means the dashboard is fully dynamic and adapts to your data without requiring any formula modifications.
The 5-page structure provides a logical workflow — starting with a high-level overview and drilling down into campaigns, donors, programs, and regions. This makes it easy to present findings to different stakeholders: board members get the Overview, fundraising teams get Campaign Analysis and Donor Insights, and program managers get Program Analysis.
Additionally, the interactive slicers on the Overview page let you filter the entire dashboard instantly, making ad-hoc analysis fast and intuitive. The professional design is print-ready, so you can export individual pages as PDFs for board presentations or donor reports without additional formatting.
Opportunities for Improvement
While the dashboard covers a wide range of fundraising analytics, there are a few areas where you could extend its capabilities. Adding a Donor Retention Rate metric would help track how many donors continue giving year over year. A dedicated Event Fundraising page could provide deeper analysis for organizations that rely heavily on fundraising events.
You could also integrate Goal vs. Actual target tracking on each dashboard page to measure progress against annual fundraising goals. For organizations with international operations, adding a currency conversion layer would help standardize cross-border donation reporting.
Best Practices for Using This Dashboard
- Keep your Data Sheet clean — Use consistent naming for campaigns, regions, donor types, and program areas to ensure accurate pivot table grouping.
- Refresh regularly — Click Refresh All in the Data tab after every data update to keep all charts and KPIs current.
- Use slicers strategically — Filter by specific campaigns or time periods to generate targeted reports for board meetings or donor updates.
- Hide the Support Sheet — Keep the pivot table sheet hidden for a cleaner presentation when sharing the workbook with non-technical stakeholders.
- Back up before editing — Always save a copy before making structural changes to the dashboard layout or pivot table configurations.
Explore Relevant Templates
If you found this dashboard useful, explore these related nonprofit and fundraising templates on NextGenTemplates:
- Nonprofit Organizations KPI Dashboard in Power BI — Advanced KPI tracking with Power BI interactive visuals for nonprofit organizations.
- Charity Fundraising KPI Scorecard in Excel — A structured KPI scorecard with MTD/YTD comparisons for charity fundraising campaigns.
- Donation Management Tracker in Google Sheets — A cloud-based tracker for managing donations, pledges, and donor communications.
- Corporate Donation Request Tracker in Google Sheets — Track and manage corporate donation requests and fulfillment status.
- Adult Literacy Programs Dashboard in Excel — A comprehensive Excel dashboard for tracking educational nonprofit program performance.
You can also browse all available Excel Dashboard Templates on NextGenTemplates.
Frequently Asked Questions
What KPIs does the Nonprofit Fundraising Dashboard in Excel track?
The Nonprofit Fundraising Dashboard in Excel tracks 5 key performance indicators on the Overview page: Total Donations, Total Fulfilled, Total Pledged, Total Records, and Fulfillment Percentage. Across the 5 analysis pages, additional metrics include Average Donation Per Record by Campaign, Total Acquisition Cost by Donor Type, Recurring Donor counts, Total Donations by Donation Channel, and Average Donor Rating by Region.
Do I need advanced Excel skills to use this fundraising dashboard?
No. The dashboard is designed for users of all skill levels. Simply replace the sample data in the Data Sheet with your own records and click Refresh All in the Data tab. All charts, KPI cards, and pivot tables update automatically. No formulas, VBA, or macros knowledge is required.
Can I customize the campaigns and regions in this template?
Yes. The dashboard is fully dynamic and driven by pivot tables. When you enter your own campaign names, regions, donor types, and program areas in the Data Sheet, the charts and analysis pages automatically reflect your unique data after refreshing.
How many dashboard pages does this Excel template include?
The template includes 7 worksheets total: 5 interactive dashboard pages (Overview, Campaign Analysis, Donor Insights, Program Analysis, Regional Performance), 1 Data Sheet for data entry, and 1 Support Sheet containing the pivot tables that power the entire dashboard.
What is the best Excel template for tracking nonprofit fundraising?
The Nonprofit Fundraising Dashboard in Excel from NextGenTemplates is one of the most comprehensive options available. It covers 5 analysis dimensions — campaigns, donors, programs, regions, and overall performance — with automated pivot tables and interactive slicers for instant filtering. It requires no setup or coding, making it accessible to all nonprofit professionals.
Can this dashboard be used for board of directors presentations?
Absolutely. Each dashboard page is professionally designed with clean, boardroom-ready visuals. You can print individual pages or export them as PDFs to share with board members, donors, and stakeholders. The Overview page is particularly well-suited for executive-level presentations.
Conclusion
The Nonprofit Fundraising Dashboard in Excel is the ultimate analytics tool for nonprofit organizations that want to track donations, monitor campaign performance, understand donor behavior, evaluate program effectiveness, and compare regional results — all from a single, easy-to-use Excel workbook. With 5 interactive dashboard pages, pivot-powered auto-refresh, and a professional design that’s ready for board presentations, this template saves hours of manual reporting while delivering actionable insights.
Click here to Purchase the Nonprofit Fundraising Dashboard in Excel on NextGenTemplates and start making data-driven fundraising decisions today.
For more Excel dashboard tutorials and walkthroughs, visit our YouTube channel: Youtube.com/@PK-AnExcelExpert