YouTube Channel Analytics Dashboard in Power BI is a professionally designed Power BI template that gives content creators, digital marketers, and media agencies a complete analytics solution for tracking YouTube channel performance. This dashboard features 5 interactive pages — Overview, Content Analysis, Audience Insights, Revenue Analysis, and Growth Metrics — packed with KPI cards, dynamic charts, and smart slicers that transform raw YouTube data into actionable insights instantly.
Whether you’re a solo creator optimizing your upload strategy or a marketing agency managing multiple client channels, this Power BI dashboard template delivers the visibility you need to make data-driven decisions. With built-in filters for date, content type, device, and traffic source, you can drill down into any dimension of your channel performance in seconds.
Click here to Purchase YouTube Channel Analytics Dashboard in Power BI
Key Features of the YouTube Channel Analytics Dashboard in Power BI
- 5 Interactive Dashboard Pages — Dedicated pages for Overview, Content Analysis, Audience Insights, Revenue Analysis, and Growth Metrics provide a 360-degree view of your YouTube channel
- Real-Time KPI Cards — Track Total Records, Total Revenue, Total Views, Total Subscribers Gained, and Total Watch Time at a glance from the Overview page
- Multi-Dimensional Revenue Tracking — Analyze revenue by Month, Content Type, Category, Traffic Source, and Device Type across dedicated visualizations
- Audience Segmentation — Break down views and engagement by Audience Age Group, Traffic Source, and Category to understand your viewer demographics
- Growth Monitoring — Track subscriber gains and net subscriber growth by month, content type, and category to measure channel momentum
- Smart Slicers — Filter the entire dashboard instantly by date range, content type, device type, and more
- Fully Editable — Customize every chart, add new pages, and connect to live data sources in Power BI Desktop
If you’re looking for more analytics solutions, explore our collection of Power BI Dashboard Templates at NextGenTemplates.
Dashboard Pages Explained
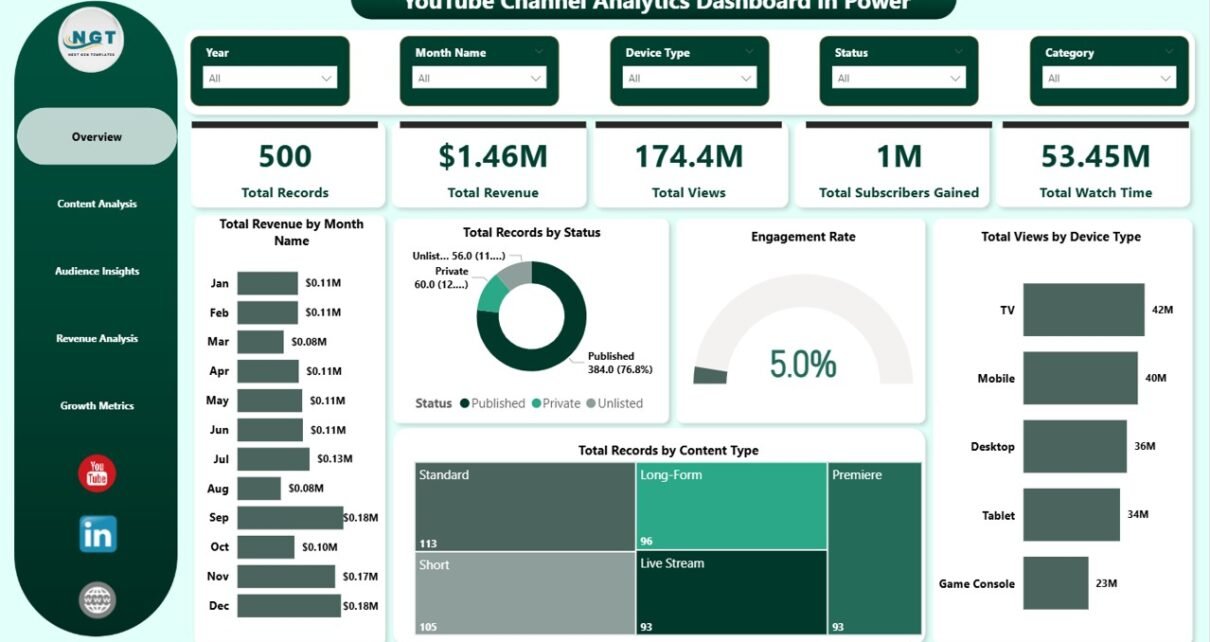
1. Overview Page
The Overview page serves as the central hub of the YouTube Channel Analytics Dashboard in Power BI. At the top, you’ll find high-level KPI cards displaying Total Records, Total Revenue, Total Views, Total Subscribers Gained, and Total Watch Time. Below these cards, interactive charts show Total Revenue by Month Name, Total Records by Status, Engagement Rate, Total Views by Device Type, and Total Records by Content Type. Multiple slicers are placed on this page so you can quickly filter the entire dashboard by any dimension.
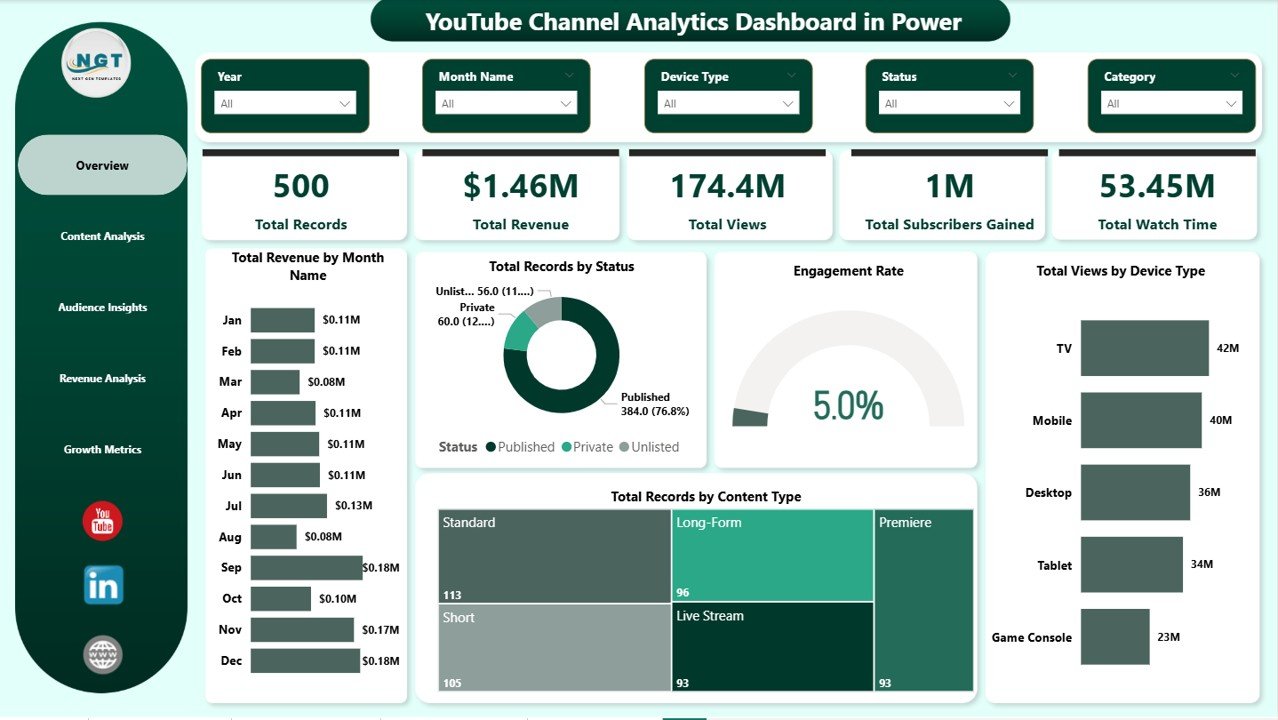
Overview Page
2. Content Analysis
The Content Analysis page helps you understand which types of content perform best on your channel. It includes visualizations for Total Revenue by Content Type, Total Views by Audience Age Group, and Engagement Rate by Content Type. This page is essential for identifying your highest-performing content formats and optimizing your upload strategy to maximize both views and revenue.
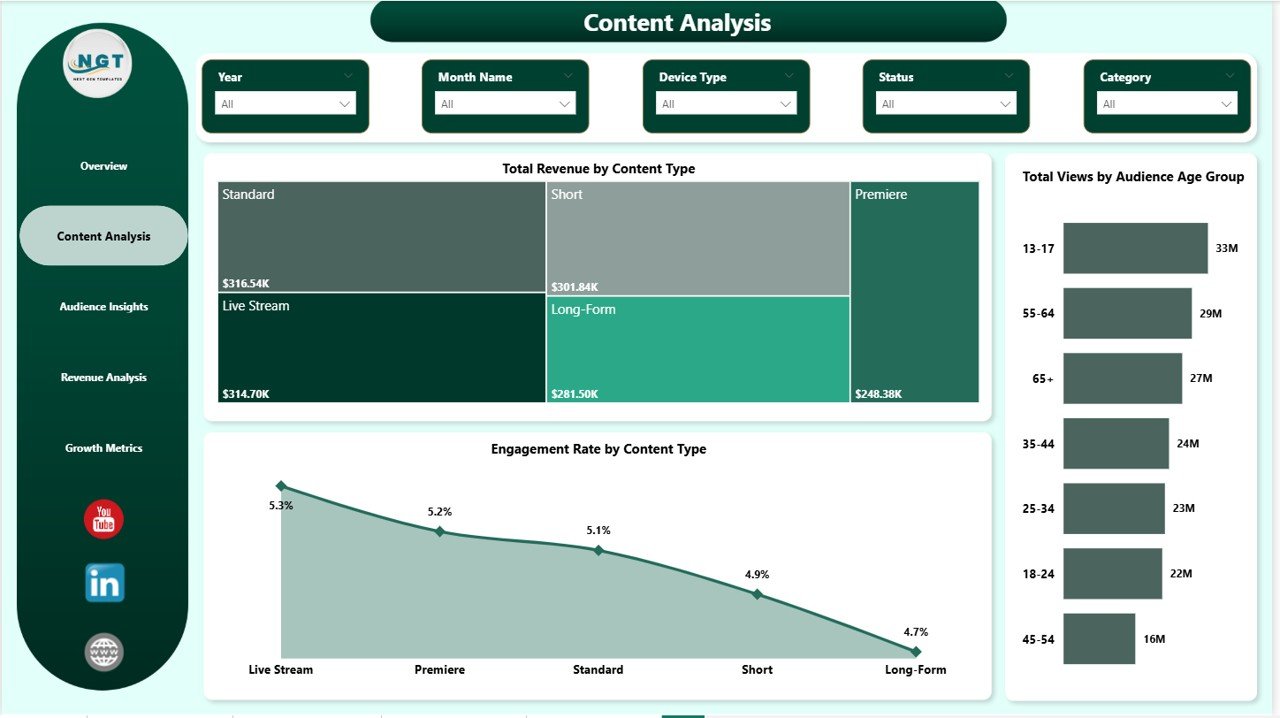
Content Analysis
3. Audience Insights
The Audience Insights page provides a deep dive into your viewer demographics and traffic patterns. Charts for Total Revenue by Audience Age Group, Total Views by Traffic Source, and Engagement Rate by Category reveal where your audience comes from and which segments generate the most value. Use these insights to tailor your content strategy and target the right viewer segments.
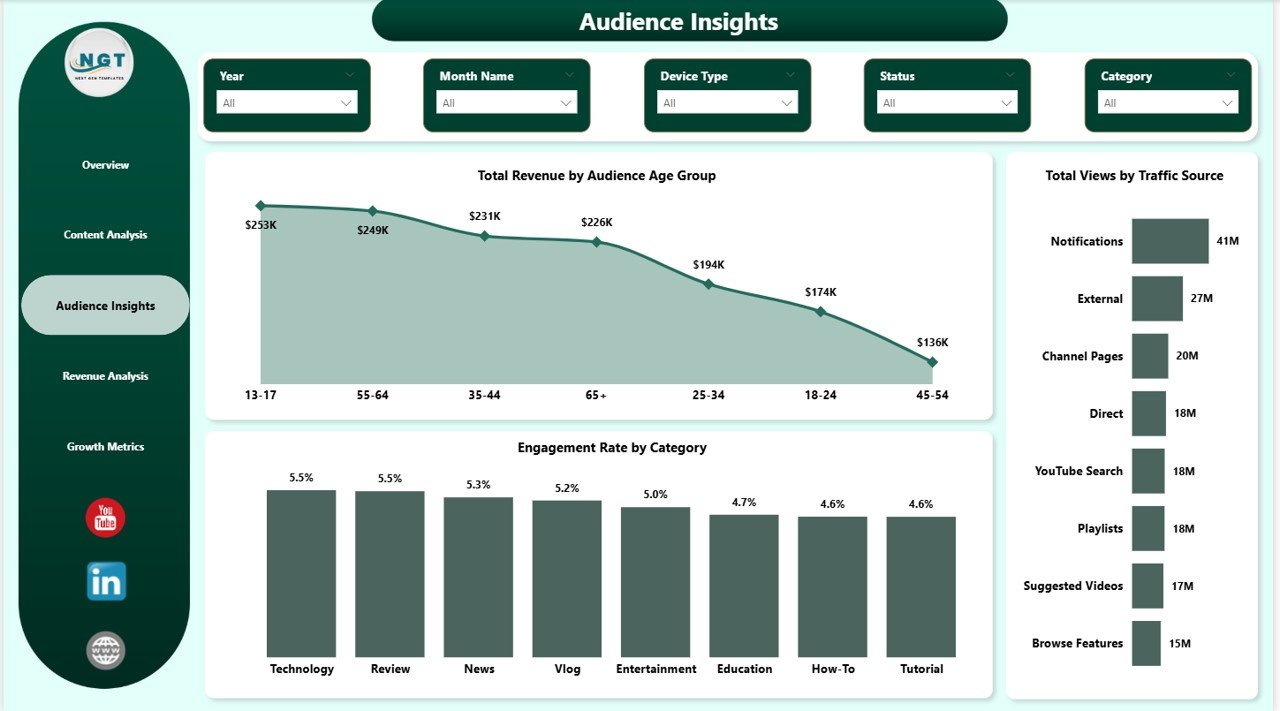
Audience Insights
4. Revenue Analysis
The Revenue Analysis page is dedicated to your channel’s monetization performance. It visualizes Total Revenue by Category, Total Revenue by Traffic Source, and Total Revenue by Device Type. This page helps you pinpoint exactly which categories, traffic channels, and devices contribute most to your earnings so you can double down on what works.
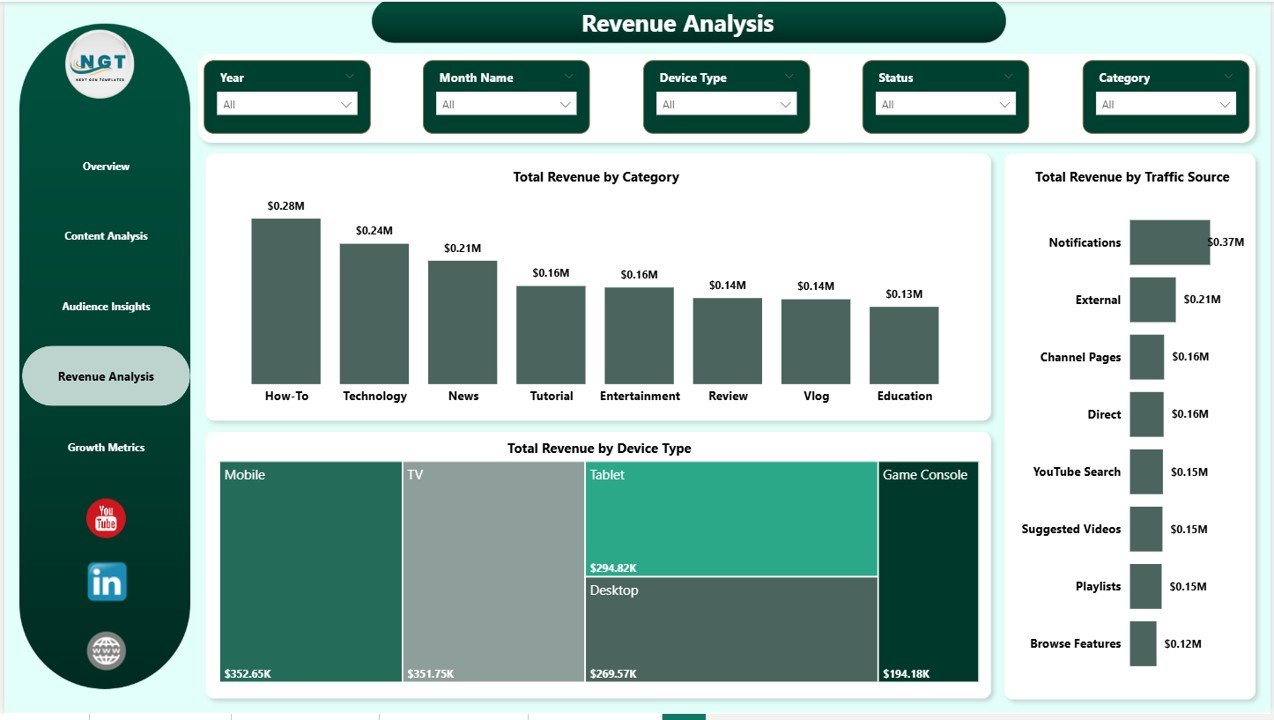
Revenue Analysis
5. Growth Metrics
The Growth Metrics page tracks your channel’s subscriber trajectory over time. It features Total Subscribers Gained by Content Type, Total Subscribers Gained by Category, and Total Subscribers Gained and Net Subscriber Growth by Month Name. This page is critical for understanding growth patterns and planning long-term content strategies that drive sustainable subscriber acquisition.
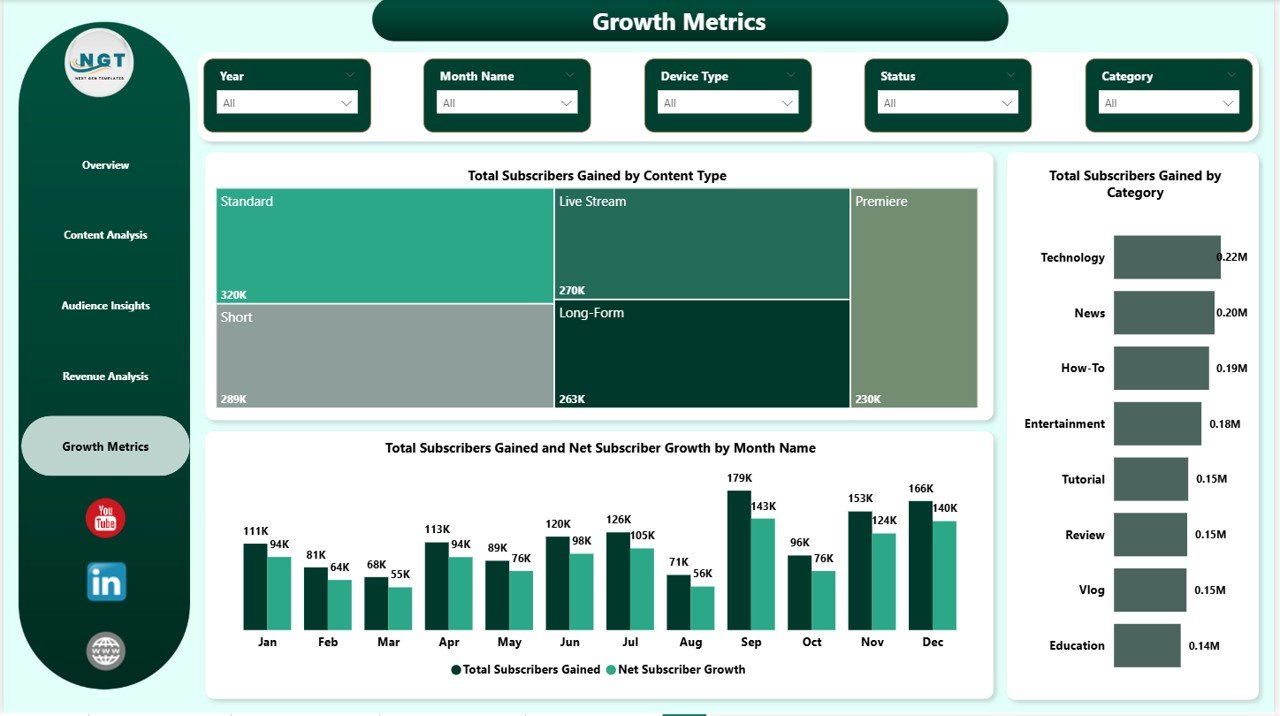
Growth Metrics
Advantages of the YouTube Channel Analytics Dashboard in Power BI
- Saves Hours of Manual Reporting — Replace spreadsheet-based YouTube reporting with automated, interactive visuals that update with a single data refresh
- Multi-Dimensional Analysis — Unlike YouTube Studio’s built-in analytics, this dashboard lets you cross-analyze revenue, views, engagement, and growth across content types, age groups, traffic sources, and devices simultaneously
- Professional Presentation-Ready — Share polished reports with clients, sponsors, or stakeholders directly from Power BI Service without creating separate slide decks
- Scalable for Multi-Channel Management — Agencies can adapt this template for multiple client channels by swapping data sources
- No Coding Required — Simply replace the sample data with your YouTube analytics export and all visuals update automatically
For a spreadsheet-based alternative, check out the YouTube Channel Analytics Dashboard in Excel which provides similar analytics in an Excel environment. You can also read our blog on the YouTube Channel Analytics Dashboard in Excel for a detailed walkthrough.
Opportunities for Improvement
- Live API Connection — Connect directly to the YouTube Analytics API for real-time data refresh instead of manual CSV imports
- Competitor Benchmarking — Add a comparison page to benchmark your channel metrics against industry averages or competitor channels
- Video-Level Drill-Down — Create a detail page that shows performance metrics for individual videos with thumbnail previews
- Custom Date Ranges — Add relative date slicers (Last 7 Days, Last 30 Days, Year-to-Date) for quicker time-based filtering
- Predictive Analytics — Incorporate forecasting visuals using Power BI’s built-in analytics features to project future subscriber growth and revenue trends
Best Practices for Using This Dashboard
- Update Weekly — Refresh your data at least once a week to keep KPIs current and spot trends early
- Focus on Engagement Rate — Views alone don’t tell the full story; monitor engagement rate alongside revenue to find your most valuable content types
- Cross-Reference Traffic Sources — Use the Audience Insights page to identify which traffic sources (search, suggested, external) drive the highest-value viewers
- Track Subscriber Quality — Compare subscriber growth against revenue on the Growth Metrics page to ensure new subscribers are converting viewers
- Publish to Power BI Service — Share dashboards with team members through Power BI workspaces for collaborative channel management
Explore more analytics dashboards in our Etsy Seller Analytics Dashboard in Power BI and Digital Marketing Campaign Dashboard in HTML for comprehensive digital performance tracking.
Explore Relevant Templates
- YouTube Channel Analytics Dashboard in Excel — Same YouTube analytics power in an Excel spreadsheet format
- Etsy Seller Analytics Dashboard in Power BI — Track Etsy store performance with interactive Power BI visuals
- Digital Marketing Campaign Dashboard in HTML — Monitor all your digital marketing campaigns in one dashboard
- Real Estate Agent Dashboard in Power BI — Professional Power BI analytics for real estate professionals
- Dental Practice Dashboard in Power BI — Healthcare analytics in Power BI for dental practices
Frequently Asked Questions
What KPIs does the YouTube Channel Analytics Dashboard in Power BI track?
The dashboard tracks 5 primary KPIs — Total Records, Total Revenue, Total Views, Total Subscribers Gained, and Total Watch Time — with additional breakdowns across content type, audience age group, traffic source, device type, and category on 5 dedicated pages.
Do I need Power BI Pro to use this template?
No. You can open and customize this template using Power BI Desktop, which is completely free to download from Microsoft. Power BI Pro is only needed if you want to publish and share dashboards with others through Power BI Service.
Can I connect this dashboard to live YouTube data?
Yes. While the template comes with sample data, you can connect it to the YouTube Analytics API or import data from YouTube Studio exports. Once connected, use Power BI’s scheduled refresh to keep your dashboard updated automatically.
What is the best way to analyze YouTube channel performance in Power BI?
The best approach is using a structured Power BI dashboard like the YouTube Channel Analytics Dashboard by NextGenTemplates. It organizes your data into 5 focused pages — Overview, Content Analysis, Audience Insights, Revenue Analysis, and Growth Metrics — with interactive slicers that let you filter by any dimension instantly.
How do I replace the sample data with my own YouTube data?
Open the .pbix file in Power BI Desktop, go to Transform Data, and replace the sample data source with your own YouTube analytics CSV or connect directly to the YouTube API. All charts, KPI cards, and slicers will update automatically once the new data is loaded.
Is this template suitable for managing multiple YouTube channels?
Yes. Marketing agencies and media companies can duplicate this template for each client channel or combine multiple channel datasets into a single data source with a channel identifier column for cross-channel comparison.
Conclusion
The YouTube Channel Analytics Dashboard in Power BI is the ultimate analytics companion for anyone serious about growing their YouTube presence. With 5 interactive pages covering every aspect of channel performance — from revenue and content analysis to audience insights and subscriber growth — this template eliminates guesswork and puts data-driven decision-making at your fingertips. Download it today and take full control of your YouTube analytics.
Click here to Purchase YouTube Channel Analytics Dashboard in Power BI
Visit our YouTube channel to learn step-by-step video tutorials: