YouTube Channel Analytics Dashboard in Excel is a professionally designed, interactive analytics template that empowers YouTubers, content creators, digital marketers, and social media managers to track video performance, analyze audience demographics, monitor revenue streams, and measure subscriber growth — all within Microsoft Excel. Whether you manage a personal YouTube channel or handle analytics for multiple creator accounts, this YouTube Channel Analytics Dashboard in Excel delivers actionable insights through 5 dedicated analysis pages, dynamic slicers, and pivot-driven charts that update automatically when you refresh your data.
This dashboard template includes an Overview page with high-level KPI cards, a Content Analysis page for breaking down performance by content type, an Audience Insights page for understanding viewer demographics and traffic sources, a Revenue Analysis page for dissecting monetization across multiple dimensions, and a Growth Metrics page for tracking subscriber acquisition trends. With a plug-and-play Data Sheet and a hidden Support Sheet containing all pivot tables, this template is designed for immediate productivity without requiring any VBA, macros, or advanced Excel skills.
Key Features of YouTube Channel Analytics Dashboard in Excel
This Excel dashboard template is packed with powerful analytics capabilities designed specifically for YouTube channel management:
- 5 Interactive Dashboard Pages — Overview, Content Analysis, Audience Insights, Revenue Analysis, and Growth Metrics provide a 360-degree view of your YouTube channel data.
- 4 KPI Cards on Overview — Total Records, Total Views, Total Revenue, and Total Watch Time are displayed prominently for quick reference.
- Dynamic Slicers — Filter data across all dashboard pages by month, category, content type, device type, audience age group, traffic source, and video status with a single click.
- Revenue Tracking Across 6 Dimensions — Analyze revenue by month, content type, category, traffic source, device type, and audience age group to identify your most profitable content segments.
- Audience Demographic Analysis — Understand who watches your videos with engagement percentage breakdowns, traffic source analysis, and subscriber growth patterns.
- Growth Metrics Monitoring — Track subscribers gained by category, content type, and month-over-month trends to forecast channel growth.
- Pivot Table Backend — All charts are powered by pivot tables in a dedicated Support sheet, ensuring automatic updates when data is refreshed.
- No VBA or Macros — Works with standard Excel features including pivot tables, slicers, and charts. Compatible with Excel 2016 and later versions including Microsoft 365.
For creators who also sell on e-commerce platforms, you might find the Etsy Seller Analytics Dashboard in Excel or the Amazon FBA Seller Dashboard in Excel equally valuable for tracking marketplace performance alongside your YouTube analytics.
Dashboard Pages Explained
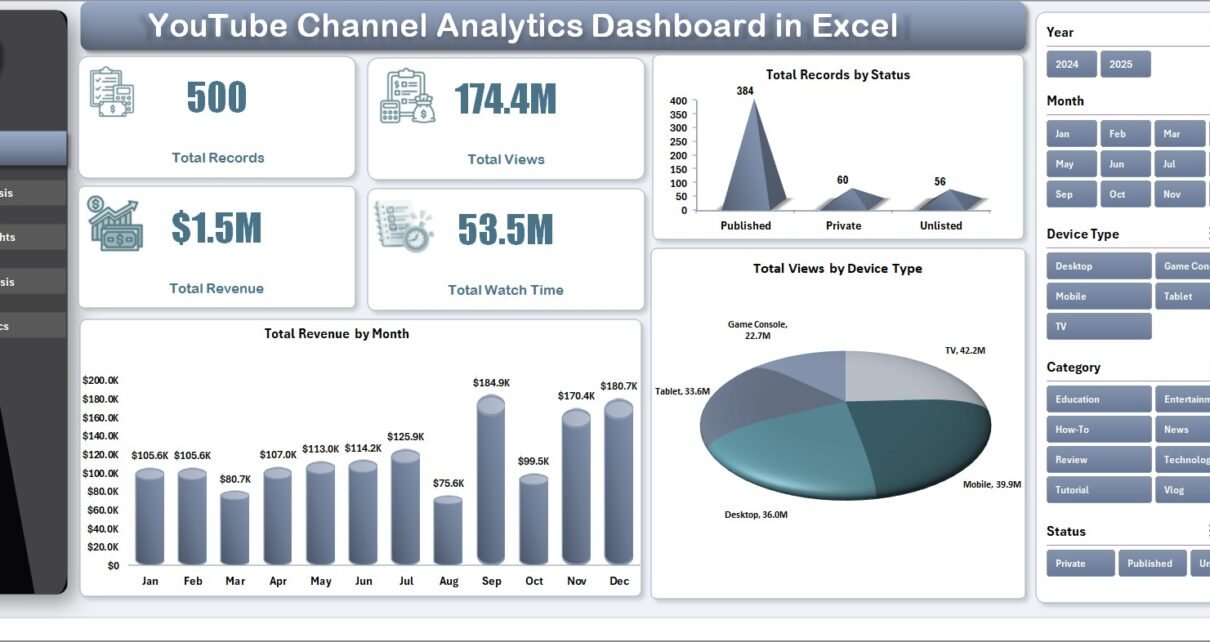
1. Overview Page
The Overview page serves as the command center of your YouTube analytics. At the top, four KPI cards display Total Records, Total Views, Total Revenue, and Total Watch Time — giving you an instant snapshot of your channel’s health. Below the cards, you will find analytical charts including Total Revenue by Month (showing monetization trends over time), Total Records by Status (breaking down video statuses), and Total Views by Device Type (revealing whether your audience watches on desktop, mobile, or tablet). Multiple slicers on this page let you filter the entire dashboard with a single click, making it easy to isolate specific time periods, content categories, or audience segments.
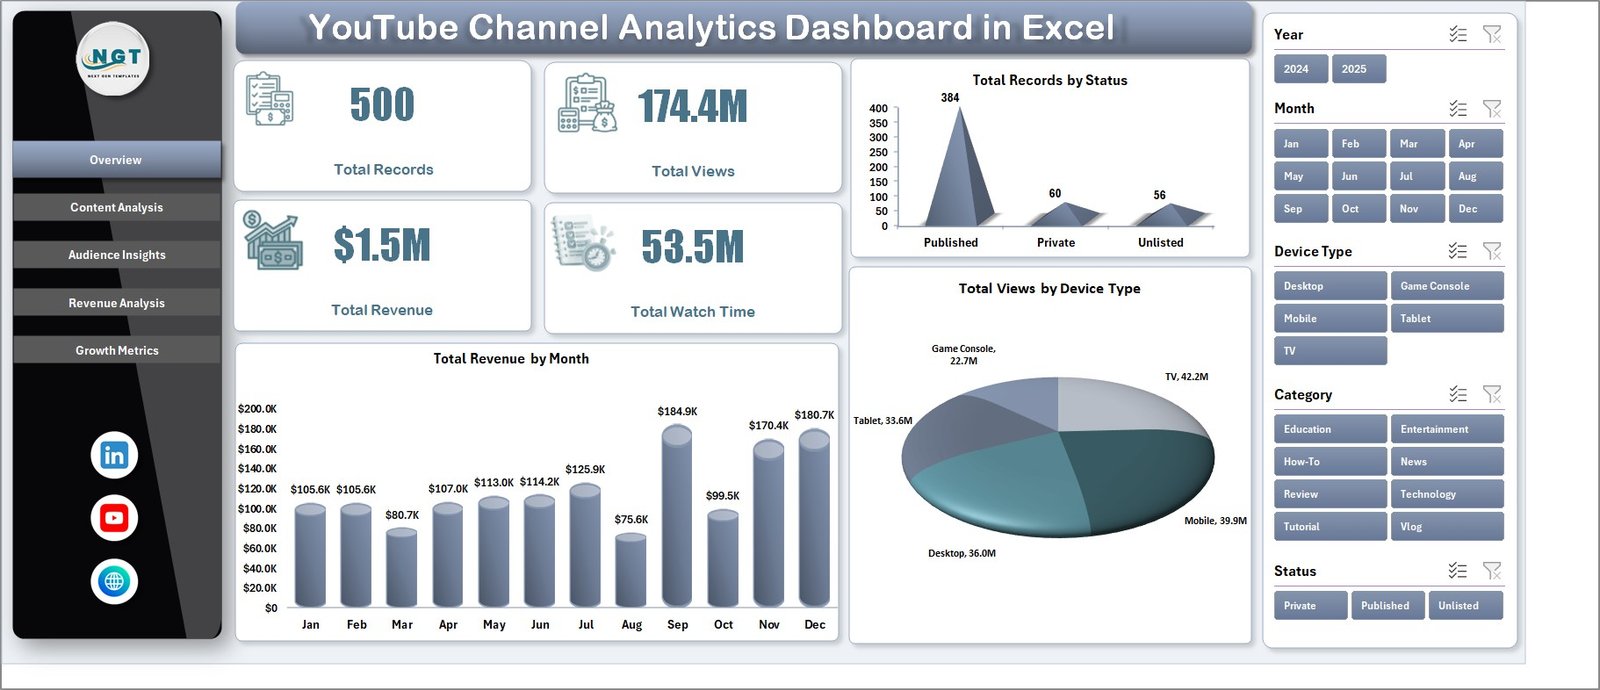
YouTube Channel Analytics Dashboard in Excel
2. Content Analysis
The Content Analysis page dives deep into how different types of content perform on your channel. This page features four key charts: Total Revenue by Content Type reveals which content formats generate the most income, Engagement % by Content Type shows which formats drive the highest audience interaction, Total Views by Audience Age Group helps you understand which demographics prefer which content, and Total Records by Content Type provides a volume overview of your uploads by format. This page is invaluable for content strategy decisions — helping you double down on what works and pivot away from underperforming formats.

Content Analysis
3. Audience Insights
The Audience Insights page reveals who your viewers are and how they discover your content. It includes Total Revenue by Audience Age Group to show which demographics generate the most revenue, Engagement % by Category to identify which video categories resonate most with your audience, Total Views by Traffic Source to understand whether viewers find you through search, suggested videos, external links, or browse features, and Total Subs Gained by Status to track how different video statuses contribute to subscriber growth. This data is critical for tailoring your content strategy to your most valuable audience segments.
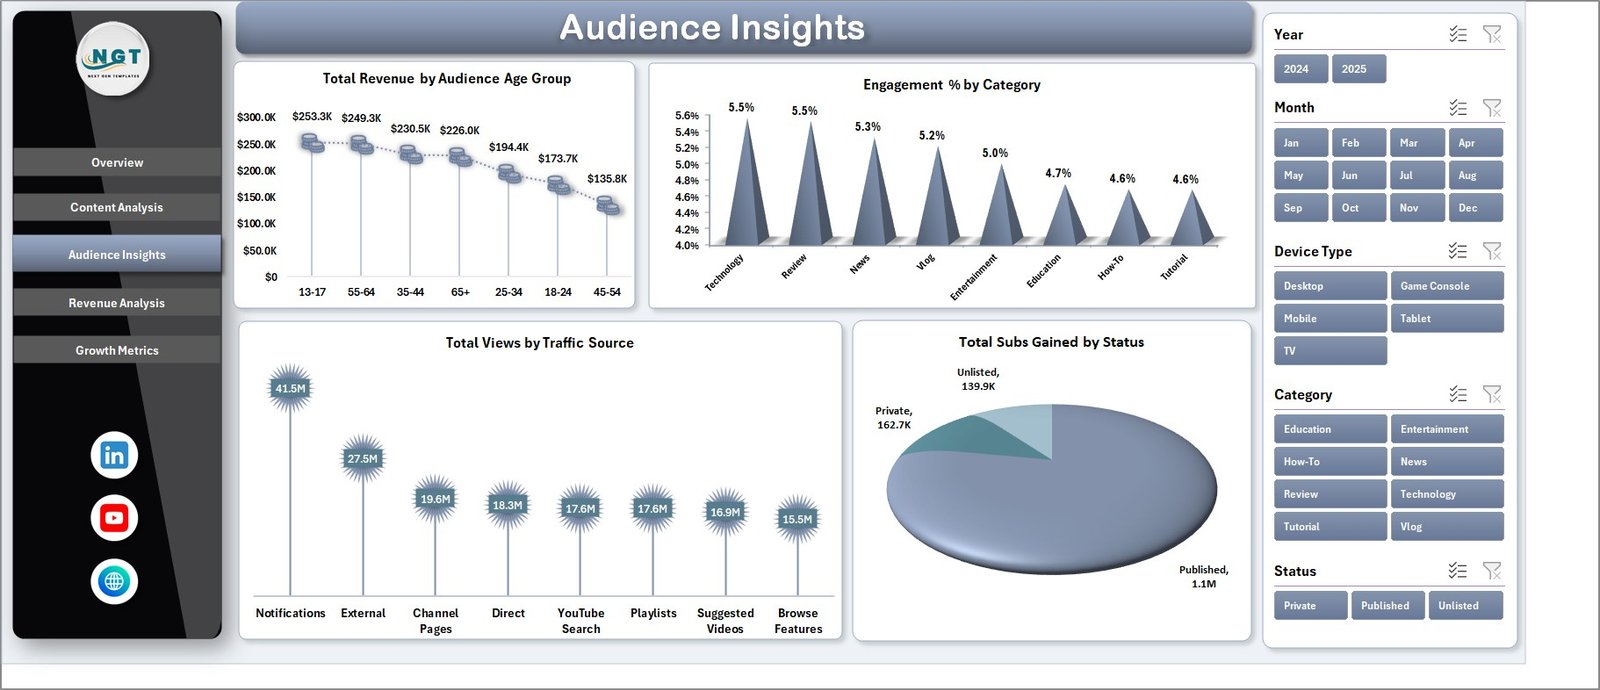
Audience Insights
4. Revenue Analysis
The Revenue Analysis page provides a comprehensive breakdown of your YouTube monetization. It features Total Revenue by Category to show which video categories are most profitable, Total Revenue by Traffic Source to reveal which discovery channels drive the most income, Total Records by Month for tracking upload consistency over time, and Total Revenue by Device Type to understand how viewing platform affects monetization. This page is essential for optimizing your digital marketing and monetization strategy.
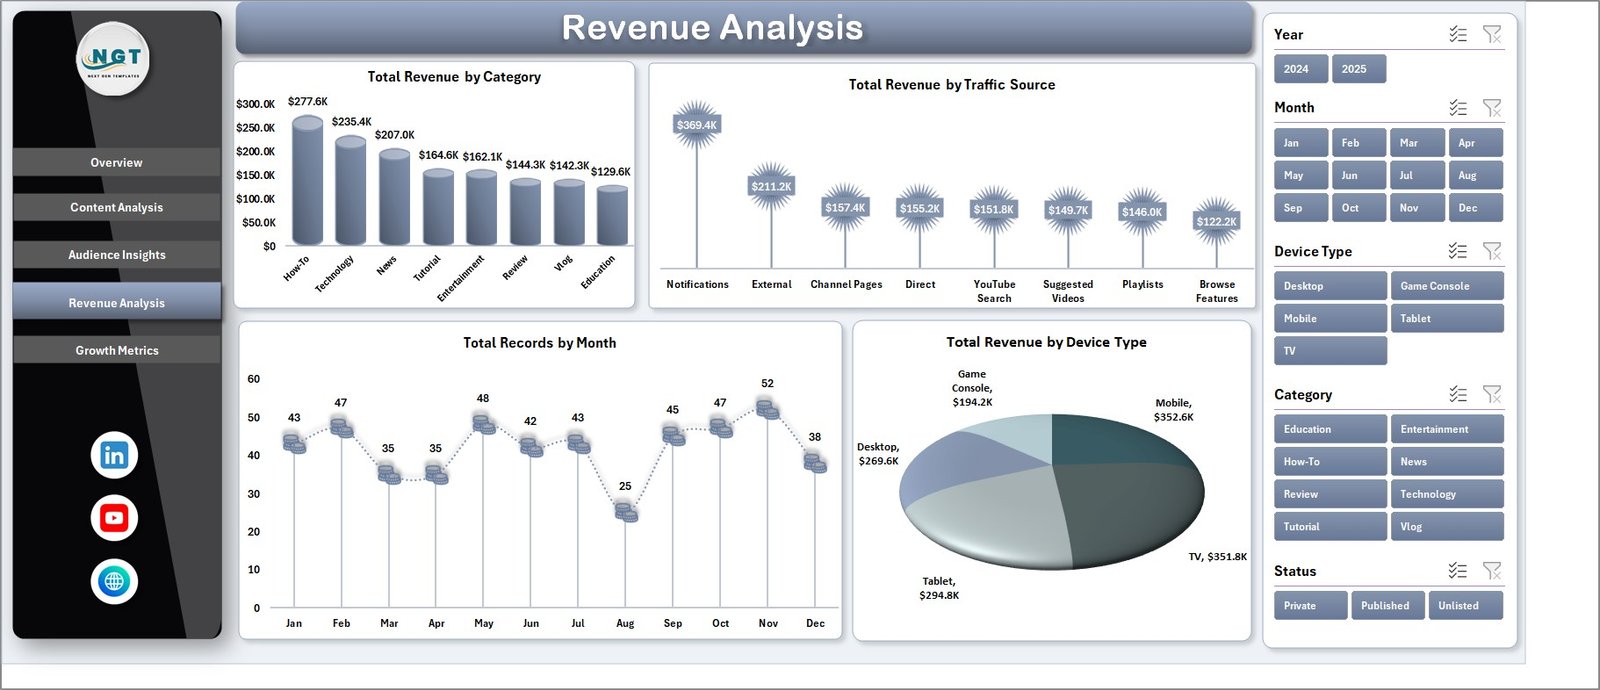
Revenue Analysis
5. Growth Metrics
The Growth Metrics page focuses on subscriber acquisition and channel momentum. It tracks Total Subs Gained by Category to show which video categories attract the most new subscribers, Total Subs Gained by Content Type to reveal which content formats drive growth, and Total Subs Gained vs Month to visualize your subscriber growth trajectory over time. This page helps you identify the content and strategies that fuel channel growth, enabling data-driven decisions about where to invest your creative energy.
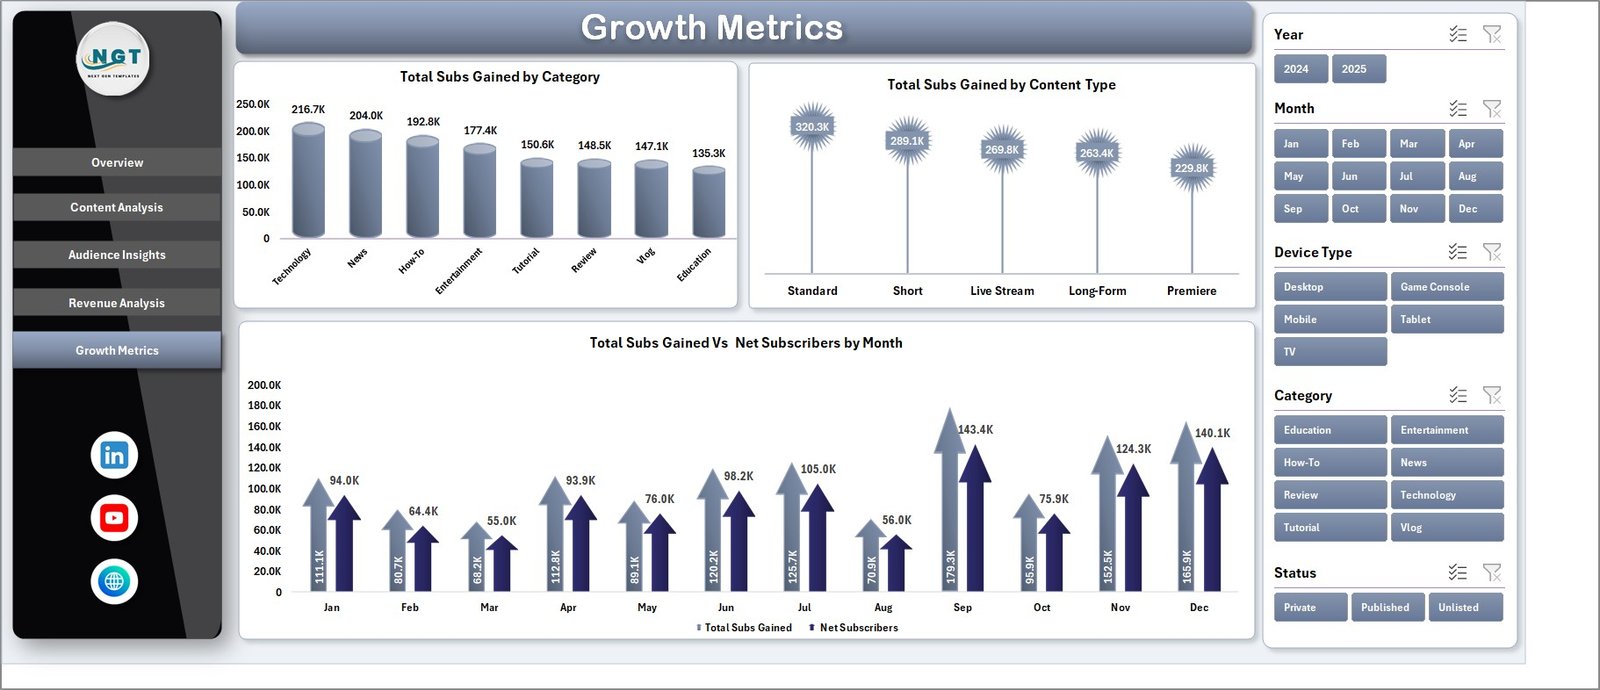
Growth Metrics
6. Data Sheet
The Data Sheet is where you input your YouTube analytics data. It comes pre-populated with sample data so you can see how the dashboard works immediately. To use it with your own data, simply replace the sample entries with your YouTube analytics export — keeping the same column format — and then refresh all pivot tables. The data columns include fields for video details, views, revenue, watch time, subscribers gained, content type, category, device type, traffic source, audience age group, status, and date information.

Data Sheet Tab
7. Support Sheet
The Support Sheet contains all the pivot tables that power every chart across the 5 dashboard pages. You do not need to modify anything here. After updating your data in the Data Sheet, simply navigate to the Data tab in the Excel Ribbon and click Refresh All. Every pivot table will recalculate and every chart will update automatically. You can keep this sheet hidden for a cleaner workbook appearance.
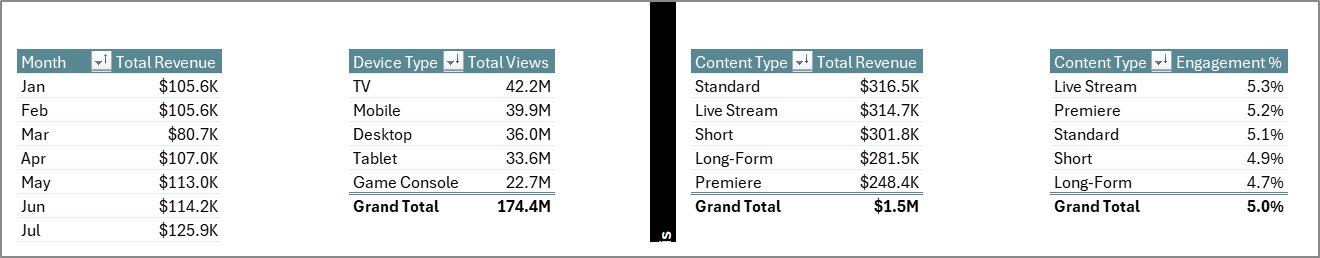
Support Sheet Tab
Advantages of YouTube Channel Analytics Dashboard in Excel
- All-in-One Analytics Hub — Consolidates views, revenue, audience demographics, content performance, and subscriber growth into a single Excel workbook.
- Zero Learning Curve — No formulas to write, no macros to enable. Just paste your data and click Refresh All.
- Offline Access — Unlike web-based analytics tools, this Excel dashboard works offline on your desktop or laptop anytime.
- Customizable and Extendable — You can modify pivot tables, add new charts, or create additional analysis pages as your channel grows.
- Cost-Effective — A one-time purchase that replaces expensive monthly subscription analytics tools.
- Multi-Channel Support — Consolidate data from multiple YouTube channels by adding a channel identifier column.
Opportunities for Improvement
- Automated Data Import — Currently requires manual data entry; future versions could integrate with YouTube Studio analytics export for automated imports.
- Competitor Benchmarking — Adding a competitor comparison sheet would help creators benchmark their performance against similar channels.
- Video-Level Drill-Down — Adding individual video performance cards would help identify top and underperforming videos at a glance.
- Thumbnail Click-Through Rate Tracking — Including CTR analysis would help creators optimize their video thumbnails.
Best Practices for Using This YouTube Analytics Dashboard
- Update Weekly — Export your YouTube Studio analytics data weekly and paste it into the Data Sheet for the most current insights.
- Use Slicers Strategically — Combine multiple slicer filters to drill down into specific content segments, time periods, or audience demographics.
- Track Month-Over-Month Trends — Use the Growth Metrics and Revenue Analysis pages to identify seasonal patterns and growth trajectories.
- Compare Content Types — Use the Content Analysis page to determine which video formats (tutorials, vlogs, reviews, shorts) perform best for your audience.
- Share Reports — Use the Overview page as a snapshot report for sponsors, collaborators, or management by printing or exporting to PDF.
For more Excel dashboard templates, explore our complete collection covering sales, HR, finance, marketing, and more.
Explore Relevant Templates
- Etsy Seller Analytics Dashboard in Excel — Track Etsy store performance with detailed sales, traffic, and conversion analytics in Excel.
- Amazon FBA Seller Dashboard in Excel — Monitor Amazon FBA sales, inventory, fees, and profitability in one powerful Excel dashboard.
- SaaS Metrics Dashboard in Excel — Analyze SaaS business KPIs including MRR, churn, LTV, and customer acquisition metrics.
- Digital Marketing Campaign Dashboard in Google Sheets — Track digital marketing campaigns across channels with this interactive Google Sheets dashboard.
Frequently Asked Questions
What KPIs does the YouTube Channel Analytics Dashboard in Excel track?
The YouTube Channel Analytics Dashboard in Excel tracks 4 key performance indicators on the Overview page: Total Records, Total Views, Total Revenue, and Total Watch Time. Across all 5 dashboard pages, it also analyzes engagement percentage, subscriber growth by category and content type, revenue by 6 dimensions (month, content type, category, traffic source, device type, audience age group), and views by traffic source and device type.
Do I need advanced Excel skills to use this YouTube dashboard?
No. This dashboard requires no formulas, VBA, or macros. Simply replace the sample data in the Data Sheet with your own YouTube analytics export, go to the Data tab in the Excel Ribbon, and click Refresh All. Every pivot table, chart, and KPI card updates automatically.
What Excel version is compatible with this YouTube analytics dashboard?
This dashboard works with Microsoft Excel 2016, Excel 2019, Excel 2021, and Excel for Microsoft 365. It uses standard pivot tables and slicers that are supported in all modern Excel versions. No external add-ins are required.
Can I track multiple YouTube channels in one dashboard?
Yes. You can consolidate analytics data from multiple YouTube channels into the Data Sheet by adding a channel name column to your data. Then use the slicers to filter by individual channels or view aggregated data across all channels.
How do I get my YouTube data into this Excel dashboard?
Export your analytics from YouTube Studio or Google Analytics. Format your export to match the sample column structure in the Data Sheet tab, paste it in, and click Refresh All from the Data ribbon. The entire dashboard updates automatically.
What is the best Excel template for tracking YouTube channel performance?
The YouTube Channel Analytics Dashboard in Excel from NextGenTemplates is one of the most comprehensive options available. It includes 5 interactive dashboard pages, 4 KPI cards, dynamic slicers for filtering, revenue analysis across 6 dimensions, audience demographic insights, and growth metrics tracking — all powered by pivot tables for automatic updates.
Conclusion
The YouTube Channel Analytics Dashboard in Excel is a must-have tool for any content creator or digital marketer serious about growing their YouTube presence. With 5 interactive analysis pages, dynamic filtering through slicers, and automatic data refresh via pivot tables, this template transforms raw YouTube data into clear, actionable insights. Whether you are tracking revenue trends, analyzing audience behavior, evaluating content performance, or monitoring subscriber growth, this dashboard gives you everything you need in one Excel workbook.
Click here to Purchase YouTube Channel Analytics Dashboard in Excel
Visit our YouTube channel to learn step-by-step video tutorials: Youtube.com/@PK-AnExcelExpert