New: NextGenTemplates Academy - video courses on Excel formulas with AI and Pivot Tables & dashboards. Early-bird: 20% off with code EARLYBIRD20 - first 20 orders only. See the courses →
  • Learn Excel (Free Course)
    • 1. Shortcut Keys
    • 2. Fill & Flash Fill
    • 3. Find & Replace
    • 4. Sort & Filter
    • 5. Formulas & Functions
    • 6. Data Validation
    • 7. Conditional Formatting
    • 8. Basic Charts
    • 9. Advanced Charts
    • 10. Pivot Tables
    • 11. Excel Dashboards
    • 12. VBA Course
    • 13. Excel Formulas with AI
  • Templates
  • Tutorials
    • Charts and Visualization
    • VBA
    • Excel Tips and Tricks
    • Excel Dashboards
    • Power Pivot & DAX
  • Power BI
  • Template Store
    • Ready to Use Templates
  • Courses
  • Academy
    • Excel + AI Mastery: 100 Formulas
    • Excel Pivot Tables & Dashboards
  • About Us
  • Contact Us

PK: An Excel Expert

Transforming Data into Decisions

Tag: Linked Picture

3D Waffle Chart in Excel
Charts and Visualization

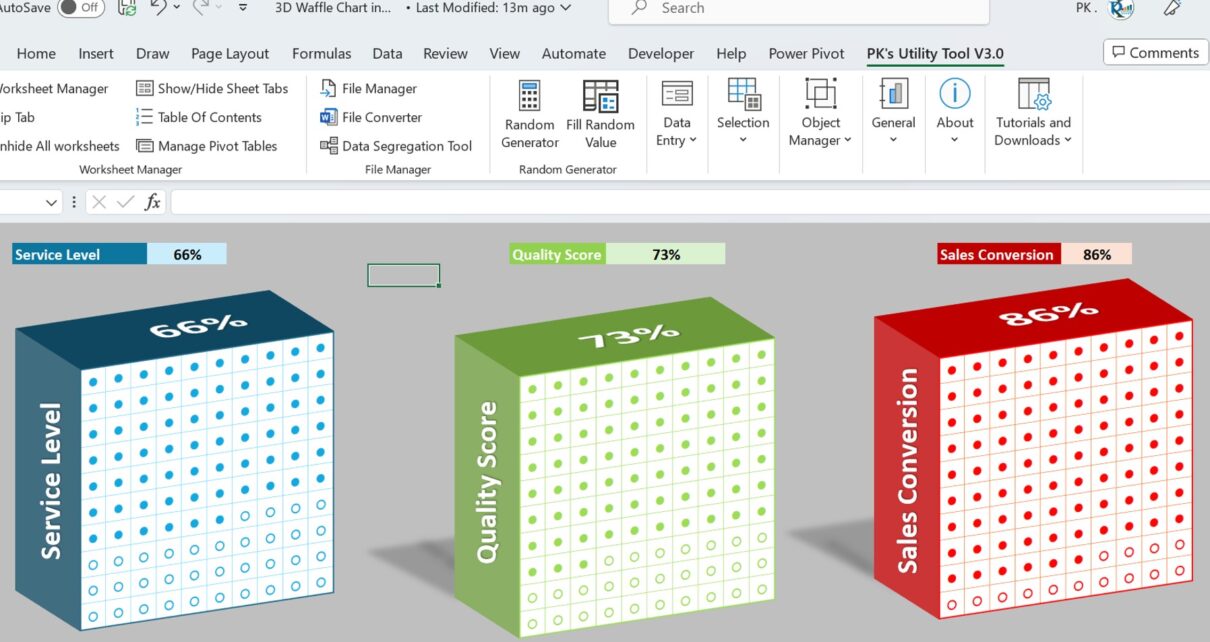
Mind-Blowing Excel Hack: 3D Waffle Charts in Just Steps

August 20, 2023March 1, 2025 PKComments Off on Mind-Blowing Excel Hack: 3D Waffle Charts in Just Steps
Introduction to 3D Waffle Charts in Excel Did you know that you can create stunning 3D waffle charts directly in Excel? This underutilized chart type not only looks great but
Read More
Beer Mug Chart
Charts and Visualization

Beer Mug Graph in excel

March 3, 2022October 10, 2026 PKComments Off on Beer Mug Graph in excel
Beer mug chart is a beautiful infographic representation for KPI metrics in percentage like - Target Achieved%, Service Level%, Quality Score etc.   Beer Mug Graph in excel [caption id="attachment_56543"
Read More
Spin Wheel in Excel
Templates

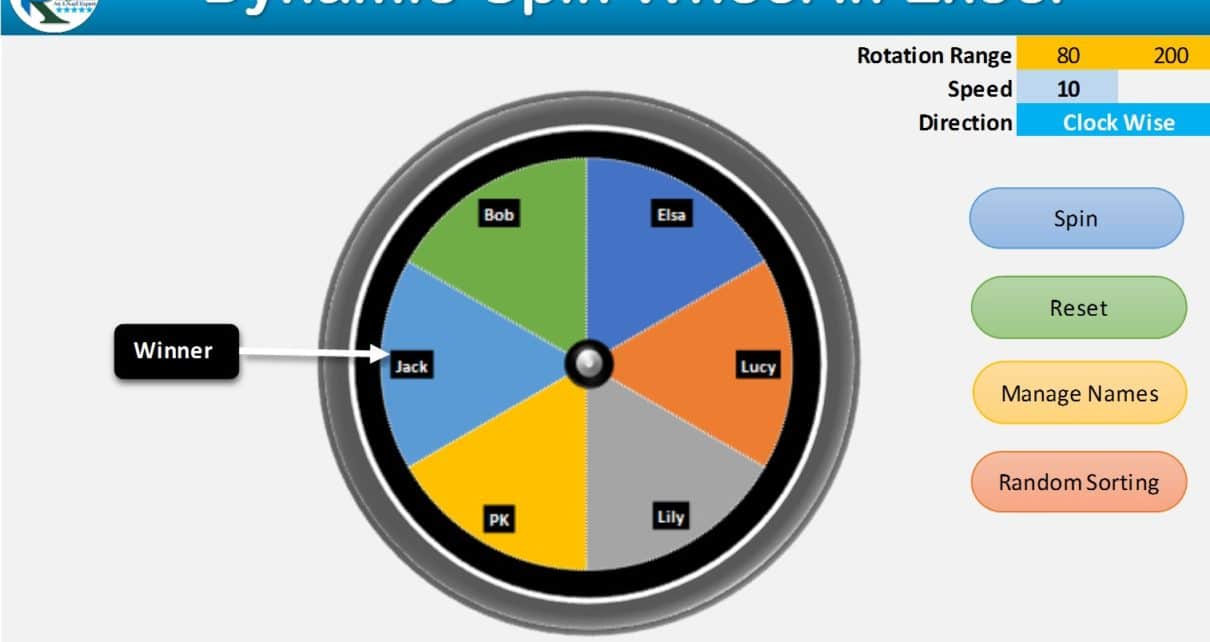
Dynamic Spin Wheel in Excel

June 14, 2020February 20, 2025 PKComments Off on Dynamic Spin Wheel in Excel
In this article, we have created a dynamic spin wheel in Excel. You can add or remove the name in spin wheel dynamically. You can change the rotation range, speed
Read More
3D KPI Indicator in Excel: Red, Yellow, Green Traffic Light
Charts and Visualization

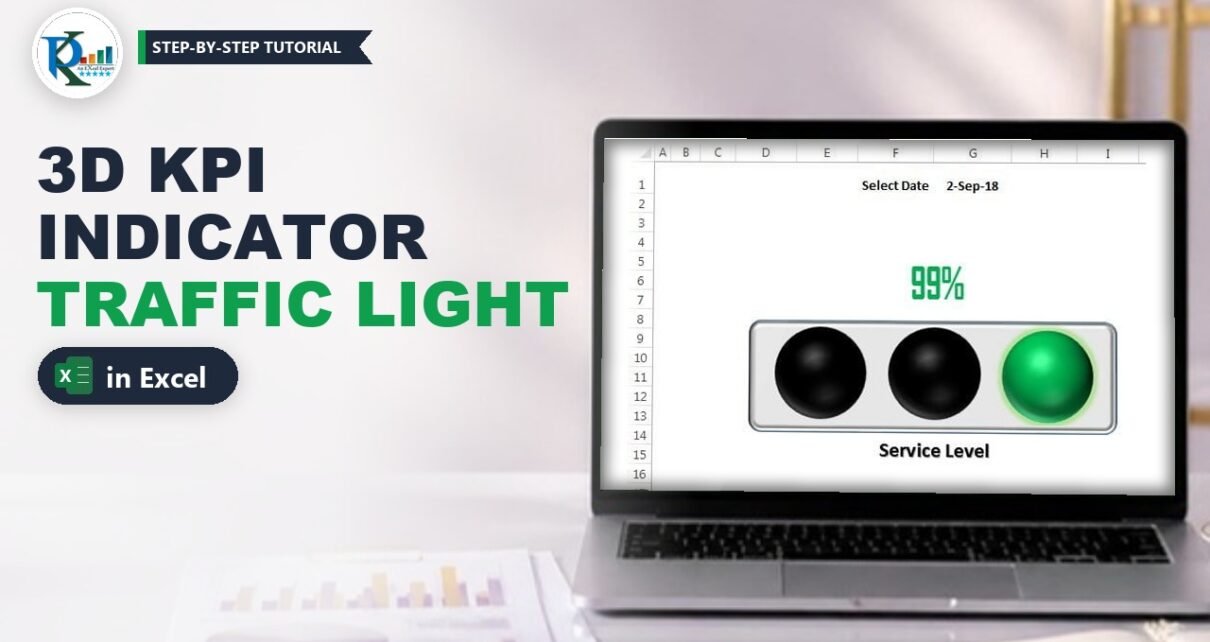
3D KPI Indicator in Excel: Red, Yellow, Green Traffic Light

September 30, 2018October 9, 2026 PK0
A 3D KPI indicator in Excel works like a traffic light for your metrics: three glossy balls in a grey frame, and only one lights up, red, yellow or green,
Read More
Picture Effect in Excel Chart: 3D Charts with the Camera Tool
Charts and Visualization

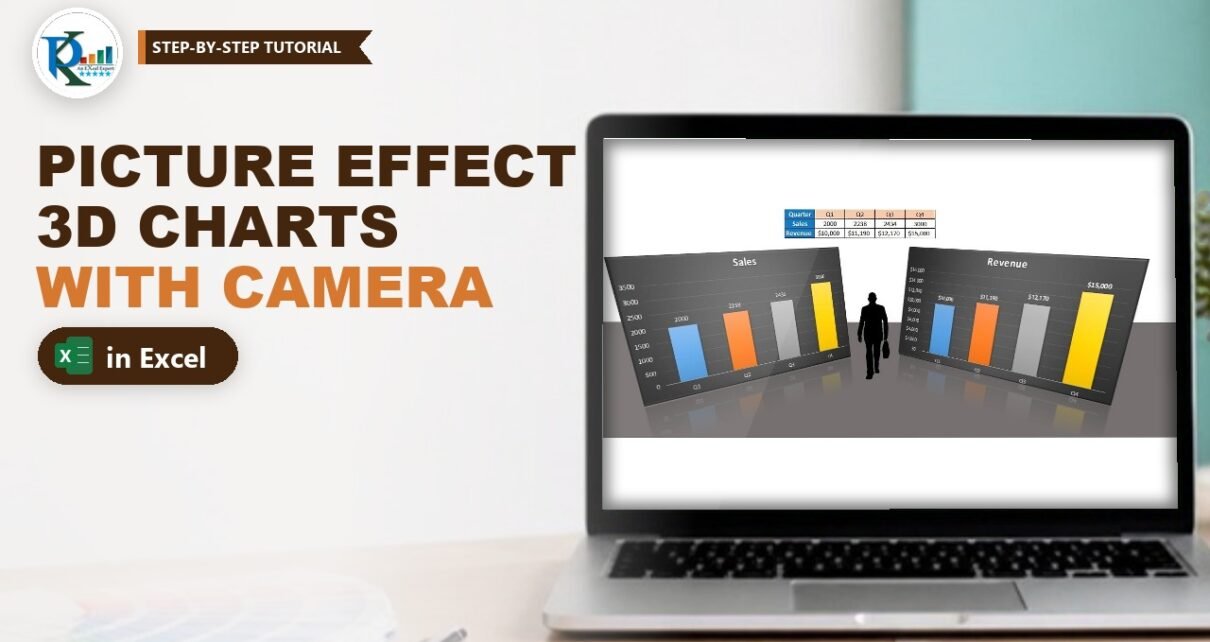
Picture Effect in Excel Chart: 3D Charts with the Camera Tool

July 30, 2018October 9, 2026 PK0
A picture effect in an Excel chart turns a flat column chart into something that looks like a 3D display board standing on a floor, with a reflection underneath. Excel
Read More
  • Learn Excel (Free Course)
    • 1. Shortcut Keys
    • 2. Fill & Flash Fill
    • 3. Find & Replace
    • 4. Sort & Filter
    • 5. Formulas & Functions
    • 6. Data Validation
    • 7. Conditional Formatting
    • 8. Basic Charts
    • 9. Advanced Charts
    • 10. Pivot Tables
    • 11. Excel Dashboards
    • 12. VBA Course
    • 13. Excel Formulas with AI
  • Templates
  • Tutorials
    • Charts and Visualization
    • VBA
    • Excel Tips and Tricks
    • Excel Dashboards
    • Power Pivot & DAX
  • Power BI
  • Template Store
    • Ready to Use Templates
  • Courses
  • Academy
    • Excel + AI Mastery: 100 Formulas
    • Excel Pivot Tables & Dashboards
  • About Us
  • Contact Us
Copyright © 2023 PK-AnExcelExpert.com - Privacy Policy