New: NextGenTemplates Academy - video courses on Excel formulas with AI and Pivot Tables & dashboards. Early-bird: 20% off with code EARLYBIRD20 - first 20 orders only.See the courses →
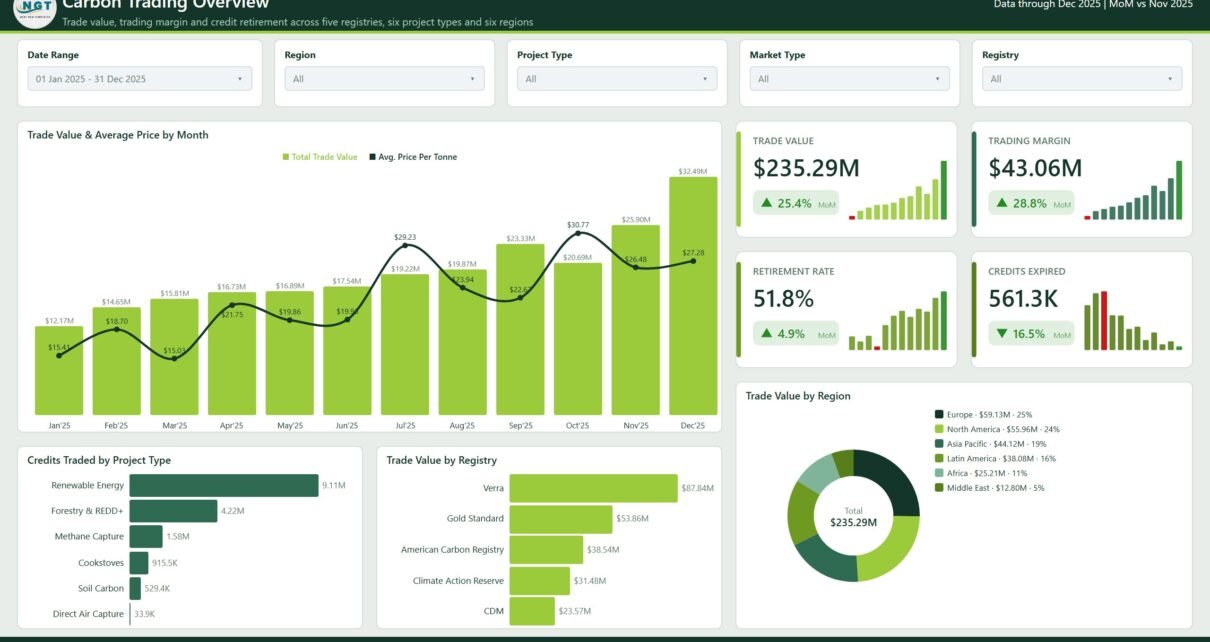
PKComments Off on Carbon Trading Dashboard in Power BI
If your desk already keeps a carbon credit trade log in a spreadsheet, the monthly reporting pass is usually the tedious part - the same pivot tables rebuilt, the same
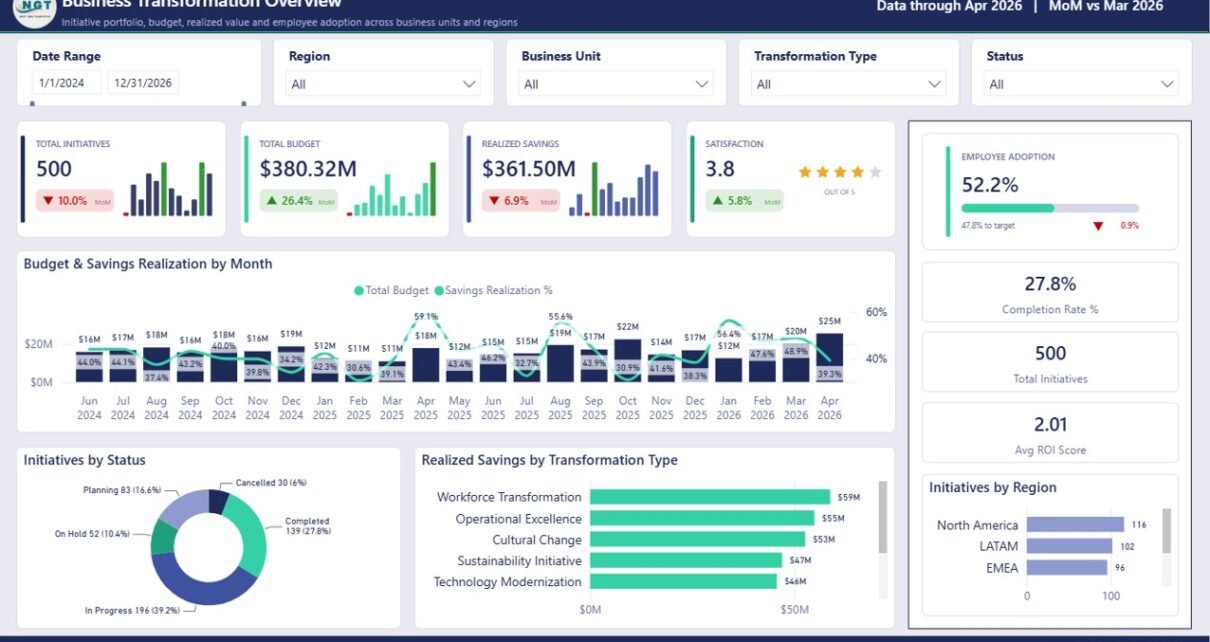
PKComments Off on Business Transformation Dashboard in Power BI
The Business Transformation Dashboard in Power BI is a finished .pbix report with 5 interactive pages, 47 DAX measures, 23 KPI cards and 5 synced slicers on every page. It
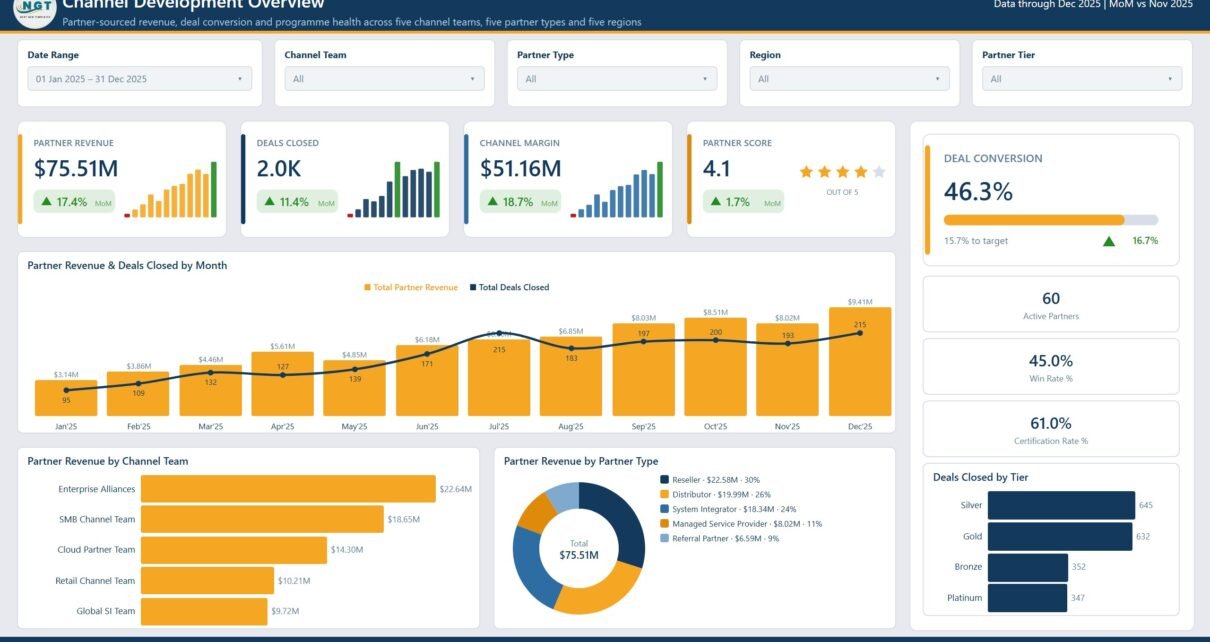
PKComments Off on Channel Development Teams Dashboard in Power BI
The Channel Development Teams Dashboard in Power BI is a five-page report built on 42 DAX measures and a 21-column partner engagement table. It ships with 500 demo rows covering
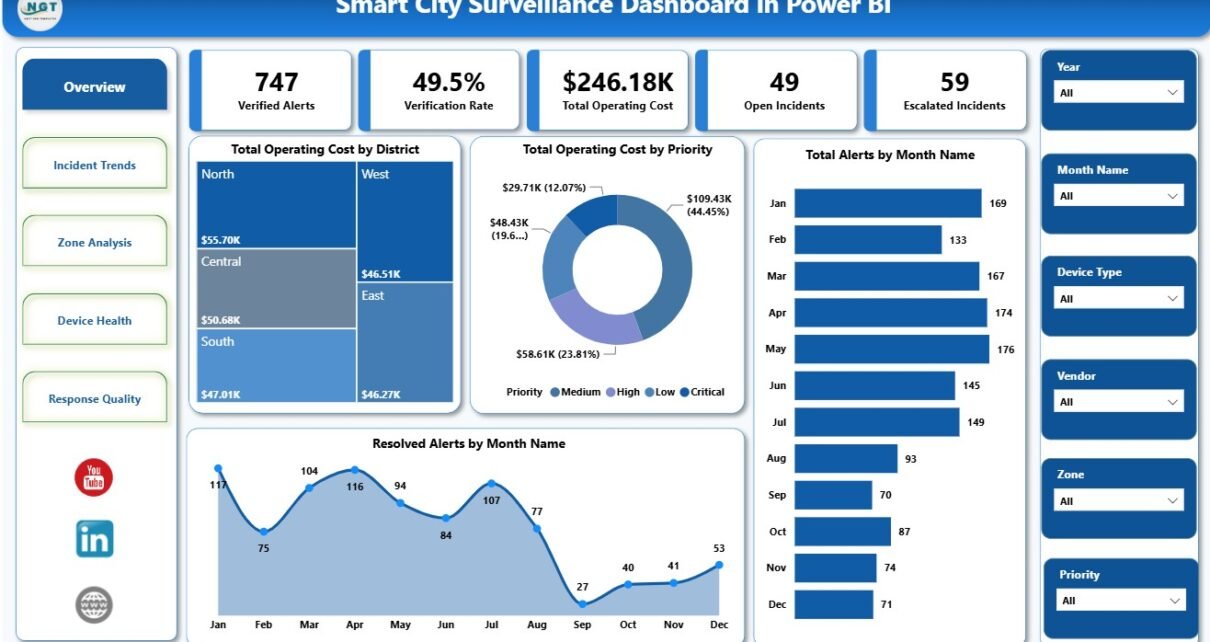
PKComments Off on Smart City Surveillance Dashboard in Power BI
Smart City Surveillance Dashboard in Power BI is designed for surveillance operations, smart city control rooms, CCTV monitoring teams, public safety analysts, and security vendors that need a clean reporting
PKComments Off on Agri Insurance Dashboard in Power BI
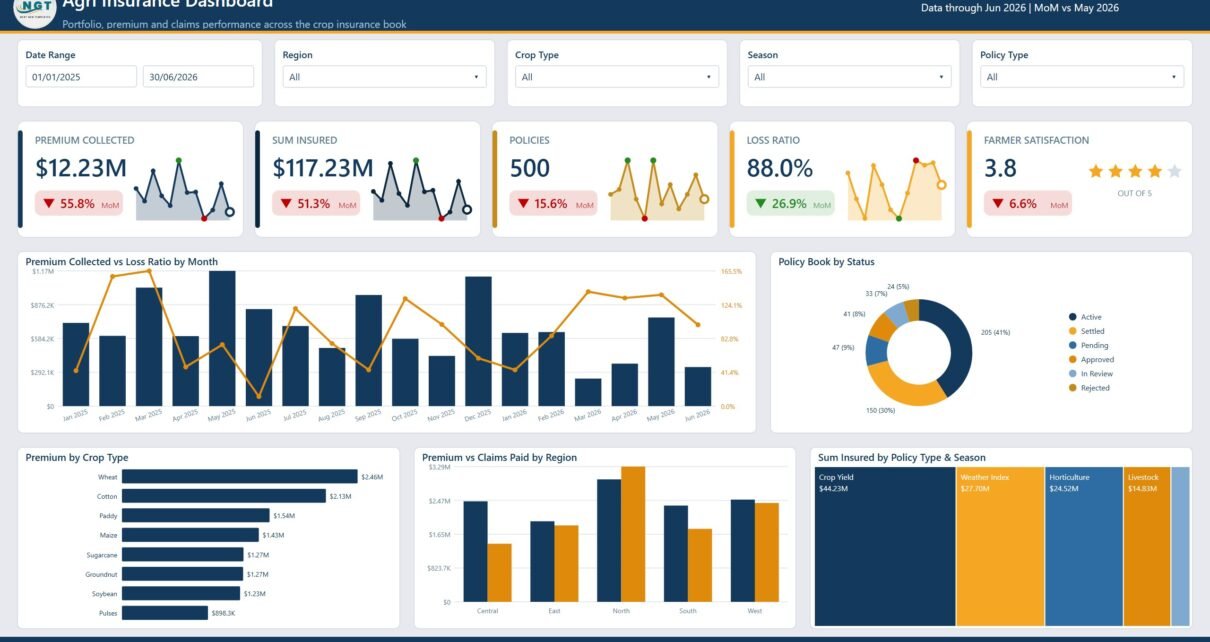
Agri Insurance Dashboard in Power BI is a ready-to-use reporting template for agricultural insurers, crop insurance program managers, subsidy teams, brokers, cooperatives, and analysts who need one place to review
PKComments Off on Ship Management Services Dashboard in Power BI
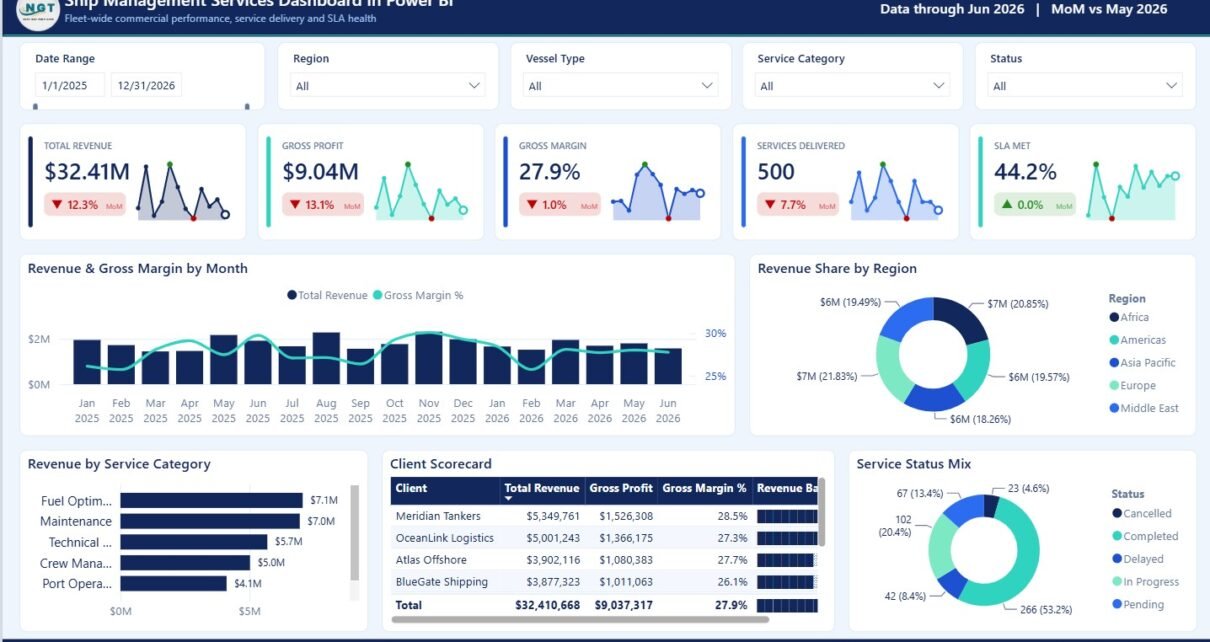
Ship Management Services Dashboard in Power BI helps maritime service teams review revenue, margin, service delivery, SLA compliance, fleet activity, client value, incidents, inspection scores, and monthly trends across 5
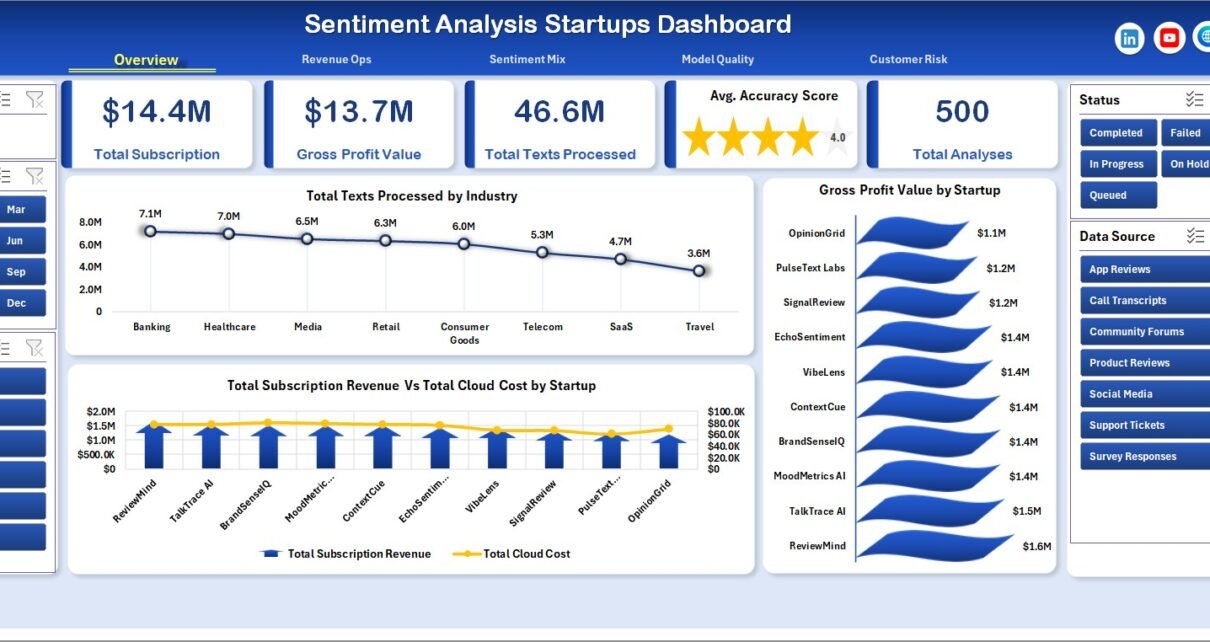
PKComments Off on Sentiment Analysis Startups Dashboard in Power BI
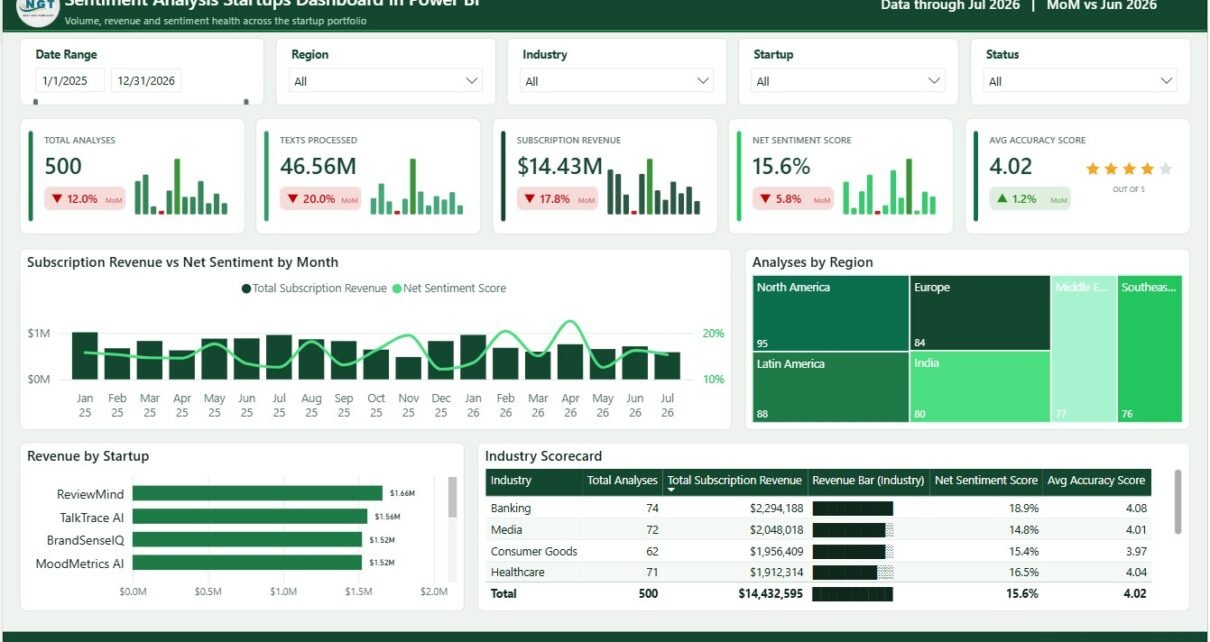
Sentiment Analysis Startups Dashboard in Power BI is a ready-to-use report template for AI SaaS founders, NLP product teams, customer success leaders, revenue operations managers, and BI consultants who need one
PKComments Off on Ship Management Services Dashboard in Excel
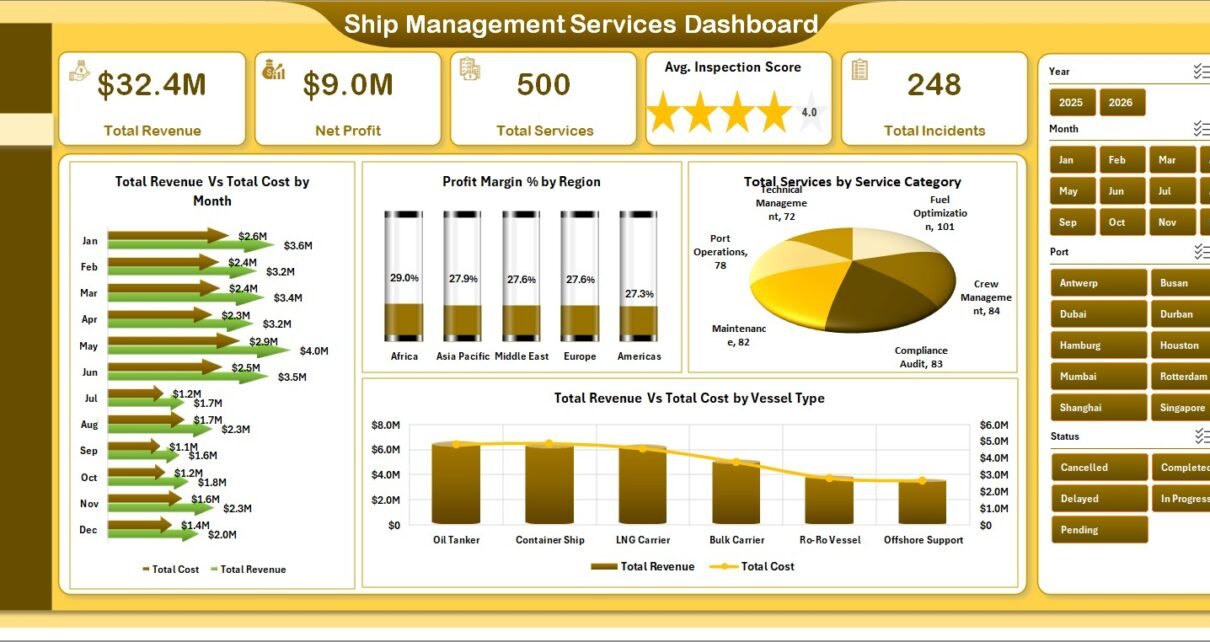
Ship Management Services Dashboard in Excel helps marine operations teams turn service records into clear performance reporting across 7 worksheet tabs, 5 executive cards, 19 chart views, slicers, a data input
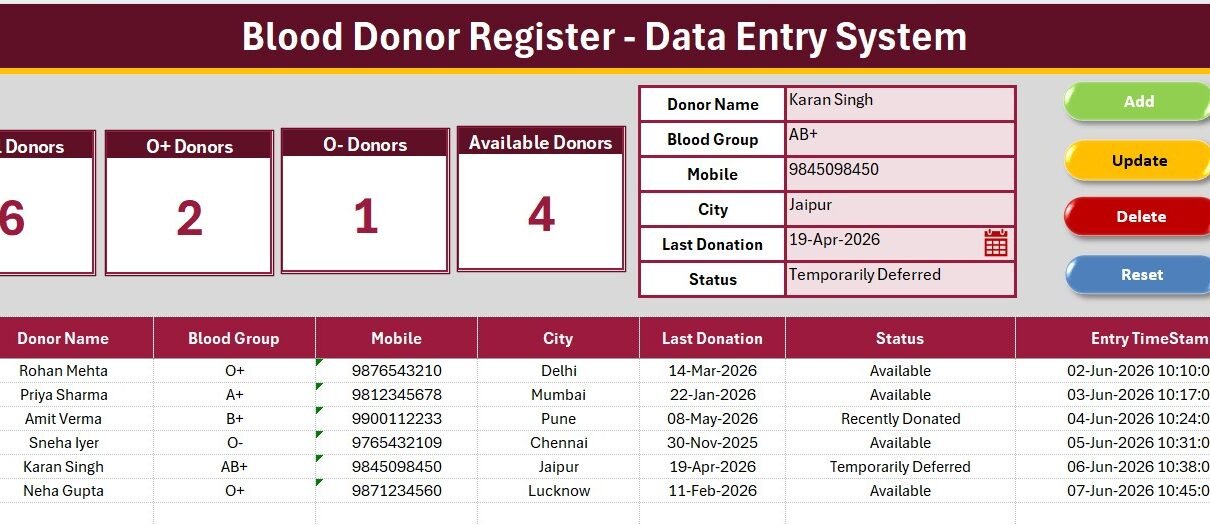
PKComments Off on Blood Donor Register Data Entry System in Excel
The Blood Donor Register Data Entry System in Excel stores 6 fields per donor and rolls them into 4 live KPI cards that recalculate the moment a record changes. The
PKComments Off on Sentiment Analysis Startups Dashboard in Excel
Sentiment Analysis Startups Dashboard in Excel is a ready-to-use Excel dashboard template for tracking startup subscription revenue, cloud cost, gross profit, text processing volume, model accuracy, sentiment mix, completion status,