New: NextGenTemplates Academy - video courses on Excel formulas with AI and Pivot Tables & dashboards. Early-bird: 20% off with code EARLYBIRD20 - first 20 orders only.See the courses →
PKComments Off on CrossFit Gym KPI Dashboard in Power BI
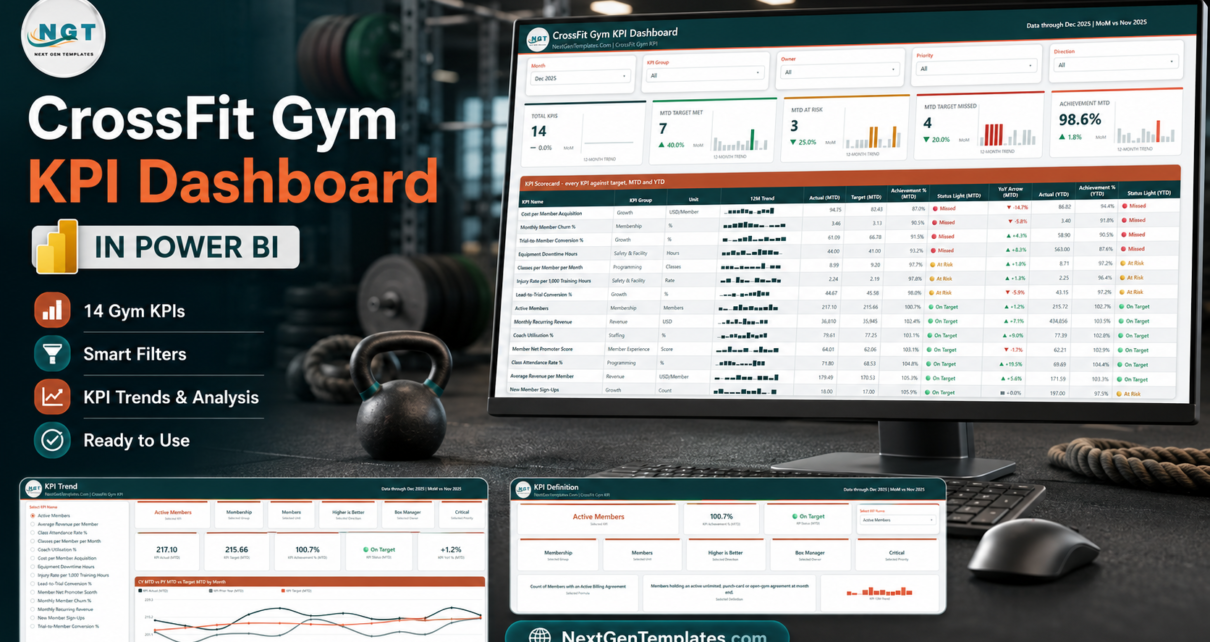
Most CrossFit affiliates measure the same three things - members, revenue and how full the 6am class is - and then argue about everything else from memory. The CrossFit Gym
PKComments Off on Smart City Surveillance Dashboard in Power BI
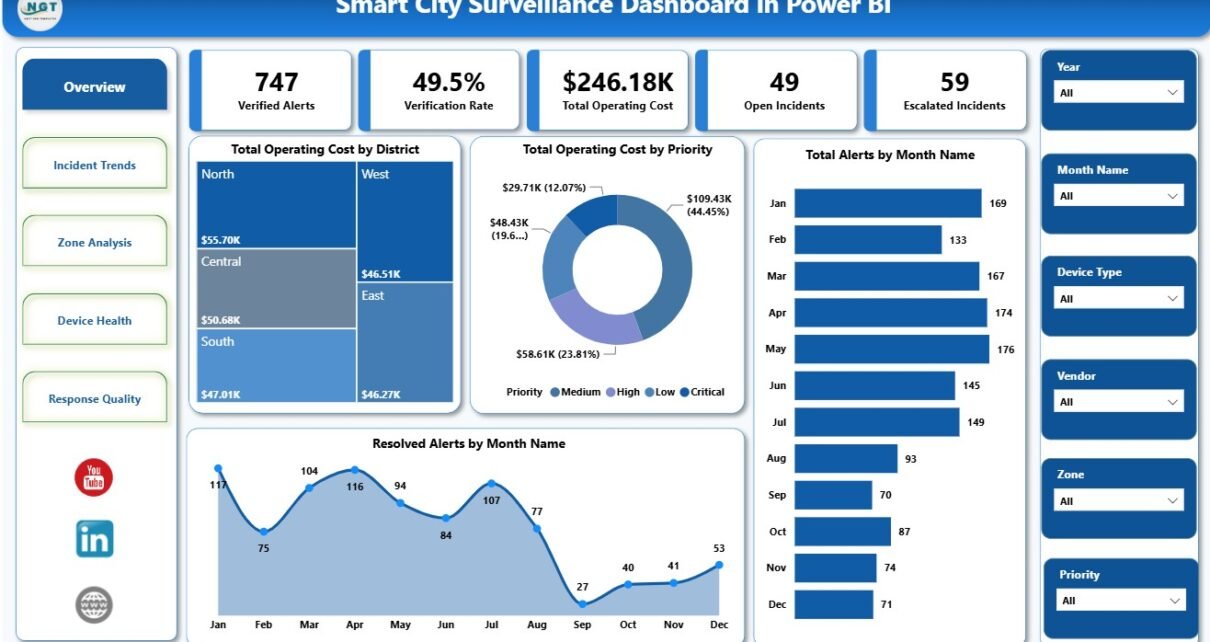
Smart City Surveillance Dashboard in Power BI is designed for surveillance operations, smart city control rooms, CCTV monitoring teams, public safety analysts, and security vendors that need a clean reporting
PKComments Off on Agri Insurance Dashboard in Power BI
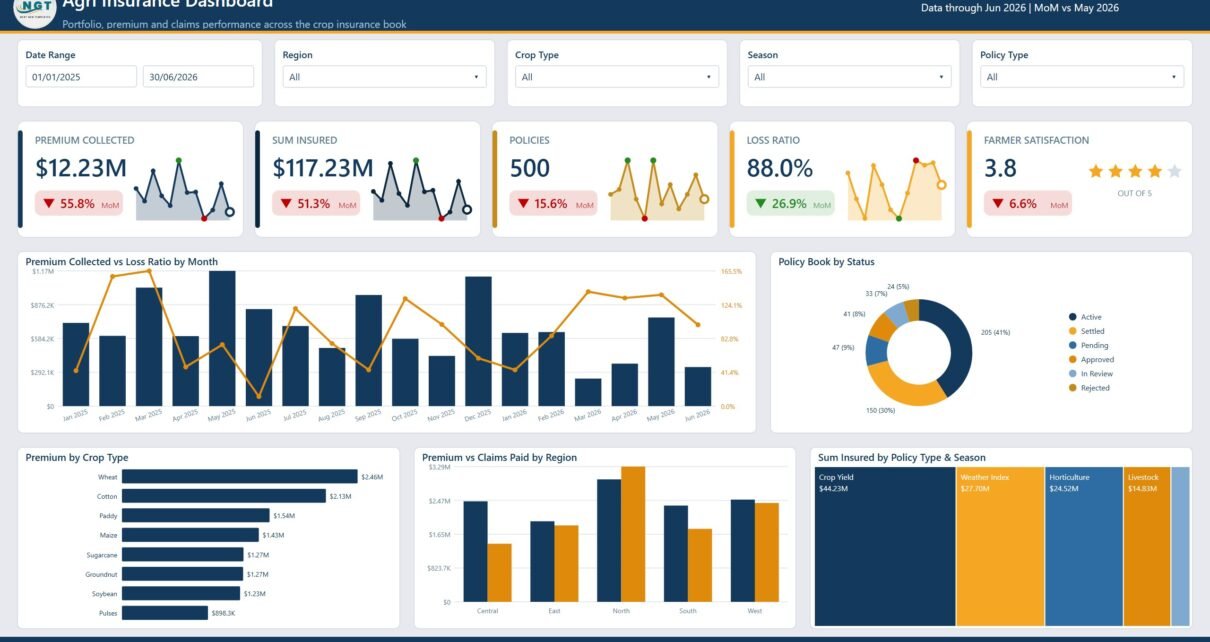
Agri Insurance Dashboard in Power BI is a ready-to-use reporting template for agricultural insurers, crop insurance program managers, subsidy teams, brokers, cooperatives, and analysts who need one place to review
PKComments Off on Sentiment Analysis Startups Dashboard in Power BI
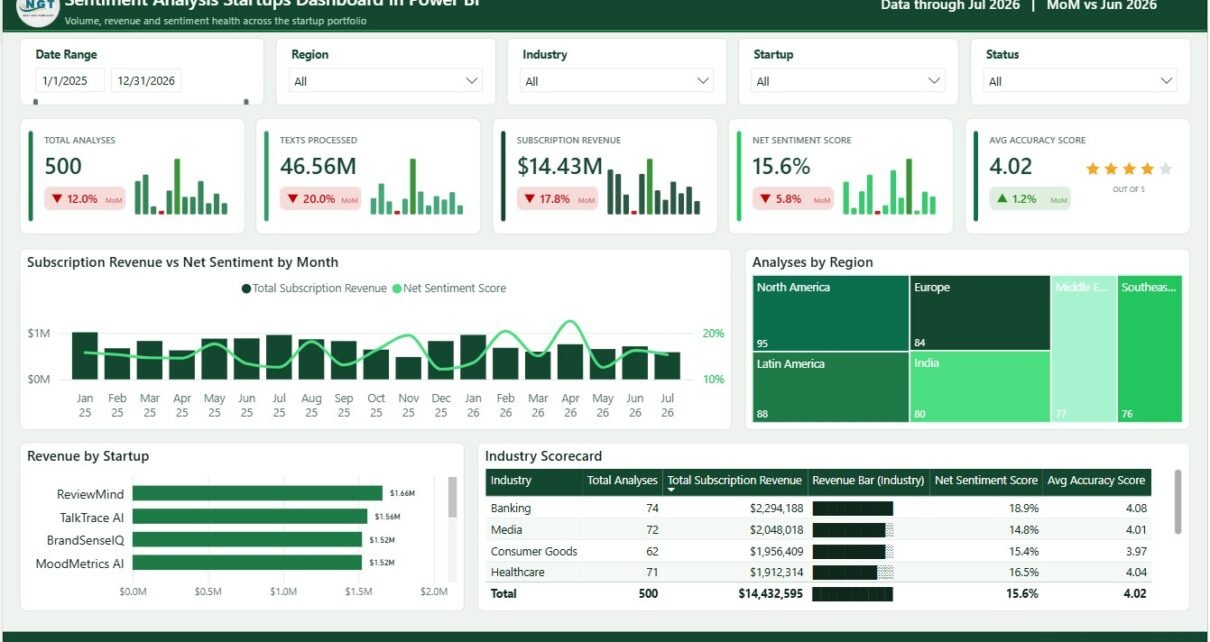
Sentiment Analysis Startups Dashboard in Power BI is a ready-to-use report template for AI SaaS founders, NLP product teams, customer success leaders, revenue operations managers, and BI consultants who need one
PKComments Off on Ship Management Services Dashboard in Excel
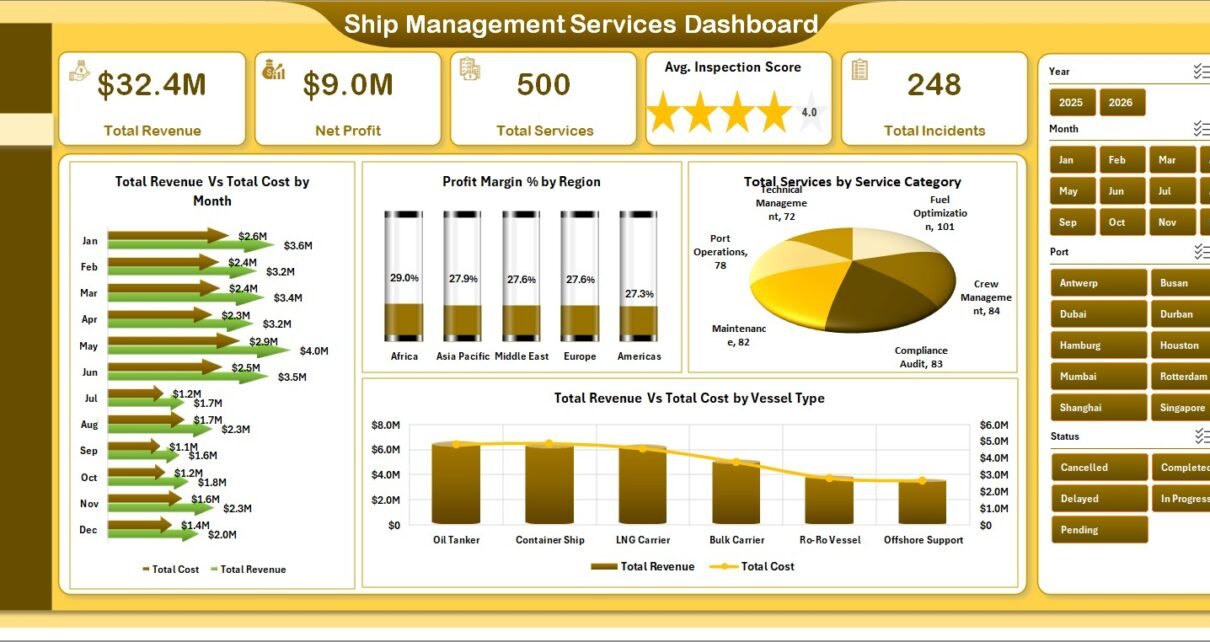
Ship Management Services Dashboard in Excel helps marine operations teams turn service records into clear performance reporting across 7 worksheet tabs, 5 executive cards, 19 chart views, slicers, a data input
PKComments Off on Blood Donor Register Data Entry System in Excel
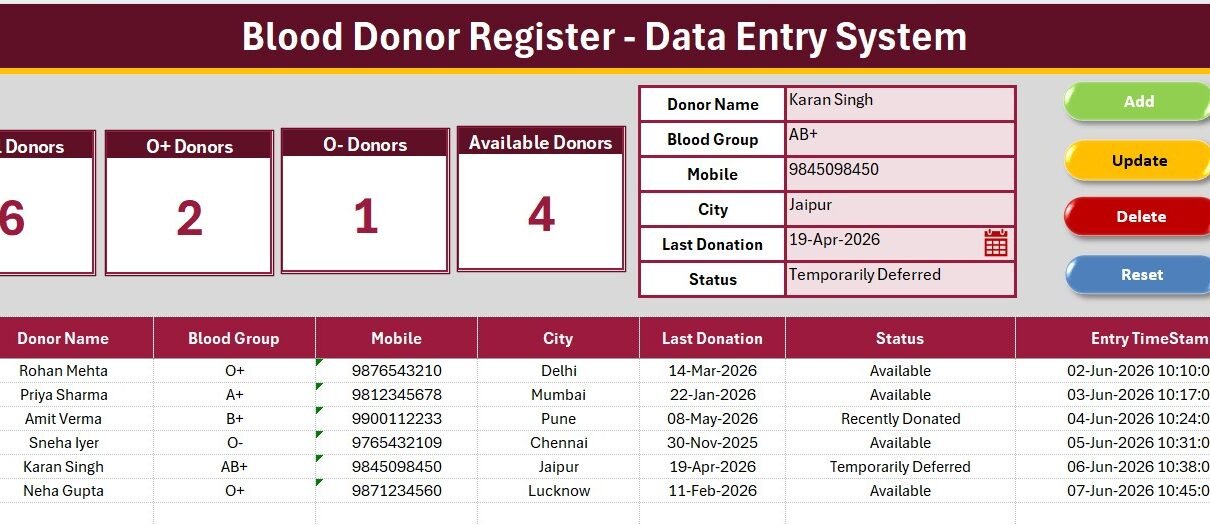
The Blood Donor Register Data Entry System in Excel stores 6 fields per donor and rolls them into 4 live KPI cards that recalculate the moment a record changes. The
PKComments Off on Sentiment Analysis Startups Dashboard in Excel
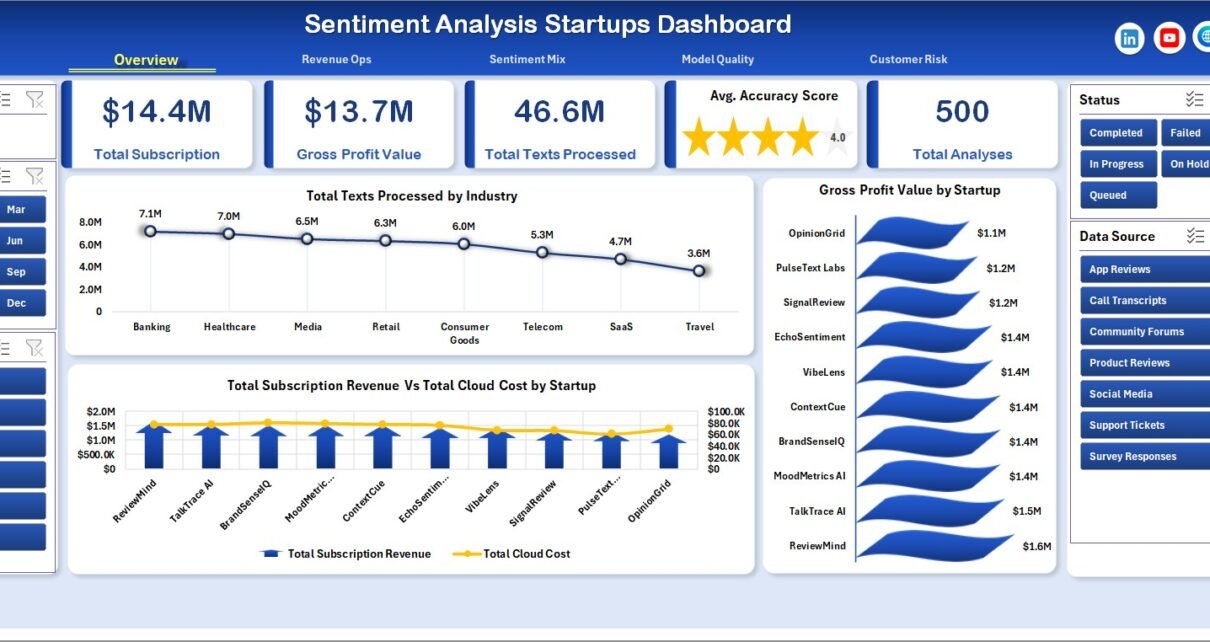
Sentiment Analysis Startups Dashboard in Excel is a ready-to-use Excel dashboard template for tracking startup subscription revenue, cloud cost, gross profit, text processing volume, model accuracy, sentiment mix, completion status,
PKComments Off on School Transportation Services Dashboard in Power BI
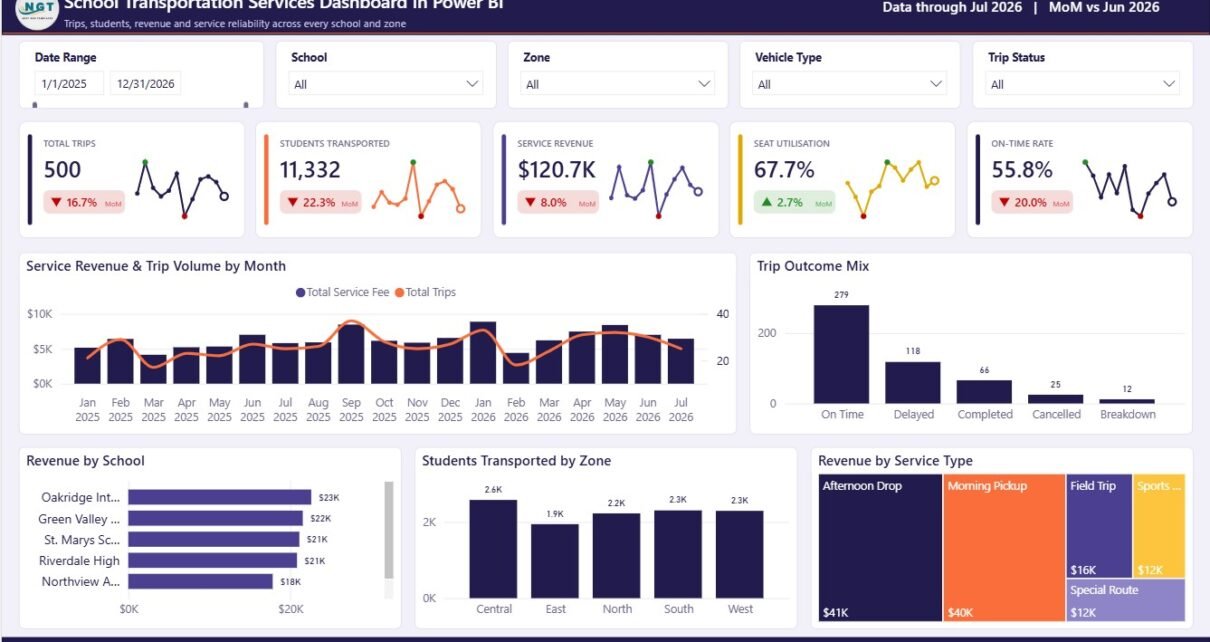
School transportation is a daily operating system with real money, safety, and family trust behind every route. A single missed trend can show up as late arrivals, underused seats, avoidable fuel
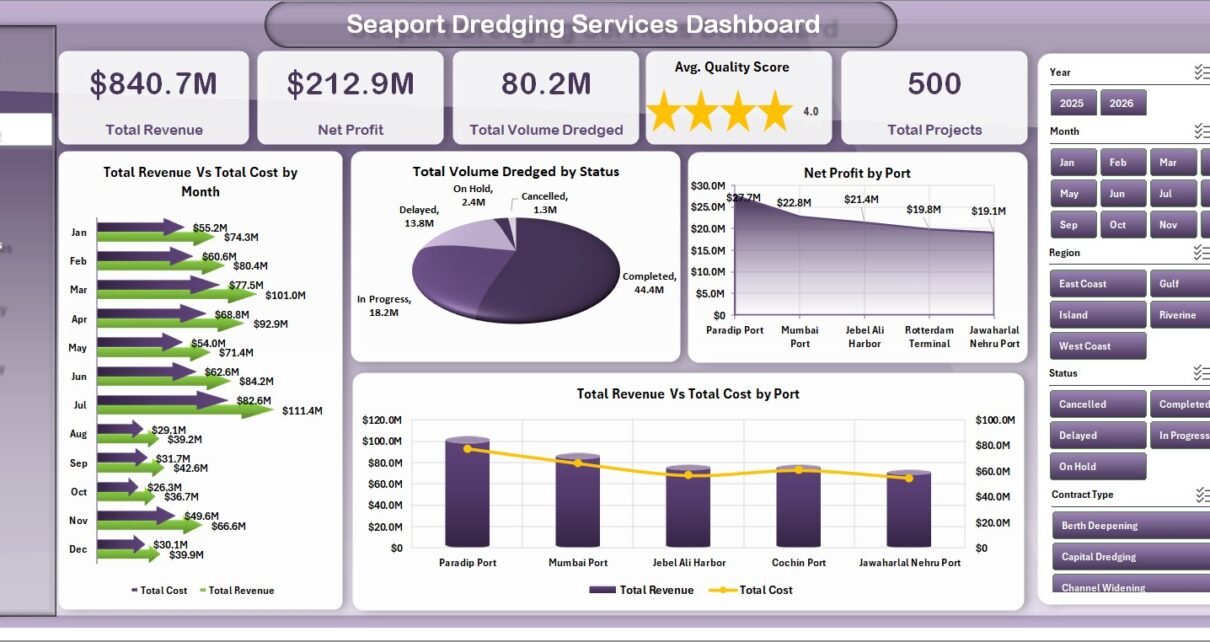
PKComments Off on Seaport Dredging Services Dashboard in Excel
Last updated: August 9, 2026. The Seaport Dredging Services Dashboard in Excel is a ready-to-use reporting template for dredging contractors, port authorities, marine operations teams, and project controls professionals. It includes 7 workbook
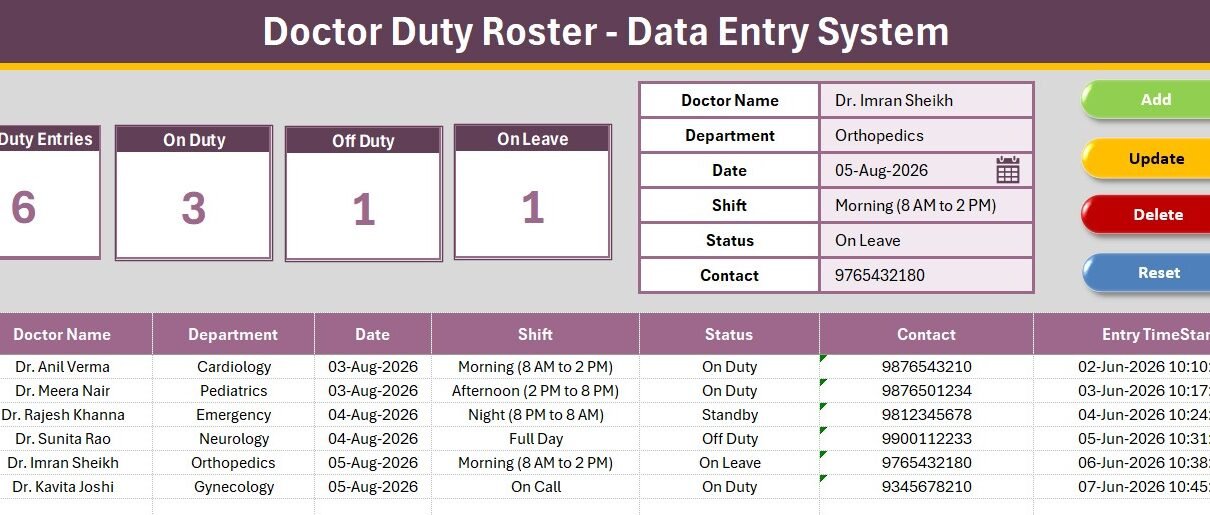
PKComments Off on Doctor Duty Roster Data Entry System in Excel
The Doctor Duty Roster Data Entry System in Excel records 6 fields per duty line, drives 4 live KPI cards, and ships with 15 pre-loaded hospital departments, 6 shift patterns