New: NextGenTemplates Academy - video courses on Excel formulas with AI and Pivot Tables & dashboards. Early-bird: 20% off with code EARLYBIRD20 - first 20 orders only. See the courses →
  • Learn Excel (Free Course)
    • 1. Shortcut Keys
    • 2. Fill & Flash Fill
    • 3. Find & Replace
    • 4. Sort & Filter
    • 5. Formulas & Functions
    • 6. Data Validation
    • 7. Conditional Formatting
    • 8. Basic Charts
    • 9. Advanced Charts
    • 10. Pivot Tables
    • 11. Excel Dashboards
    • 12. VBA Course
    • 13. Excel Formulas with AI
  • Templates
  • Tutorials
    • Charts and Visualization
    • VBA
    • Excel Tips and Tricks
    • Excel Dashboards
    • Power Pivot & DAX
  • Power BI
  • Template Store
    • Ready to Use Templates
  • Courses
  • Academy
    • Excel + AI Mastery: 100 Formulas
    • Excel Pivot Tables & Dashboards
  • About Us
  • Contact Us

PK: An Excel Expert

Transforming Data into Decisions

Tag: Sales Dashboard

Dashboard Power BI

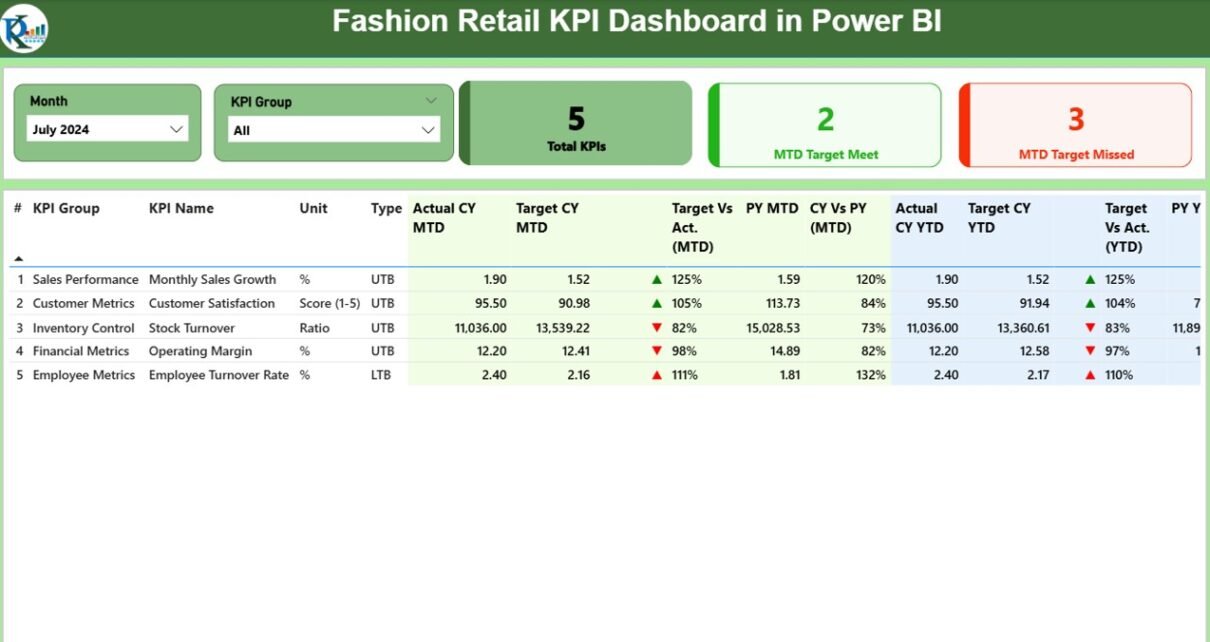
Fashion Retail KPI Dashboard in Power BI

July 26, 2025July 26, 2025 PKComments Off on Fashion Retail KPI Dashboard in Power BI
In the fast-paced world of fashion retail, staying ahead of performance metrics is essential to success. From tracking monthly sales targets to monitoring year-on-year growth and operational efficiency, retailers need
Read More
Dashboard

Sales Business Intelligence Dashboard in Excel

July 16, 2025July 16, 2025 PKComments Off on Sales Business Intelligence Dashboard in Excel
In today's data-driven world, businesses rely heavily on dashboards to visualize and analyze their performance. A Sales Business Intelligence Dashboard in Excel provides a centralized view of key sales metrics,
Read More
Dashboard

E-commerce Dashboard In Excel

May 15, 2025May 15, 2025 PKComments Off on E-commerce Dashboard In Excel
In today’s fast-paced digital world, managing an e-commerce business effectively requires data-driven insights that can help optimize operations, boost sales, and improve customer satisfaction. The E-commerce Dashboard in Excel provides
Read More
Dashboard

Retail Dashboard in Excel

May 4, 2025May 7, 2025 PKComments Off on Retail Dashboard in Excel
In today’s fast-paced retail environment, having access to real-time data is crucial for making informed decisions. One of the best ways to track key performance indicators (KPIs) and understand your
Read More
Dashboard

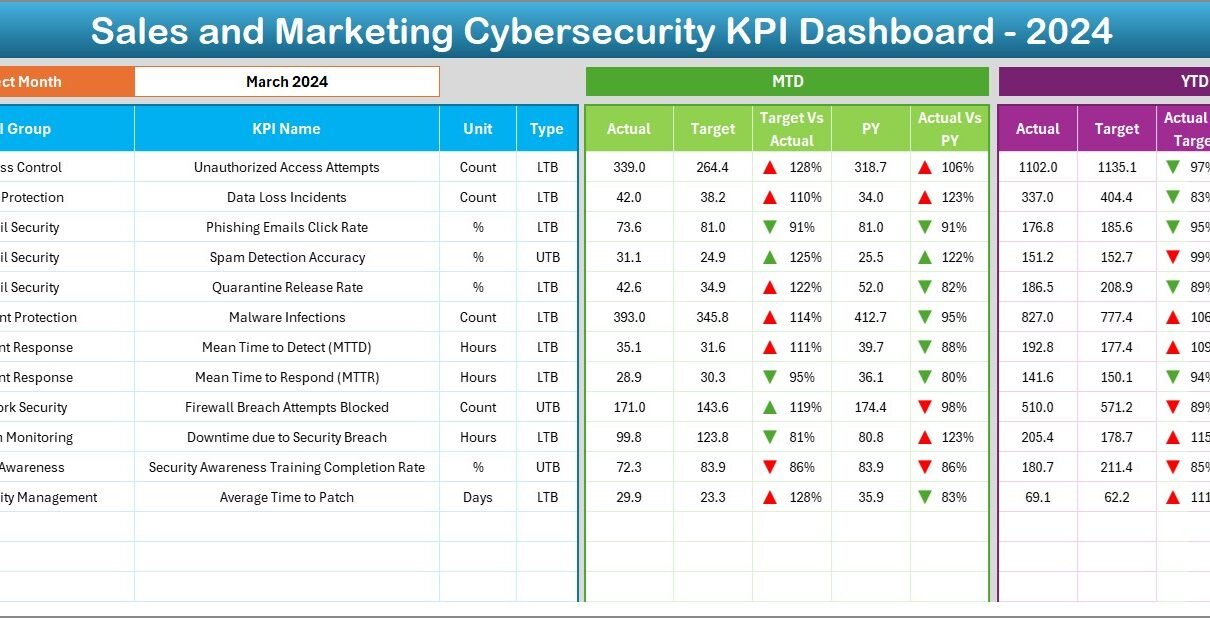
Sales and Marketing Cybersecurity KPI Dashboard in Excel

April 15, 2025April 15, 2025 PKComments Off on Sales and Marketing Cybersecurity KPI Dashboard in Excel
In today's fast-paced digital world, businesses must protect sensitive data and streamline operations across departments. That’s why combining sales, marketing, and cybersecurity KPIs into one integrated dashboard is not just
Read More
Sparklines in Power BI
Power BI

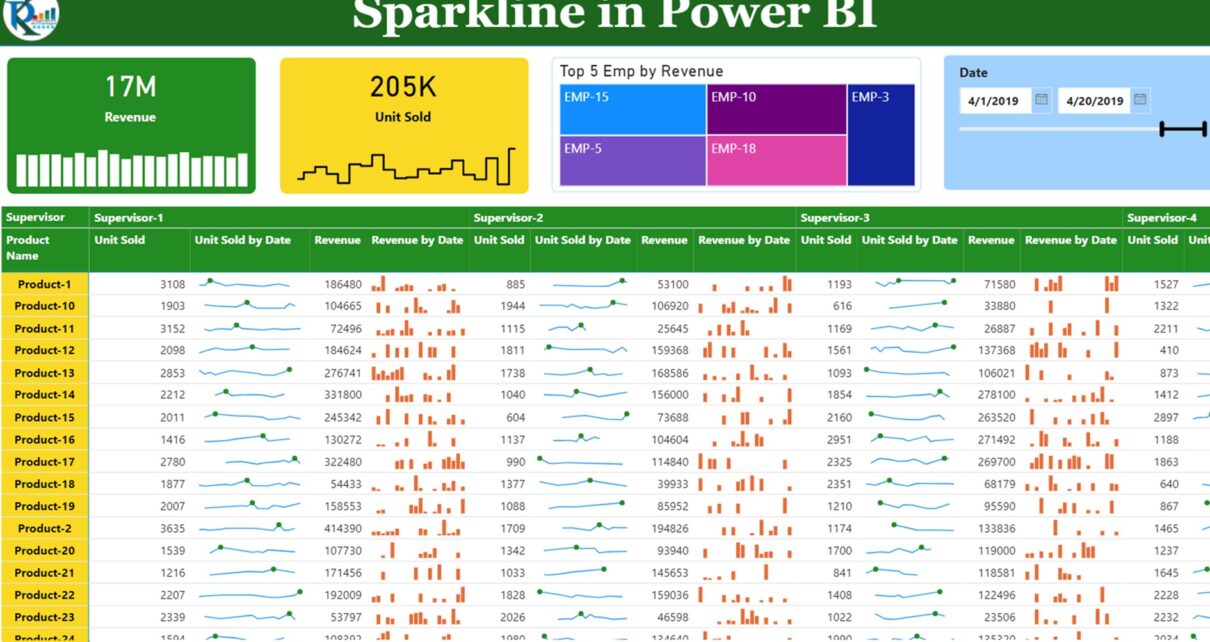
Sparklines in Power BI

May 17, 2022October 10, 2026 PKComments Off on Sparklines in Power BI
Sparklines are the small charts that can be created in the Table/Matrix cell to show the trend of over the period. We can use the sparklines in the Power BI report also. It
Read More
Daily Sales Dashboard
Dashboard

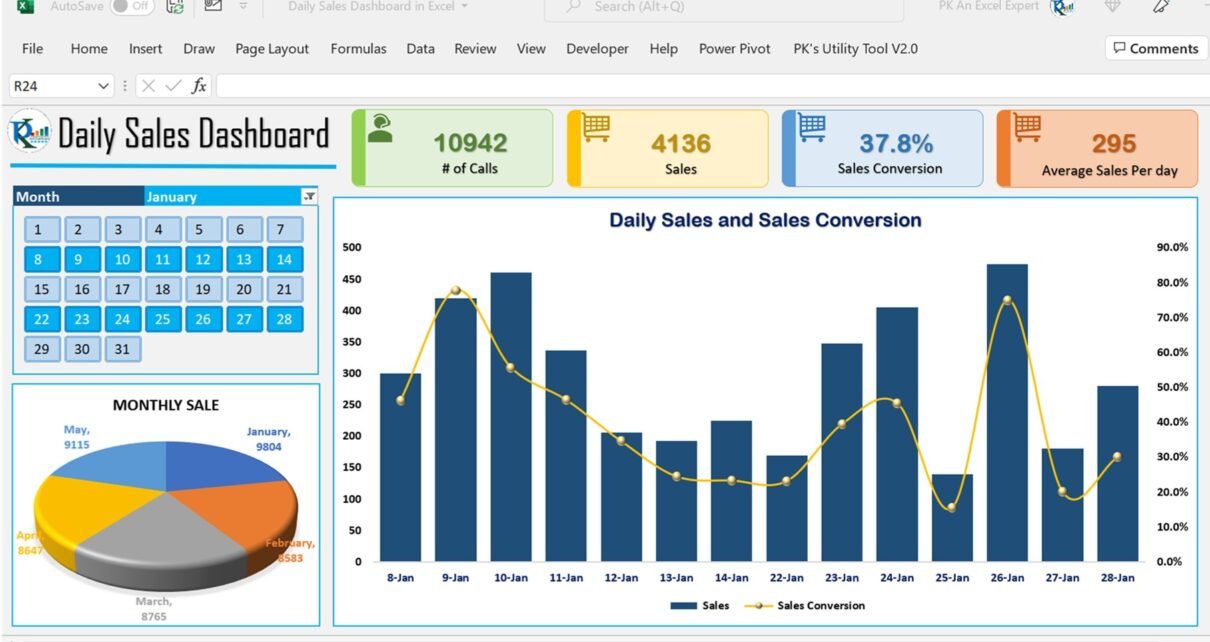
Daily Sales Dashboard in Excel

April 5, 2022February 18, 2025 PKComments Off on Daily Sales Dashboard in Excel
Daily Sales dashboard is quite useful template to track your daily sales. we have created a Daily Sales Dashboard to analyze the Daily Sales trends. We have displayed 4 metrics
Read More
Sales Analysis Heat Map
Charts and Visualization

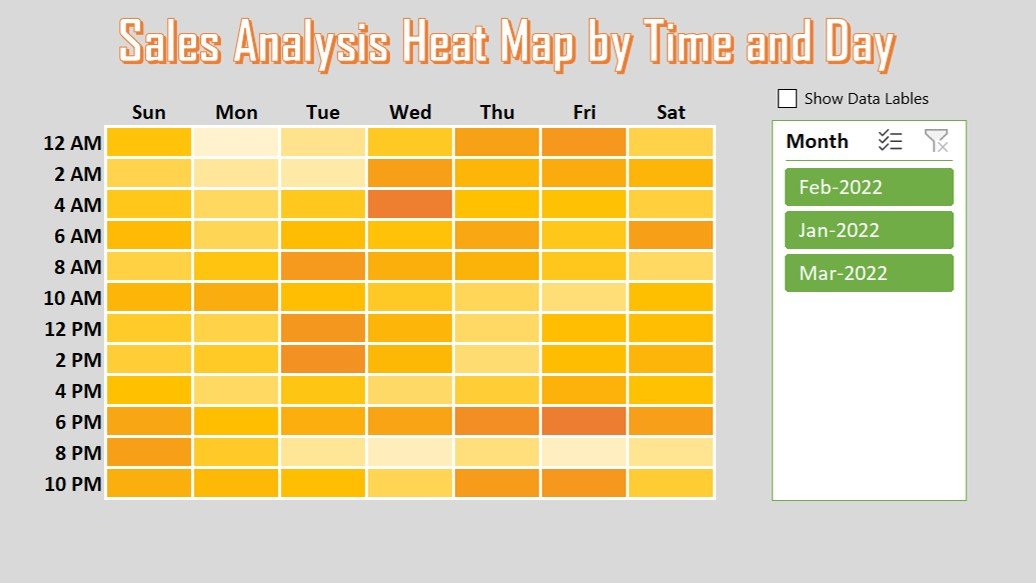
Sales Analysis Heat Map by Time and Day

March 27, 2022March 2, 2025 PKComments Off on Sales Analysis Heat Map by Time and Day
In this article, we have created a dynamic Sales Analysis Heat Map by Time and Day. Using this analysis, you will get to know your most busy time in a
Read More
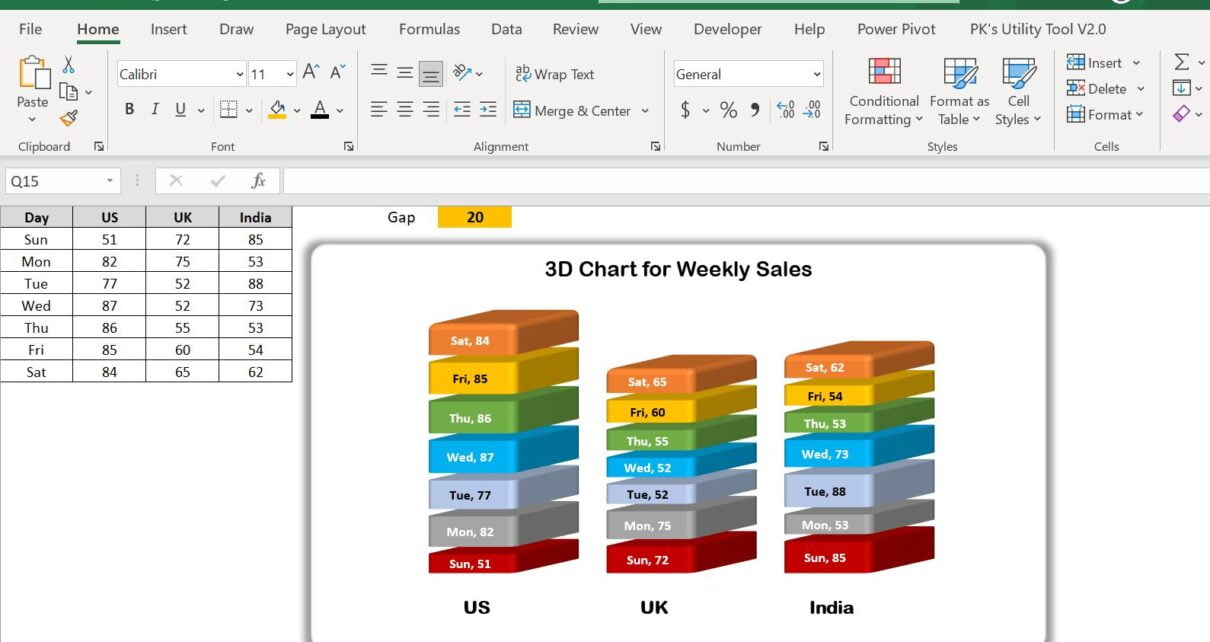
3D Charts for Weekly Sale
Charts and Visualization

3D Chart for Weekly Sale in Excel

September 26, 2021March 2, 2025 PKComments Off on 3D Chart for Weekly Sale in Excel
Data visualization is a robust strategy for presenting and analyzing vast amounts of data, uncovering trends, patterns, and relationships that may have been previously concealed. 3D charts are a distinctive
Read More
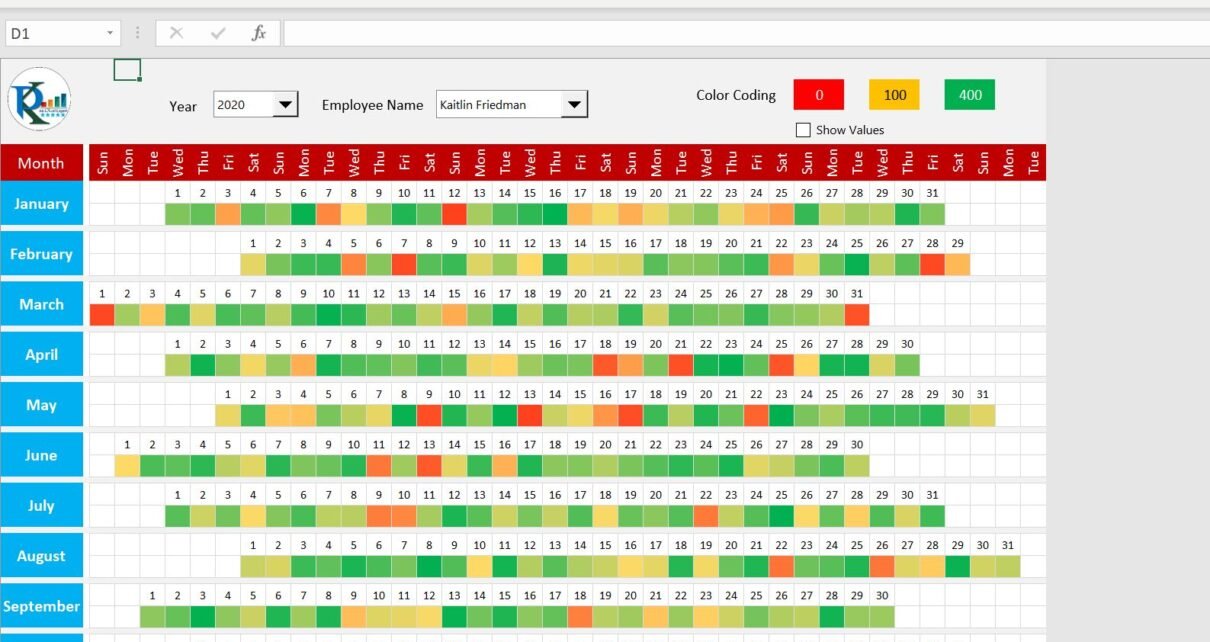
Sales Calendar in Excel
Dashboard

Annual Sales Calendar for Sales Dashboard in Excel

September 5, 2021February 18, 2025 PKComments Off on Annual Sales Calendar for Sales Dashboard in Excel
In this article, we have created an Annual Sales Calendar for Sales Dashboard in Excel. You can use this Sales Calendar in your sales dashboard. We have used the Combo
Read More

Posts pagination

Previous 1 2 3 4 Next
  • Learn Excel (Free Course)
    • 1. Shortcut Keys
    • 2. Fill & Flash Fill
    • 3. Find & Replace
    • 4. Sort & Filter
    • 5. Formulas & Functions
    • 6. Data Validation
    • 7. Conditional Formatting
    • 8. Basic Charts
    • 9. Advanced Charts
    • 10. Pivot Tables
    • 11. Excel Dashboards
    • 12. VBA Course
    • 13. Excel Formulas with AI
  • Templates
  • Tutorials
    • Charts and Visualization
    • VBA
    • Excel Tips and Tricks
    • Excel Dashboards
    • Power Pivot & DAX
  • Power BI
  • Template Store
    • Ready to Use Templates
  • Courses
  • Academy
    • Excel + AI Mastery: 100 Formulas
    • Excel Pivot Tables & Dashboards
  • About Us
  • Contact Us
Copyright © 2023 PK-AnExcelExpert.com - Privacy Policy