New: NextGenTemplates Academy - video courses on Excel formulas with AI and Pivot Tables & dashboards. Early-bird: 20% off with code EARLYBIRD20 - first 20 orders only. See the courses →
  • Learn Excel (Free Course)
    • 1. Shortcut Keys
    • 2. Fill & Flash Fill
    • 3. Find & Replace
    • 4. Sort & Filter
    • 5. Formulas & Functions
    • 6. Data Validation
    • 7. Conditional Formatting
    • 8. Basic Charts
    • 9. Advanced Charts
    • 10. Pivot Tables
    • 11. Excel Dashboards
    • 12. VBA Course
    • 13. Excel Formulas with AI
  • Templates
  • Tutorials
    • Charts and Visualization
    • VBA
    • Excel Tips and Tricks
    • Excel Dashboards
    • Power Pivot & DAX
  • Power BI
  • Template Store
    • Ready to Use Templates
  • Courses
  • Academy
    • Excel + AI Mastery: 100 Formulas
    • Excel Pivot Tables & Dashboards
  • About Us
  • Contact Us

PK: An Excel Expert

Transforming Data into Decisions

Tag: Sales Dashboard

Dynamic Comparison in Butterfly Chart
Charts and Visualization

Dynamic Comparison in Butterfly Chart

June 28, 2021March 3, 2025 PKComments Off on Dynamic Comparison in Butterfly Chart
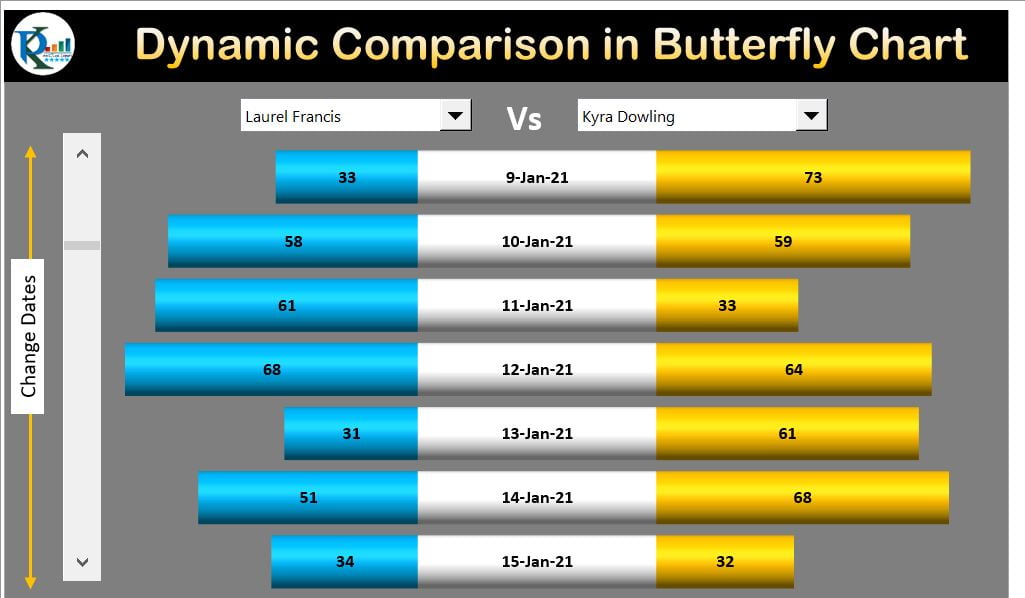
Dynamic Comparison in Butterfly Chart is useful when you want to compare the Sales or any other parameter for two employees or two Teams for multiple dates. We have used
Read More
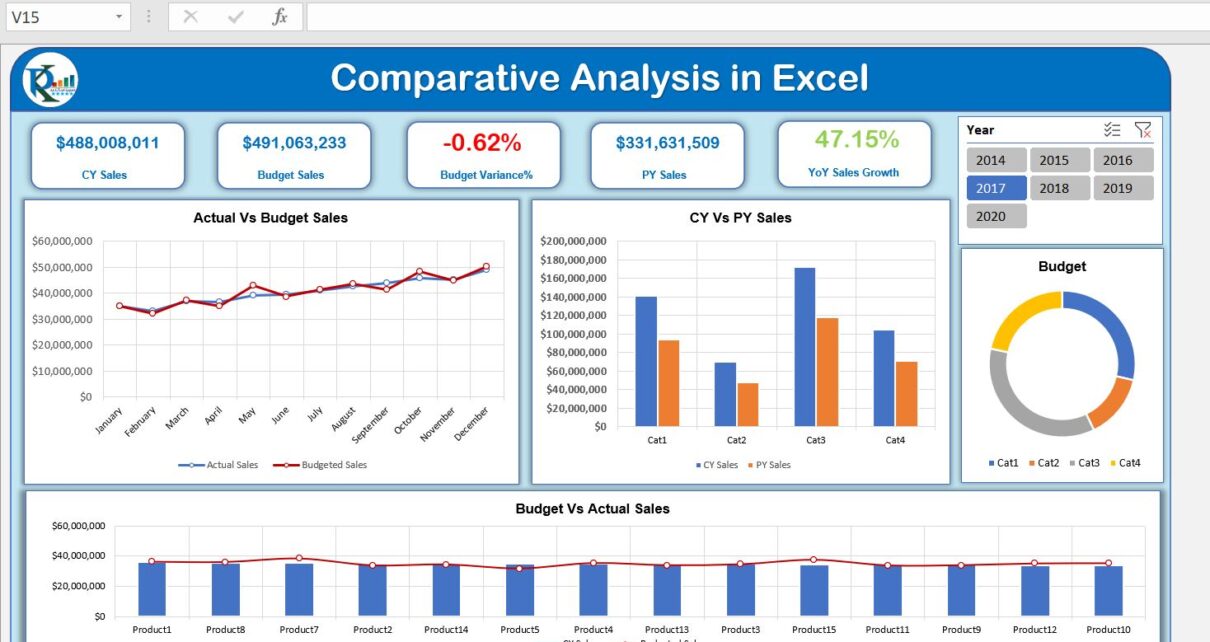
Comparative Analysis Dashboard in Excel
Dashboard Power Pivot

Excel Comparative Analysis Dashboard with Power Pivot

June 20, 2021September 19, 2026 PKComments Off on Excel Comparative Analysis Dashboard with Power Pivot
This Excel comparative analysis dashboard uses Power Pivot to compare current-year sales with the same period in the previous year, and actual sales with budget. Three tables supply the data:
Read More
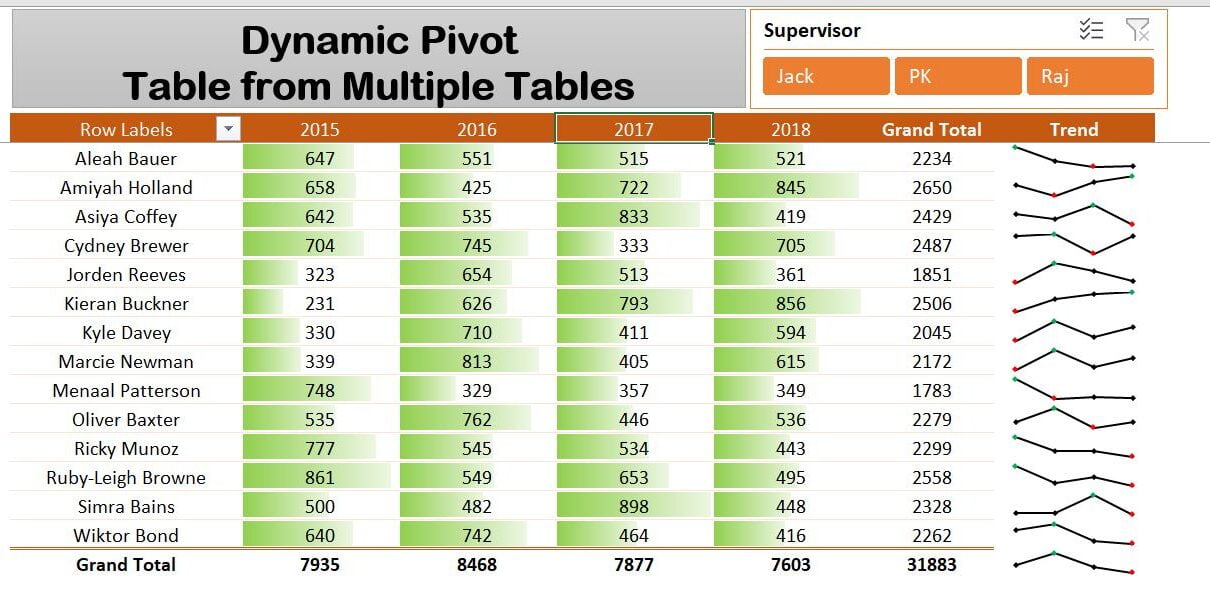
Dynamic Pivot Table with Multiple Tables
Charts and Visualization

Combine Tables into a Dynamic PivotTable with Power Query

January 31, 2021October 10, 2026 PKComments Off on Combine Tables into a Dynamic PivotTable with Power Query
Power Query consolidates the tables used in this Excel PivotTable example: four yearly Sales Tables and an Employee Master containing supervisor and employee names. The final report includes slicers and
Read More
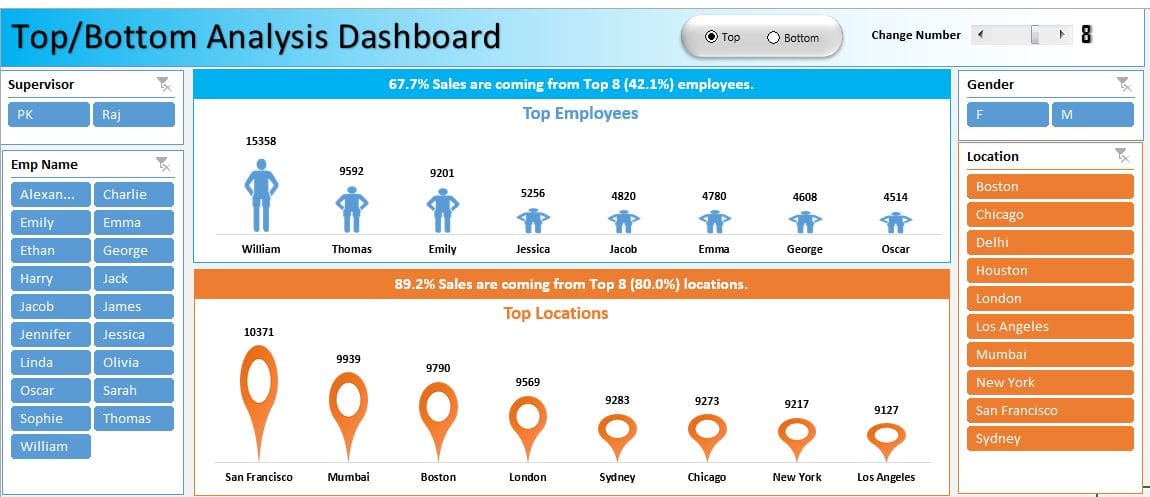
Top-Bottom Analysis in Excel
Charts and Visualization Dashboard

Top/Bottom Analysis dashboard in Excel

May 24, 2020September 19, 2026 PKComments Off on Top/Bottom Analysis dashboard in Excel
The Top/Bottom Analysis dashboard in Excel ranks employees and locations using a sample sales dataset. It combines slicers, Form Control option buttons and a scrollbar to change the ranking view
Read More
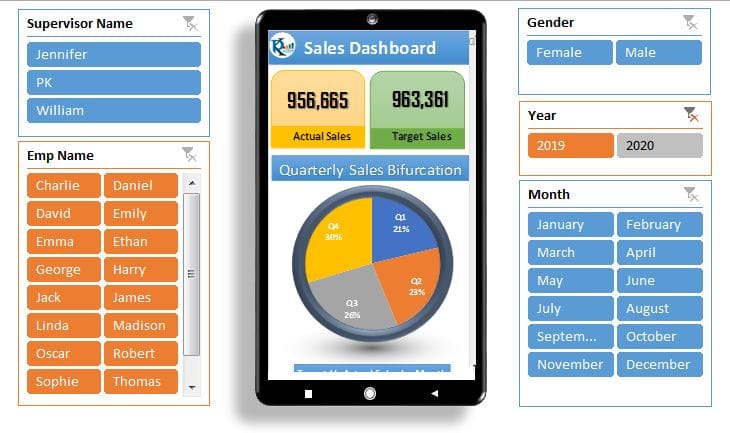
Tablet and Mobile layout Dashboard
Dashboard

Dynamic Dashboard with Tablet and Mobile shape in Excel

May 17, 2020September 19, 2026 PKComments Off on Dynamic Dashboard with Tablet and Mobile shape in Excel
This dynamic Excel dashboard presents information inside tablet and mobile frames made with Excel Shapes. A Form Control scrollbar makes the compact worksheet display interactive. The tutorial explores a layout
Read More
Northwind Dashboard
Power BI Dashboard

Beautiful Power BI Dashboard with Northwind Database

March 24, 2020October 10, 2026 PKComments Off on Beautiful Power BI Dashboard with Northwind Database
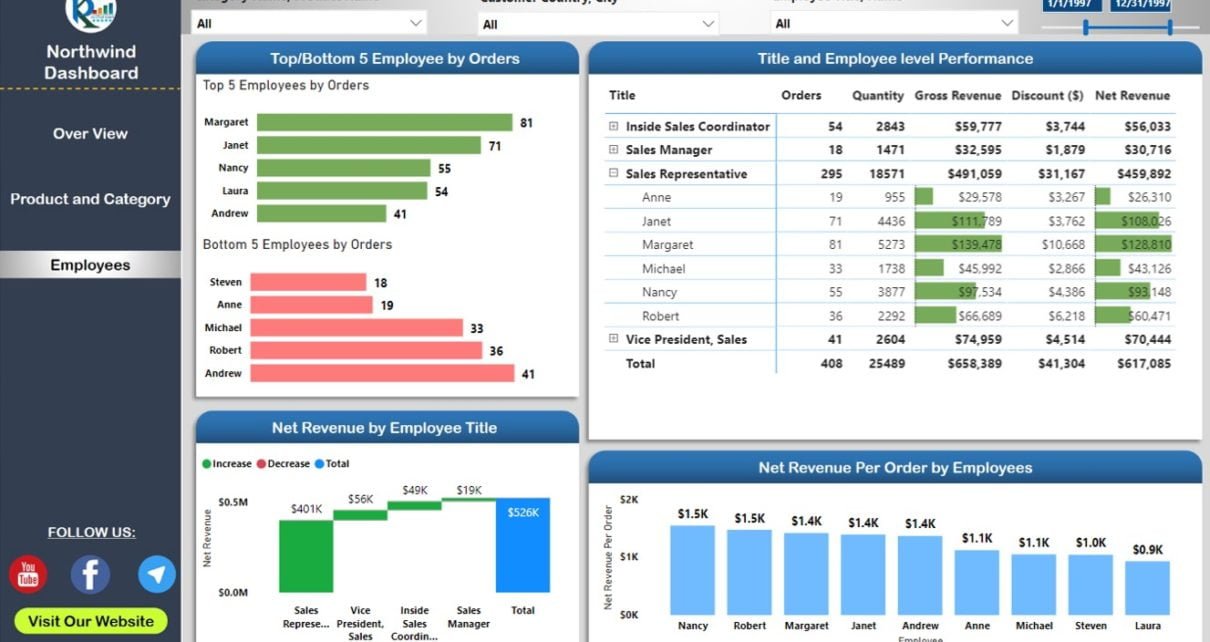
This Northwind Power BI dashboard uses the Northwind sample database through an OData feed. Its three pages cover overall sales, product and category stock, and employee results. The tutorial also
Read More
Insert a Picture in Excel Comments (Notes): Show Image on Hover
Excel Tips and Tricks

Insert a Picture in Excel Comments (Notes): Show Image on Hover

June 26, 2019October 9, 2026 PKComments Off on Insert a Picture in Excel Comments (Notes): Show Image on Hover
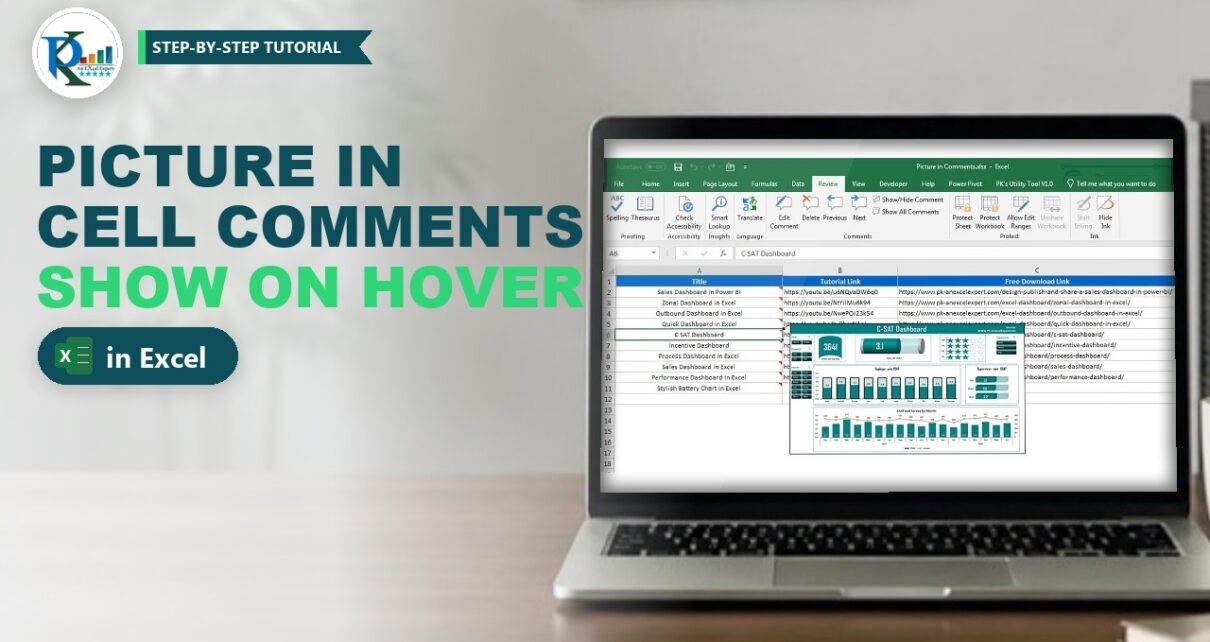
To insert a picture in Excel comments, you fill the comment box with an image instead of text, so the picture pops up only when someone hovers over the cell.
Read More
Sales Dashboard in Power BI: Design, Publish and Share
Power BI

Sales Dashboard in Power BI: Design, Publish and Share

May 22, 2019October 9, 2026 PKComments Off on Sales Dashboard in Power BI: Design, Publish and Share
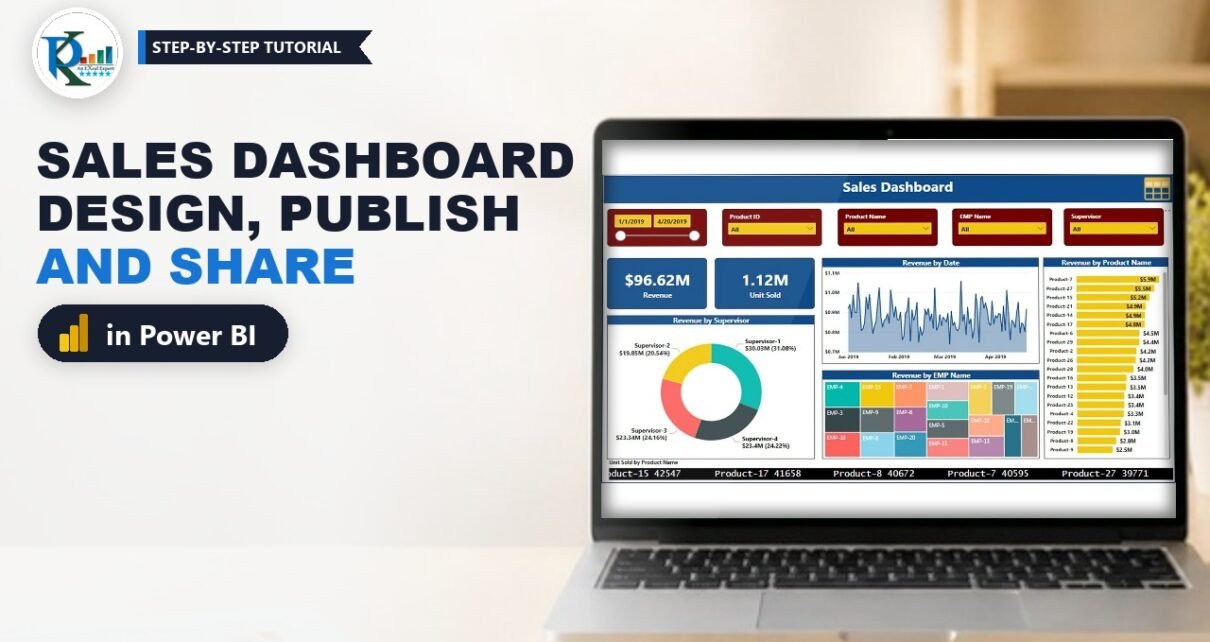
A sales dashboard in Power BI turns three plain Excel tables into an interactive report your team can open in a browser. In this tutorial you build the full project
Read More

Posts pagination

Previous 1 … 3 4
  • Learn Excel (Free Course)
    • 1. Shortcut Keys
    • 2. Fill & Flash Fill
    • 3. Find & Replace
    • 4. Sort & Filter
    • 5. Formulas & Functions
    • 6. Data Validation
    • 7. Conditional Formatting
    • 8. Basic Charts
    • 9. Advanced Charts
    • 10. Pivot Tables
    • 11. Excel Dashboards
    • 12. VBA Course
    • 13. Excel Formulas with AI
  • Templates
  • Tutorials
    • Charts and Visualization
    • VBA
    • Excel Tips and Tricks
    • Excel Dashboards
    • Power Pivot & DAX
  • Power BI
  • Template Store
    • Ready to Use Templates
  • Courses
  • Academy
    • Excel + AI Mastery: 100 Formulas
    • Excel Pivot Tables & Dashboards
  • About Us
  • Contact Us
Copyright © 2023 PK-AnExcelExpert.com - Privacy Policy