New: NextGenTemplates Academy - video courses on Excel formulas with AI and Pivot Tables & dashboards. Early-bird: 20% off with code EARLYBIRD20 - first 20 orders only. See the courses →
  • Learn Excel (Free Course)
    • 1. Shortcut Keys
    • 2. Fill & Flash Fill
    • 3. Find & Replace
    • 4. Sort & Filter
    • 5. Formulas & Functions
    • 6. Data Validation
    • 7. Conditional Formatting
    • 8. Basic Charts
    • 9. Advanced Charts
    • 10. Pivot Tables
    • 11. Excel Dashboards
    • 12. VBA Course
    • 13. Excel Formulas with AI
  • Templates
  • Tutorials
    • Charts and Visualization
    • VBA
    • Excel Tips and Tricks
    • Excel Dashboards
    • Power Pivot & DAX
  • Power BI
  • Template Store
    • Ready to Use Templates
  • Courses
  • Academy
    • Excel + AI Mastery: 100 Formulas
    • Excel Pivot Tables & Dashboards
  • About Us
  • Contact Us

PK: An Excel Expert

Transforming Data into Decisions

Tag: Ultimate Speedometer

Dynamic Chart with Camera
Charts and Visualization

Dynamic Graph with Camera

May 3, 2022October 10, 2026 PKComments Off on Dynamic Graph with Camera
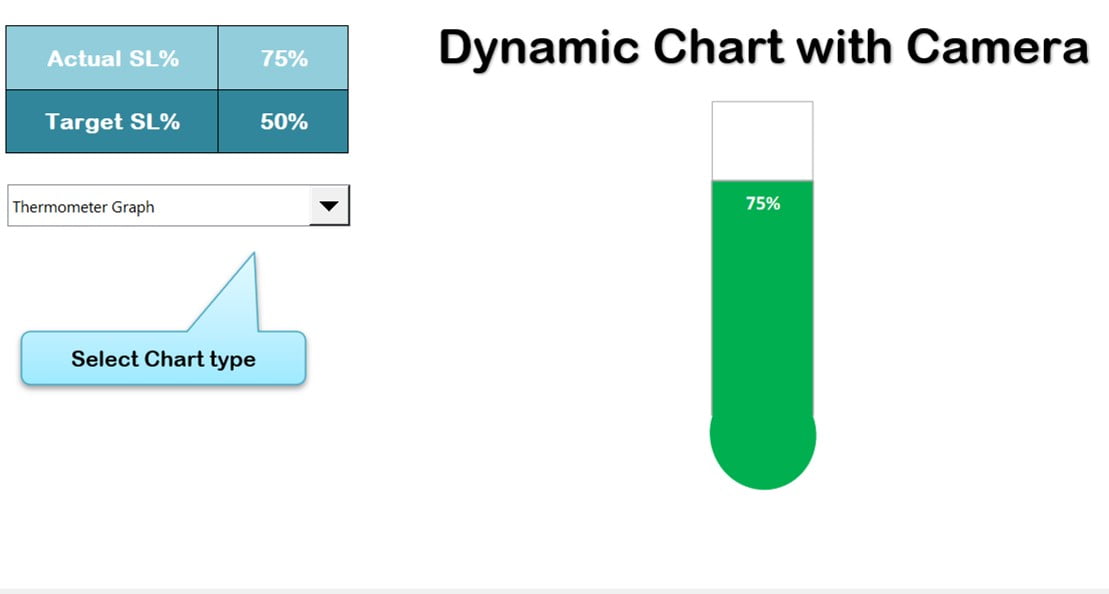
In this article, we have created a dynamic graph with Camera functionality of Excel. We have used conditional formatting in Chart. You can change the chart type using Form Control
Read More
Sales Score meter Chart -V2
Charts and Visualization

Dynamic Sales Score Meter Chart

April 19, 2020February 23, 2025 PKComments Off on Dynamic Sales Score Meter Chart
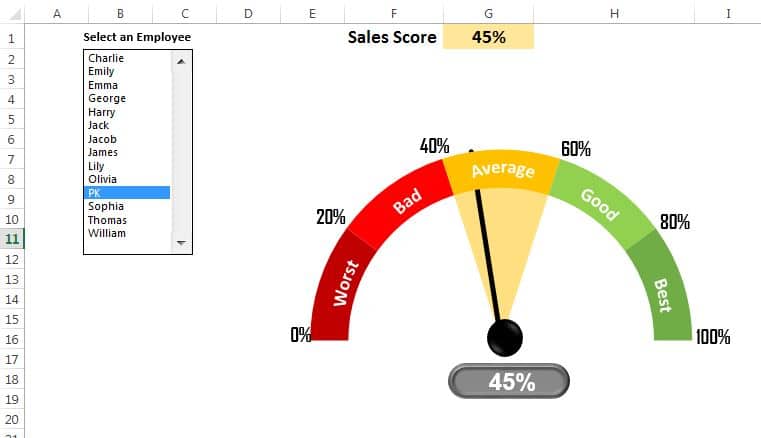
In this article, we have created a dynamic sales score meter chart. In this chart we have displayed the sales core on a speedometer chart. We have displayed the sales
Read More
3D Gauge Chart
Charts and Visualization

3D Gauge Chart in Excel

March 30, 2020February 21, 2025 PKComments Off on 3D Gauge Chart in Excel
In this article, we have created beautiful 3D Gauge Chart in Excel. We have used Excel shapes and Pie Chart to create this beautiful visualization. You can use this chart
Read More
Animated Speedometer Chart in Excel with VBA (Step by Step)
Charts and Visualization

Animated Speedometer Chart in Excel with VBA (Step by Step)

September 3, 2019October 9, 2026 PKComments Off on Animated Speedometer Chart in Excel with VBA (Step by Step)
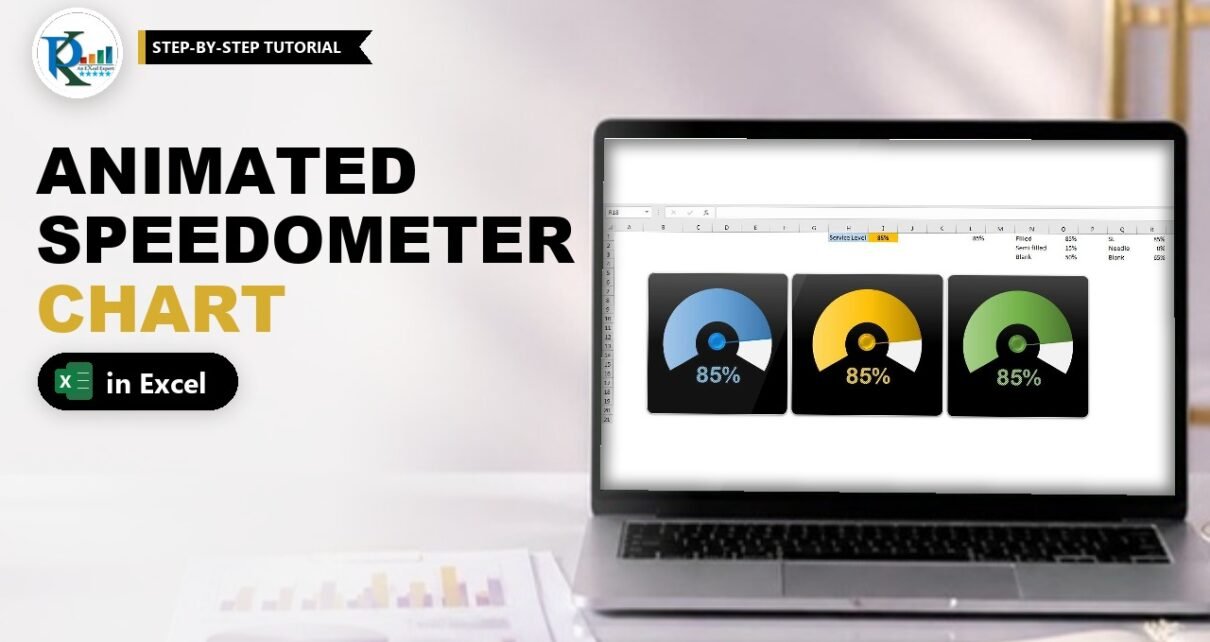
An animated speedometer chart in Excel does more than show a KPI: when the value changes, the coloured arc sweeps up from zero, the needle travels with it and the
Read More
Rating Meter Chart in Excel: 5-Bucket Gauge Step by Step
Charts and Visualization

Rating Meter Chart in Excel: 5-Bucket Gauge Step by Step

January 2, 2019October 9, 2026 PK0
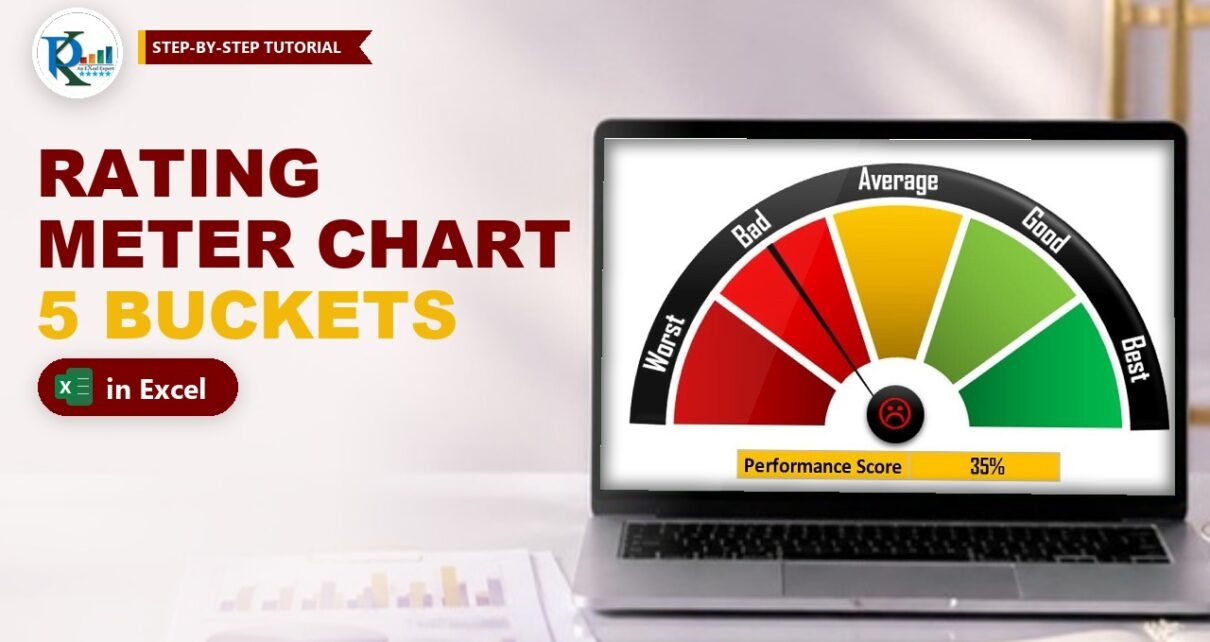
A rating meter chart in Excel turns a single performance score into a speedometer-style gauge that anyone can read in a second. The scale is split into five buckets, Worst,
Read More
Ultimate Speedometer in Excel: Shapes and VBA Gauge
Charts and Visualization

Ultimate Speedometer in Excel: Shapes and VBA Gauge

July 6, 2018October 9, 2026 PK0
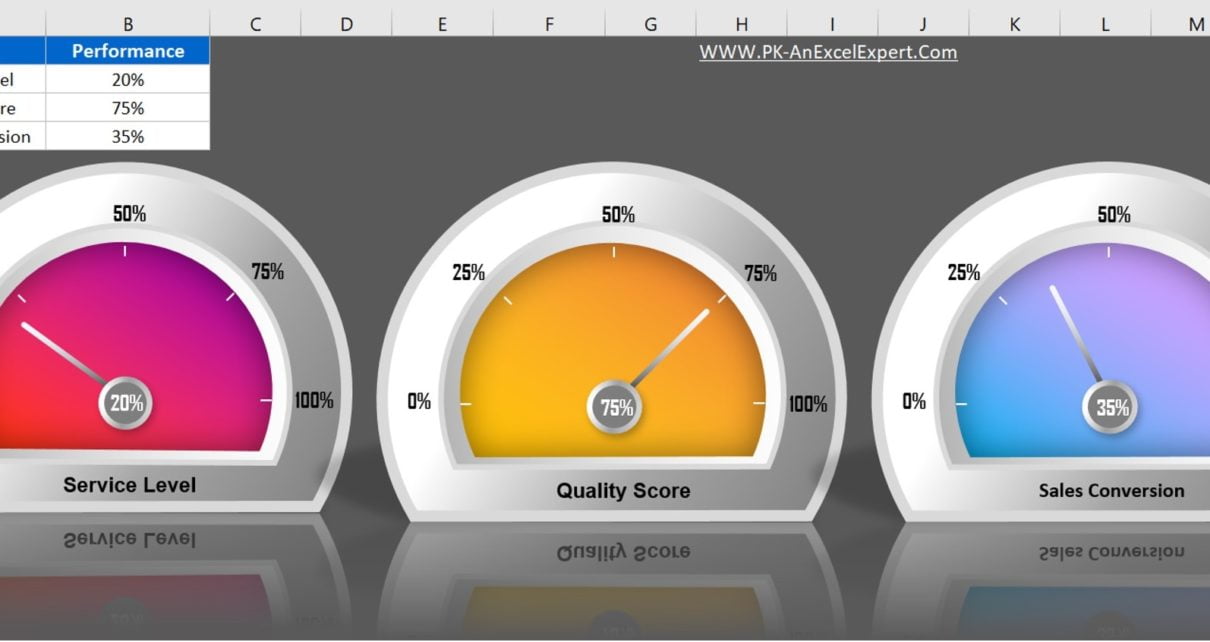
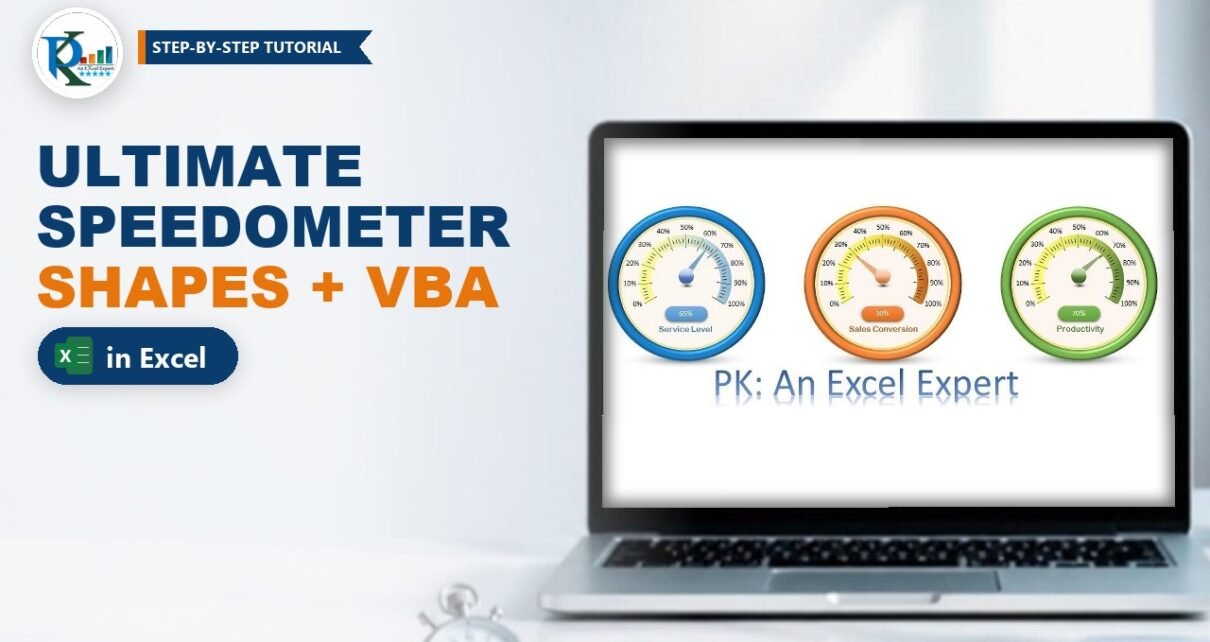
This speedometer in Excel is one of PK's favourite visuals, and it is not a chart at all. The dial, the coloured arc, the glossy ball and the needle are
Read More
  • Learn Excel (Free Course)
    • 1. Shortcut Keys
    • 2. Fill & Flash Fill
    • 3. Find & Replace
    • 4. Sort & Filter
    • 5. Formulas & Functions
    • 6. Data Validation
    • 7. Conditional Formatting
    • 8. Basic Charts
    • 9. Advanced Charts
    • 10. Pivot Tables
    • 11. Excel Dashboards
    • 12. VBA Course
    • 13. Excel Formulas with AI
  • Templates
  • Tutorials
    • Charts and Visualization
    • VBA
    • Excel Tips and Tricks
    • Excel Dashboards
    • Power Pivot & DAX
  • Power BI
  • Template Store
    • Ready to Use Templates
  • Courses
  • Academy
    • Excel + AI Mastery: 100 Formulas
    • Excel Pivot Tables & Dashboards
  • About Us
  • Contact Us
Copyright © 2023 PK-AnExcelExpert.com - Privacy Policy