In today’s digital world, technical support plays a central role in maintaining customer satisfaction, reducing churn, and ensuring seamless service delivery. Businesses rely on their support teams to resolve issues quickly, maintain strong communication with customers, and improve overall product or service experiences. However, tracking performance in technical support is often complex because multiple factors—such as resolution time, ticket backlog, service quality, and customer feedback—need to be measured.
This is where a Technical Support KPI Dashboard in Excel becomes invaluable. It provides a structured, data-driven, and visual approach to monitoring performance. Instead of working with scattered reports or manual spreadsheets, managers can view all critical KPIs in one place. This allows them to make informed decisions, track trends, and improve their team’s efficiency.
In this article, we will explore everything about the Technical Support KPI Dashboard in Excel—its structure, features, advantages, best practices, and practical uses. We will also answer some frequently asked questions at the end.
Click to buy Technical Support KPI Dashboard in Excel
What Is a Technical Support KPI Dashboard?
A Technical Support KPI Dashboard is an Excel-based reporting tool that consolidates key performance indicators related to technical support operations. It allows businesses to measure, track, and analyze the effectiveness of their support teams.
By using KPIs such as First Response Time, Average Resolution Time, Ticket Volume, Customer Satisfaction Score, and SLA Breach Percentage, the dashboard provides a complete picture of technical support performance. Managers can compare actual performance with targets, analyze trends, and implement corrective actions when needed.
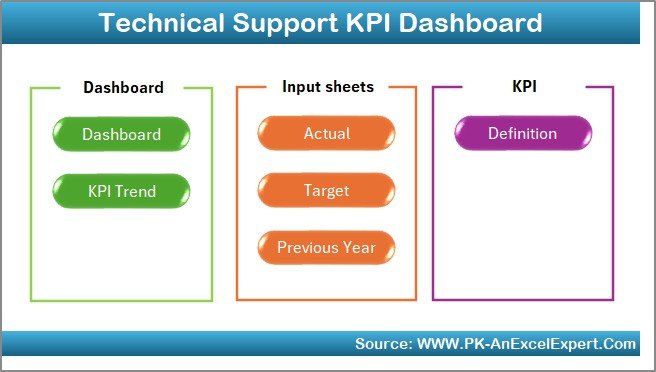
Key Features of the Technical Support KPI Dashboard in Excel
This ready-to-use dashboard has been designed with seven interactive worksheets. Each sheet focuses on a specific area of data input, visualization, or reporting.
- Home Sheet
- Serves as the index page.
- Contains six navigation buttons to jump directly to the respective worksheet.
- Provides a clean and user-friendly interface.
Click to buy Technical Support KPI Dashboard in Excel
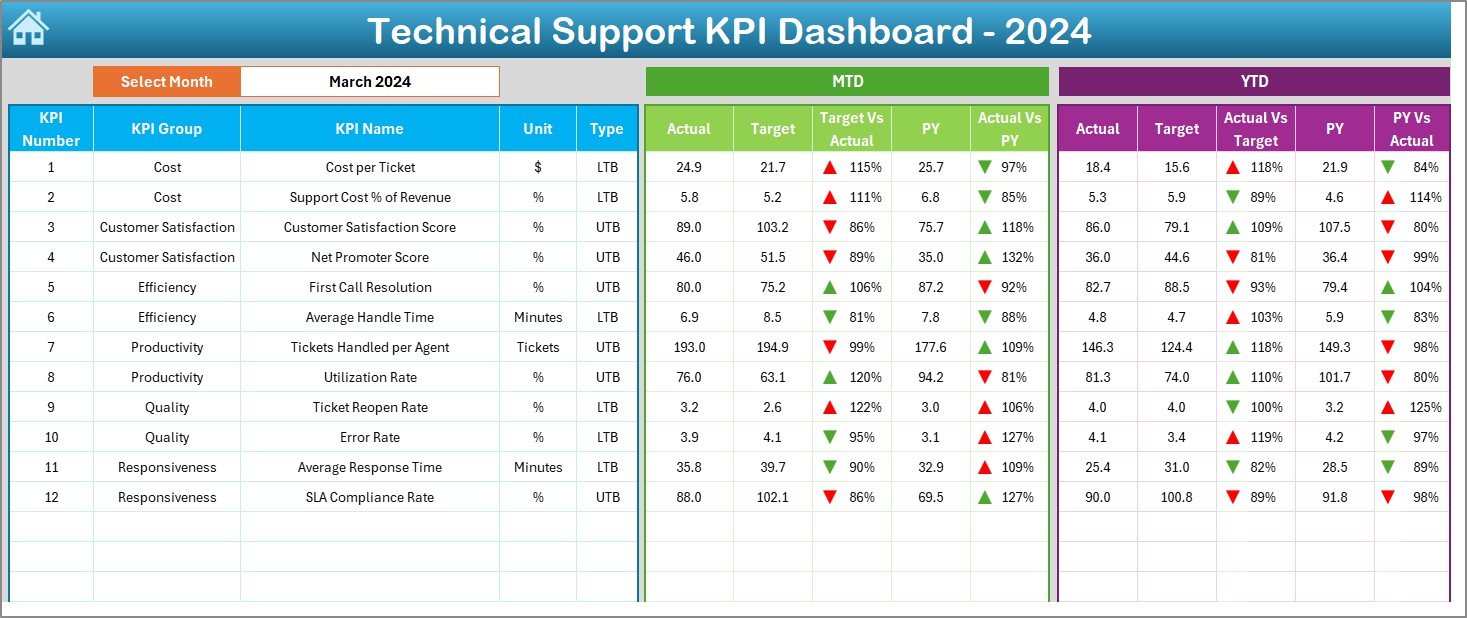
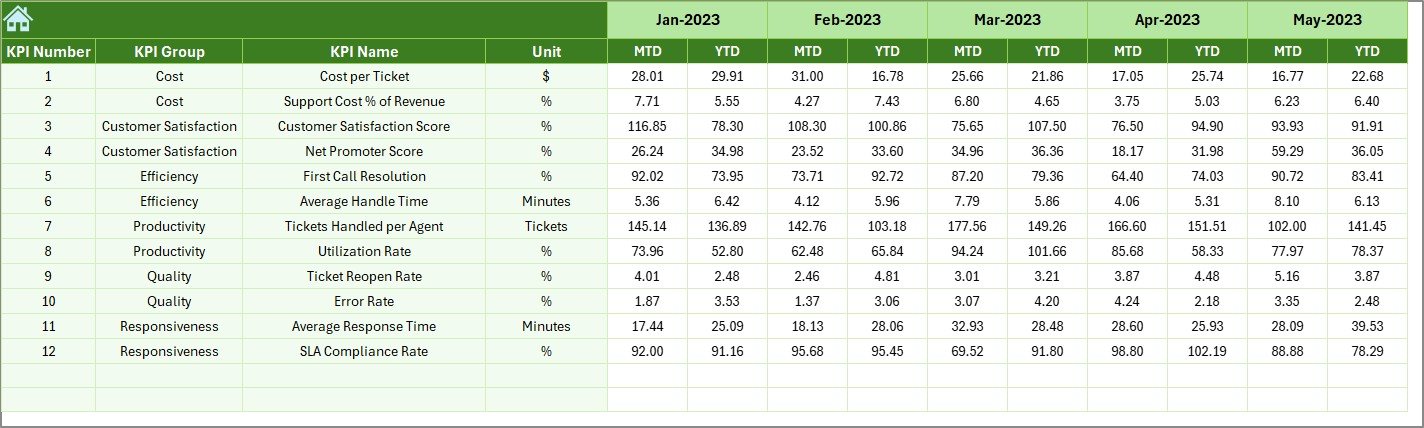
- Dashboard Sheet
- The main visual reporting sheet.
- Drop-down menu on cell D3 allows you to select the month.
- Displays MTD (Month-to-Date) and YTD (Year-to-Date) numbers.
- Shows comparisons for:
- Actual vs Target
- Actual vs Previous Year
- Includes conditional formatting with arrows for quick insights .
Click to buy Technical Support KPI Dashboard in Excel
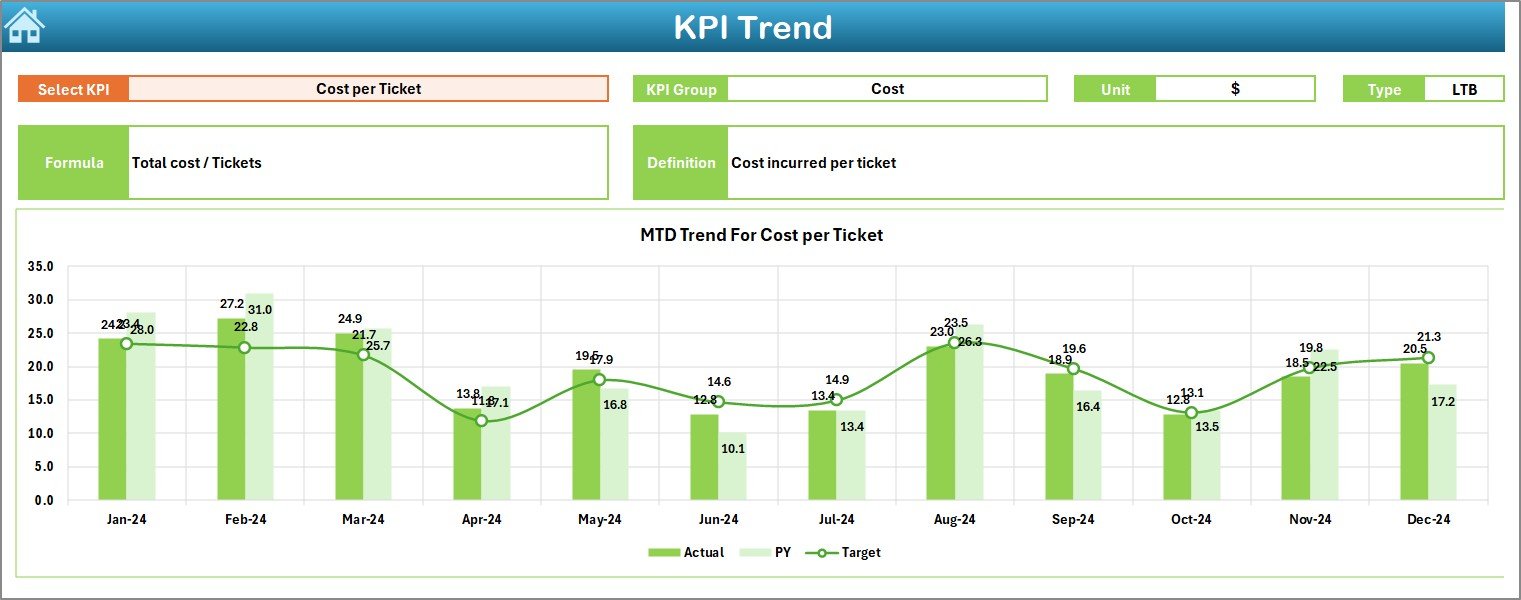
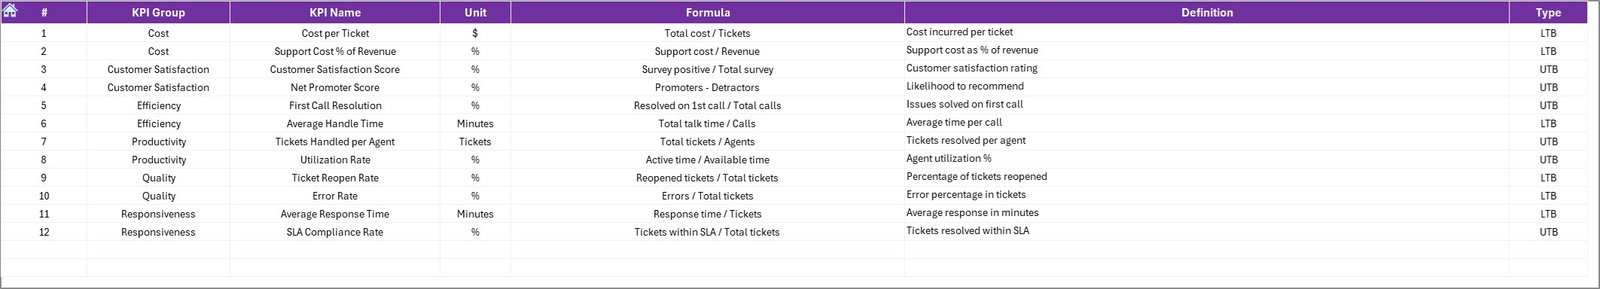
- KPI Trend Sheet
- Drop-down menu on cell C3 lets you choose the KPI name.
- Displays:
- KPI Group
- Unit
- Type (UTB = Upper the Better, LTB = Lower the Better)
- Formula
- Definition
- Provides trend charts for both MTD and YTD values compared against target and previous year.
Click to buy Technical Support KPI Dashboard in Excel
- Actual Numbers Input Sheet
- Designed for entering monthly actual values for each KPI.
- Editable from cell E1 to define the starting month of the year.
- User-friendly data entry ensures smooth updates.
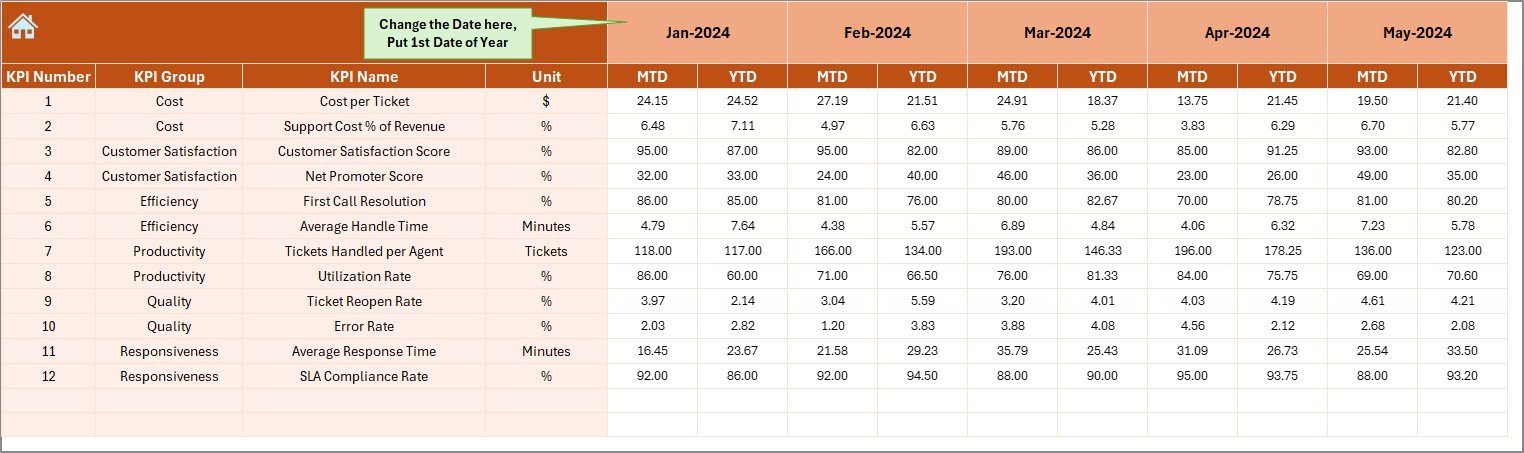
- Target Sheet
- Contains monthly target values for each KPI.
- Allows both MTD and YTD targets.
- Helps teams set realistic goals and track performance.
Click to buy Technical Support KPI Dashboard in Excel
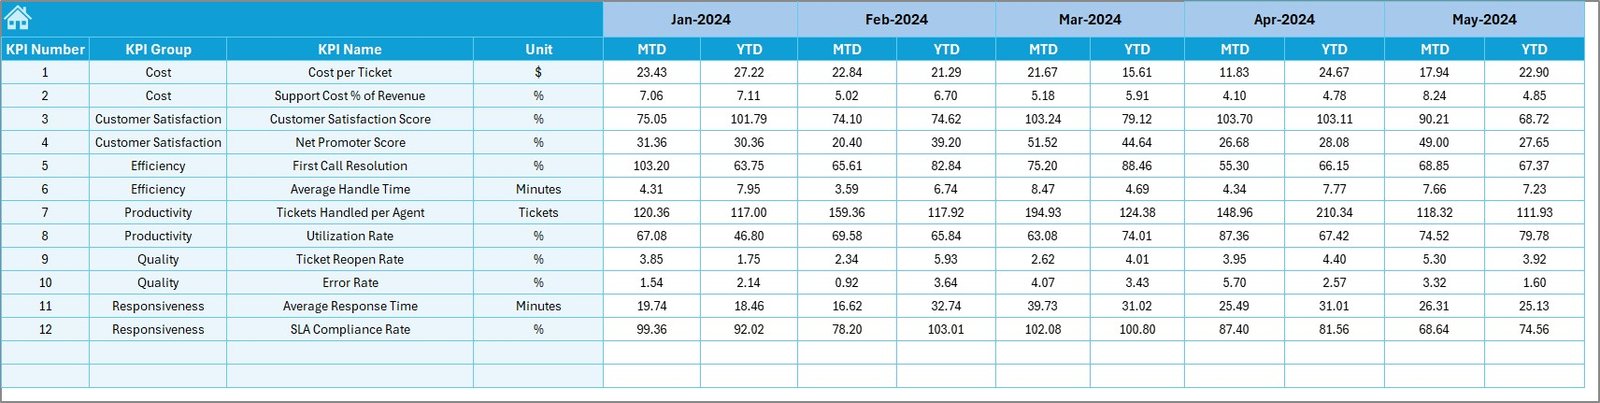
- Previous Year Numbers Sheet
- Used for entering historical data for benchmarking.
- Helps compare current year vs last year’s performance.
- KPI Definition Sheet
- A reference table containing:
- KPI Name
- KPI Group
- Unit
- Formula
- KPI Definition
- Provides clarity to team members and ensures consistency.
Click to buy Technical Support KPI Dashboard in Excel
Why Should Businesses Use a Technical Support KPI Dashboard?
Tracking performance manually is time-consuming and often leads to errors. An Excel-based dashboard helps centralize information and provides powerful insights.
Key benefits include:
- Centralized Data: All KPIs are tracked in one place.
- Better Decision-Making: Clear visuals highlight problem areas.
- Improved Accountability: Teams know which metrics matter most.
- Historical Benchmarking: Previous year’s data enables performance comparisons.
- Flexibility: Easily customizable based on organizational needs.
Important KPIs for Technical Support
To measure performance effectively, the dashboard includes a wide range of KPIs. Here are the most common ones:
- First Response Time (FRT): Measures how quickly support responds to a new ticket.
- Average Resolution Time (ART): Tracks the average time taken to resolve tickets.
- Tickets Resolved per Agent: Helps assess individual productivity.
- Ticket Backlog: Shows unresolved tickets pending in the system.
- SLA Breach %: Percentage of cases where resolution exceeded agreed timelines.
- Customer Satisfaction (CSAT): Based on customer feedback surveys.
- Net Promoter Score (NPS): Indicates overall customer loyalty.
- Escalation Rate: Measures how often cases are escalated to higher levels.
- Repeat Tickets %: Shows how often customers report recurring issues.
Advantages of a Technical Support KPI Dashboard
A well-structured dashboard offers multiple benefits for businesses.
- Real-Time Insights – View updated performance at a glance.
- Time Savings – Automated calculations reduce manual reporting.
- Target Alignment – Helps align team performance with business objectives.
- Trend Analysis – Charts highlight performance over months.
- Transparency – Clear KPIs help improve accountability across the team.
- Early Problem Detection – Identifies rising ticket backlogs or SLA breaches.
Opportunities for Improvement Using the Dashboard
Even the best dashboards can be improved. Businesses can enhance their use of KPI dashboards by:
- Adding automation with VBA for faster updates.
- Integrating with CRM or ticketing systems for real-time data sync.
- Expanding KPI coverage to include cost per ticket or self-service usage.
- Using data validation rules for cleaner inputs.
- Adding department-level breakdowns to track performance by teams.
Best Practices for the Technical Support KPI Dashboard
To maximize the value of this Excel tool, businesses should follow these best practices:
- Define Clear KPIs: Choose only the KPIs relevant to your support goals.
- Update Regularly: Ensure actual and target values are updated each month.
- Keep It Simple: Avoid clutter—use clear visuals and concise definitions.
- Engage the Team: Share the dashboard with support agents to build accountability.
- Review Trends: Look beyond monthly data and analyze YTD performance.
- Benchmark Performance: Compare current year with the previous year for insights.
How to Use the Technical Support KPI Dashboard in Excel
- Input Actual Data: Enter monthly performance numbers in the “Actual Numbers” sheet.
- Set Targets: Define monthly and yearly targets in the “Target” sheet.
- Update Previous Year’s Data: Add last year’s numbers for benchmarking.
- Review KPIs: Use the KPI Definition sheet to ensure clarity.
- Visualize Trends: Open the Dashboard sheet and select the desired month.
- Analyze Performance: Compare MTD and YTD results with targets and previous year.
- Take Action: Identify problem areas (like SLA breaches or backlog growth) and take corrective measures.
Conclusion
The Technical Support KPI Dashboard in Excel is a must-have tool for any business that values customer satisfaction and operational efficiency. By consolidating data, simplifying reporting, and offering clear insights, this dashboard empowers managers to lead their teams effectively. It bridges the gap between data collection and decision-making, ensuring that businesses not only meet but exceed customer expectations.
Whether you run a small startup or a large enterprise, this dashboard helps you track, analyze, and improve the performance of your technical support team with ease.
Frequently Asked Questions (FAQs)
- What is a Technical Support KPI Dashboard?
It is an Excel-based tool that tracks and visualizes key performance indicators for technical support teams.
- Which KPIs should I include in a technical support dashboard?
Common KPIs include First Response Time, Average Resolution Time, Customer Satisfaction Score, Ticket Backlog, and SLA Breach %.
- Can I customize this Excel dashboard?
Yes, the dashboard is fully customizable. You can add or remove KPIs based on your business requirements.
- How often should I update the dashboard?
You should update it monthly to ensure accuracy in both MTD and YTD reporting.
- Is this dashboard suitable for small businesses?
Yes, it works for businesses of all sizes. Small businesses can start with fewer KPIs and scale up later.
- Can this dashboard integrate with other systems?
While Excel is standalone, you can connect it with CRM or ticketing systems using data imports or automation scripts.
- What is the main benefit of using this dashboard?
The main benefit is real-time visibility into technical support performance, enabling faster and smarter decision-making.
Visit our YouTube channel to learn step-by-step video tutorials
Watch the step-by-step video tutorial:
Click to buy Technical Support KPI Dashboard in Excel