In today’s competitive business world, sales and territory management play a critical role in growth. Companies operate across multiple regions, territories, and customer segments. To manage these territories effectively, organizations need real-time visibility of performance metrics. A Territory Management KPI Dashboard in Excel provides this clarity.
This dashboard tracks, analyzes, and visualizes performance at the territory level. It helps managers and decision-makers align targets, compare achievements, and identify gaps. With the right insights, leaders can allocate resources more effectively, enhance sales productivity, and drive sustainable business growth.
Click to buy Territory Management KPI Dashboard in Excel
In this article, we will explore:
- What a Territory Management KPI Dashboard is
- Key features of the Excel-based template
- Advantages of using this tool
- Opportunities for improvement
- Best practices for implementation
- Real-world use cases
- And answers to frequently asked questions
What Is a Territory Management KPI Dashboard?
A Territory Management KPI Dashboard is a reporting tool that consolidates key performance indicators (KPIs) for different sales territories or regions into a single, interactive interface. Instead of manually analyzing scattered reports, managers can instantly see how each territory is performing against set goals.
This dashboard is built in Excel, which makes it user-friendly, cost-effective, and customizable. It provides a snapshot of monthly and yearly achievements, tracks targets versus actual performance, and highlights areas that require attention.
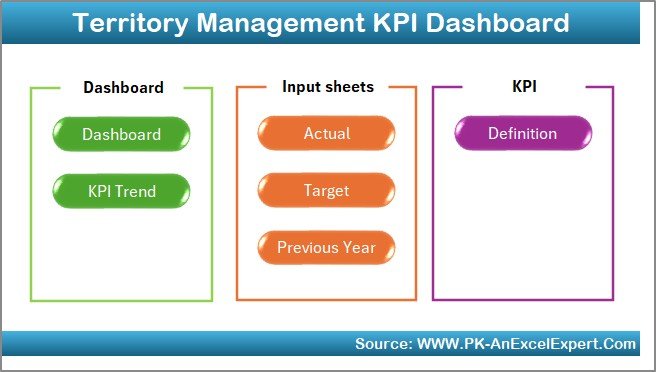
Key Features of the Territory Management KPI Dashboard in Excel
This ready-to-use Excel dashboard includes seven powerful worksheets designed to make territory performance tracking simple and efficient:
Home Sheet
- Acts as the index page of the file.
- Contains navigation buttons to jump quickly to different sheets.
- Saves time and improves usability.
Click to buy Territory Management KPI Dashboard in Excel
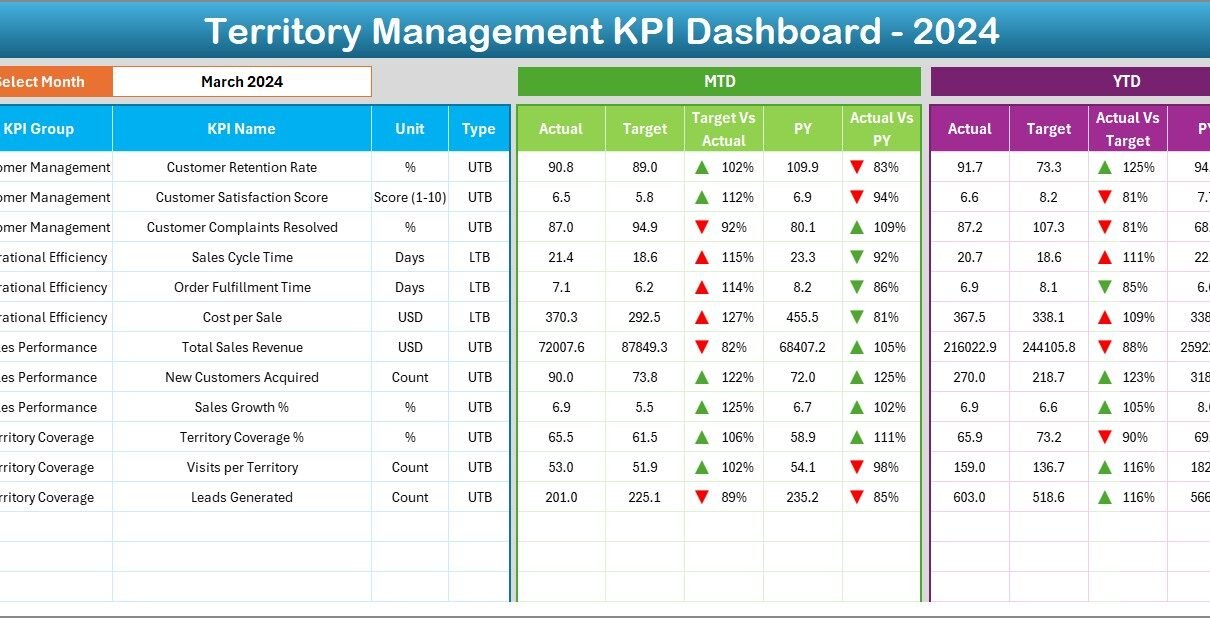
Dashboard Sheet
- The central view for monitoring all KPIs.
- Allows selection of any month from a dropdown.
- Displays MTD (Month-to-Date) and YTD (Year-to-Date) performance.
- Includes conditional formatting with up/down arrows to indicate performance trends.
- Shows comparisons with both targets and previous year numbers.

Click to buy Territory Management KPI Dashboard in Excel
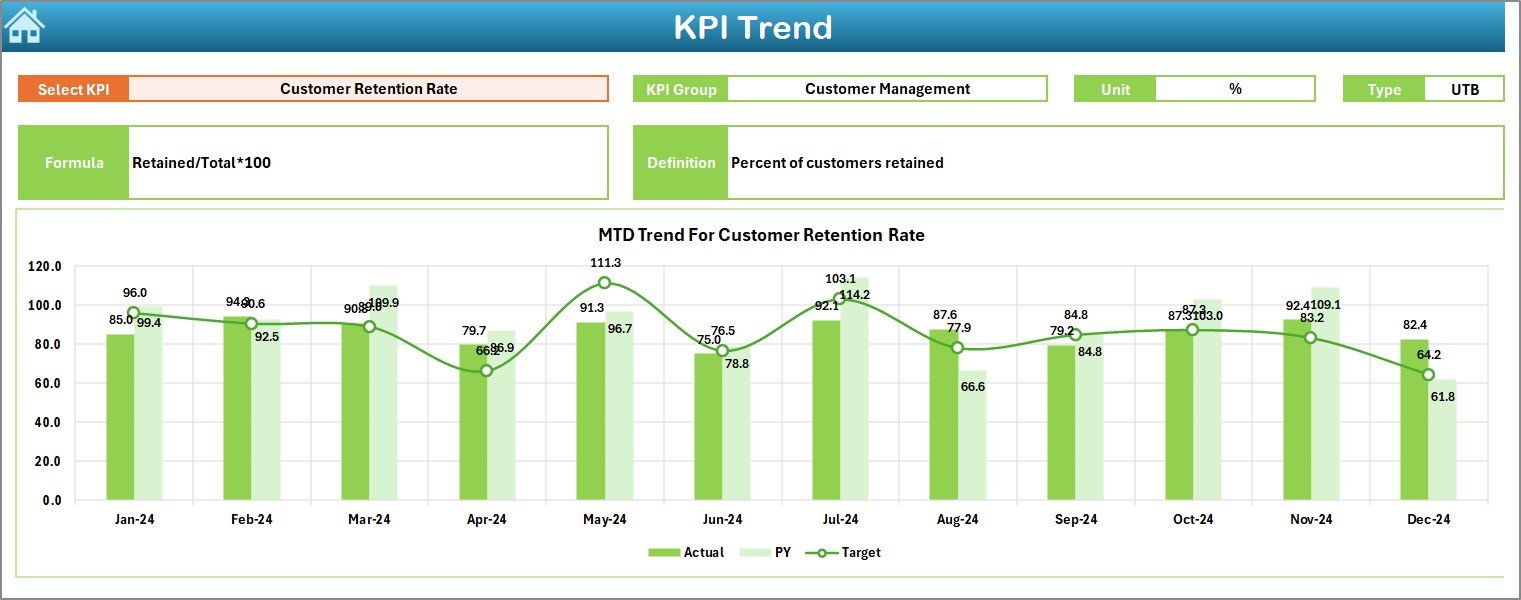
KPI Trend Sheet
- Provides detailed performance trends over time.
- Allows users to select a KPI from a dropdown.
- Displays KPI group, unit, formula, and type (Lower the Better / Upper the Better).
- Shows MTD and YTD trends for Actual, Target, and Previous Year numbers.
Actual Numbers Input Sheet
- Designed for manual entry of actual MTD and YTD figures.
- Month selection is available in cell E1.
- Ensures that data entry remains straightforward.

Click to buy Territory Management KPI Dashboard in Excel
Target Sheet
- Stores monthly and yearly targets for each KPI.
- Supports both MTD and YTD target entry.
- Helps managers compare achievements against goals.

Previous Year Numbers Sheet
- Maintains data from the previous year.
- Useful for conducting YoY (Year-on-Year) analysis.
- Helps measure improvements or declines across territories.
Click to buy Territory Management KPI Dashboard in Excel
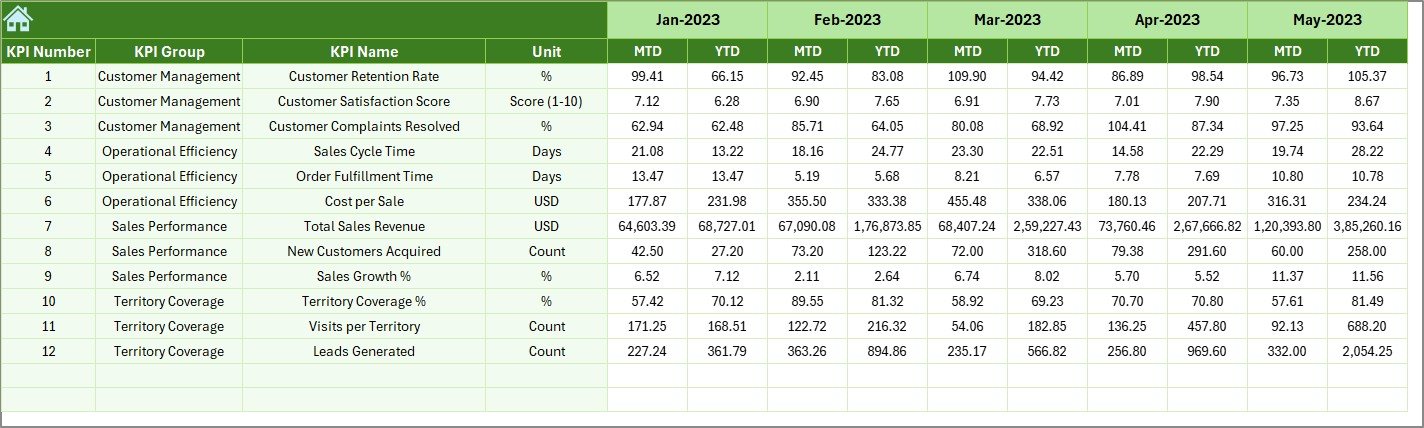
KPI Definition Sheet
- A reference sheet that defines each KPI clearly.
- Includes KPI name, group, unit, formula, and definition.
- Helps ensure consistency and transparency in reporting.
Why Use a Territory Management KPI Dashboard?
Managing territories without a dashboard can feel like navigating without a map. Businesses that rely on manual reports face delays, inefficiencies, and missed opportunities. A dashboard, however, provides:
- Real-time visibility of performance data
- Quick insights into strong and weak territories
- Easy comparison of current performance with targets and past results
- Standardized KPI definitions for consistency across the organization
Advantages of Territory Management KPI Dashboard
Using this Excel dashboard offers several advantages:
- Centralized Data Tracking
- All territory KPIs are stored in one place.
- Eliminates the need for multiple spreadsheets.
- Improved Decision-Making
- Clear visuals make it easier to identify problem areas.
- Managers can reallocate resources quickly.
- Time Savings
- Automatic calculations reduce manual effort.
- Interactive features speed up data analysis.
- Enhanced Transparency
- KPI definitions ensure that everyone interprets metrics the same way.
- Reduces miscommunication across departments.
- Cost-Effective
- Built entirely in Excel—no expensive software required.
- Easy to implement across organizations of all sizes.
Opportunities for Improvement
While the dashboard is powerful, organizations can enhance it further by:
- Automating data entry using Power Query or VBA integration.
- Linking external data sources such as CRM tools or ERP systems.
- Adding role-based access for different users.
- Creating mobile-friendly versions for on-the-go managers.
- Expanding KPIs to include customer satisfaction, retention, and acquisition.
Best Practices for the Territory Management KPI Dashboard
To maximize the effectiveness of this tool, follow these best practices:
- Keep KPI definitions simple – Avoid overly complex formulas.
- Update data regularly – Enter numbers at least once a month.
- Use consistent formats – Ensure all territories use the same units and standards.
- Review trends, not just numbers – Look at YoY and MoM changes to spot patterns.
- Train users – Ensure team members understand how to interpret the dashboard.
- Set realistic targets – Align targets with market conditions and capacity.
Real-World Applications
The Territory Management KPI Dashboard can be applied across industries:
- Sales teams – Track performance of sales representatives in different regions.
- Retail chains – Compare sales across stores or outlets.
- Healthcare providers – Monitor patient visits or services by territory.
- Logistics companies – Track delivery success rates across regions.
- Manufacturers – Monitor distribution efficiency and market penetration.
How to Get Started with the Dashboard
- Download the template and open it in Excel.
- Go to the KPI Definition Sheet and set up the KPIs you want to track.
- Enter targets in the Target Sheet.
- Input actual performance numbers in the Actual Numbers Input Sheet.
- Compare results on the Dashboard and KPI Trend sheets.
- Analyze insights and take corrective actions.
Conclusion
A Territory Management KPI Dashboard in Excel is more than just a reporting tool—it is a powerful decision-making companion. By consolidating territory-level KPIs into one interactive interface, businesses can boost transparency, improve resource allocation, and accelerate growth.
When used with discipline and best practices, this dashboard becomes a competitive advantage. Whether you manage a sales force, a retail chain, or a logistics network, this tool can transform how you track performance and make decisions.
Frequently Asked Questions (FAQs)
- What is the purpose of a Territory Management KPI Dashboard?
It helps managers monitor performance across territories, compare actuals with targets, and make informed decisions.
- Can this dashboard be customized for my business?
Yes. Since it is built in Excel, you can add KPIs, adjust formulas, and redesign visuals as per your needs.
- Do I need advanced Excel skills to use this dashboard?
No. Basic Excel knowledge is enough for data entry and navigation. However, advanced users can add automation.
- How often should I update the dashboard?
At least once a month. For fast-moving industries, weekly updates may be beneficial.
- Can I link this dashboard with my CRM or ERP?
Yes. With Excel’s Power Query or VBA, you can connect external databases.
- Is this dashboard suitable for small businesses?
Absolutely. It is cost-effective and easy to implement, making it ideal for both small and large businesses.
- What KPIs should I include in my territory management?
Common KPIs include sales volume, revenue growth, customer acquisition, churn rate, and delivery success.
- Can multiple team members use the dashboard?
Yes. You can share the file, but for simultaneous use, consider Excel Online or SharePoint integration.
Visit our YouTube channel to learn step-by-step video tutorials
Watch the step-by-step video tutorial:
Click to buy Territory Management KPI Dashboard in Excel