Managing a venture capital fund becomes easier when you track the right KPIs in a clear and organized system. When you use an Excel-based Venture Capital KPI Dashboard, you follow every performance indicator and monitor portfolio progress without switching between tools. Because Excel is flexible and powerful, you can build an interactive KPI dashboard that shows insights in real-time, even when you handle multiple startups and investment rounds.
In this detailed guide, you will learn everything about the Venture Capital KPI Dashboard in Excel. You will also understand how each sheet works, how you can update the data, and how this dashboard improves decision-making for venture capital teams. Moreover, you will get practical tips, advantages, best practices, and answers to common questions.
Click to buy Venture Capital KPI Dashboard in Excel
What Is a Venture Capital KPI Dashboard in Excel?
A Venture Capital KPI Dashboard in Excel is a structured tool that helps investors track, measure, and analyze the performance of startups in a simple, visual, and interactive way. Since Excel supports formulas, charts, slicers, and conditional formatting, you can build a powerful dashboard that gives both monthly and yearly insights.
You can track metrics such as cash burn, valuation, customer growth, product traction, and revenue efficiency. Because of Excel’s flexibility, you can customize KPI sets based on your investment strategy, portfolio size, or reporting format.
Why Do Venture Capital Firms Need a KPI Dashboard?
Venture capital teams handle multiple founders, investment rounds, business models, and financial goals. If the data stays in separate sheets, emails, or presentations, then insights become difficult to find. A structured Excel dashboard solves this challenge.
Here is why venture capital firms rely on KPI dashboards:
- They track KPIs in a single location.
- They compare actual performance with targets every month.
- They monitor MTD (Month-to-Date) and YTD (Year-to-Date) numbers.
- They quickly review performance trends.
- They take decisions based on real data instead of assumptions.
- They save time by using automation and formulas.
When all key numbers stay in one dashboard, decision-makers act faster and invest more confidently.
Key Features of the Venture Capital KPI Dashboard in Excel
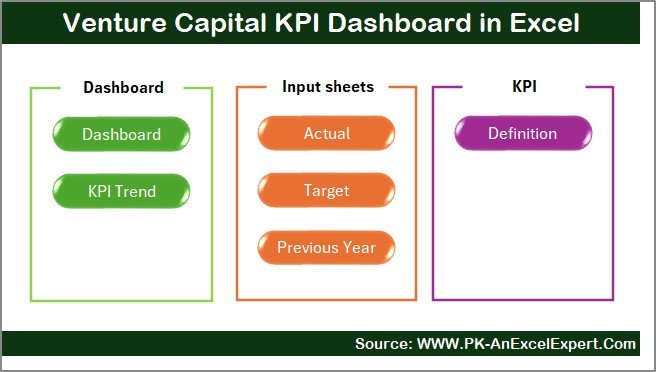
Your dashboard includes 7 smart worksheets, and each plays a unique role. Let’s explore them one by one.
Summary Page – The Navigation Hub
The Summary Page works like the homepage of the dashboard. You will find six clear and clickable buttons here. When you click a button, Excel takes you directly to the selected sheet. Because of this index system, you save time and move between sheets without scrolling through tabs.
This page improves user experience and helps new users understand the structure of the dashboard instantly.
Click to buy Venture Capital KPI Dashboard in Excel
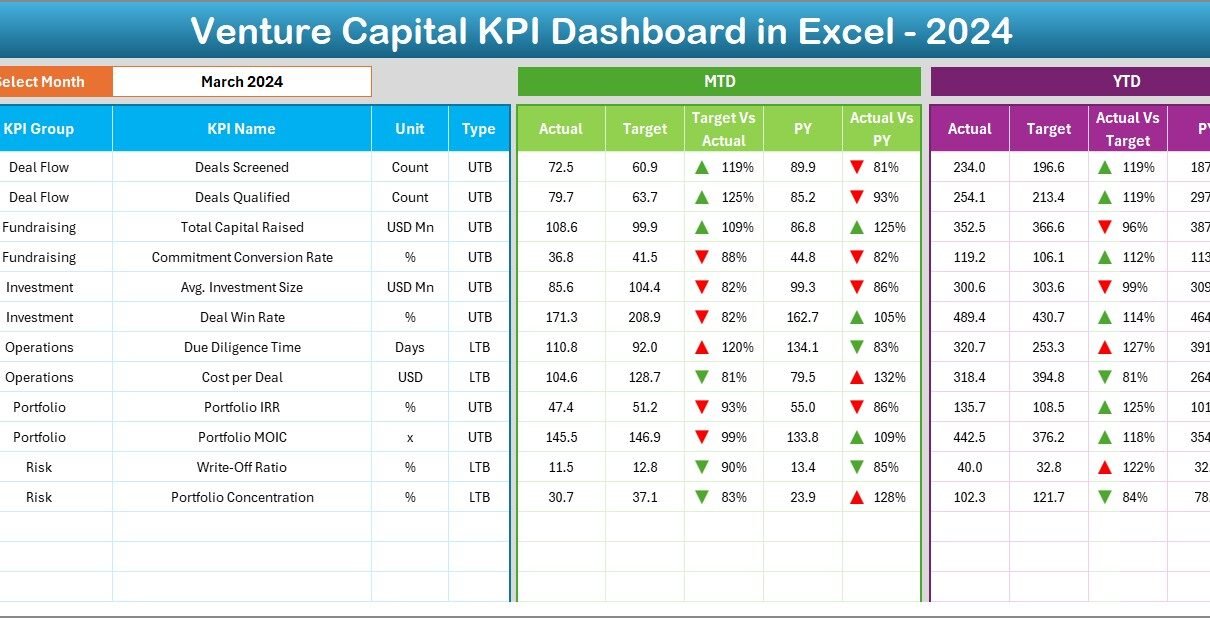
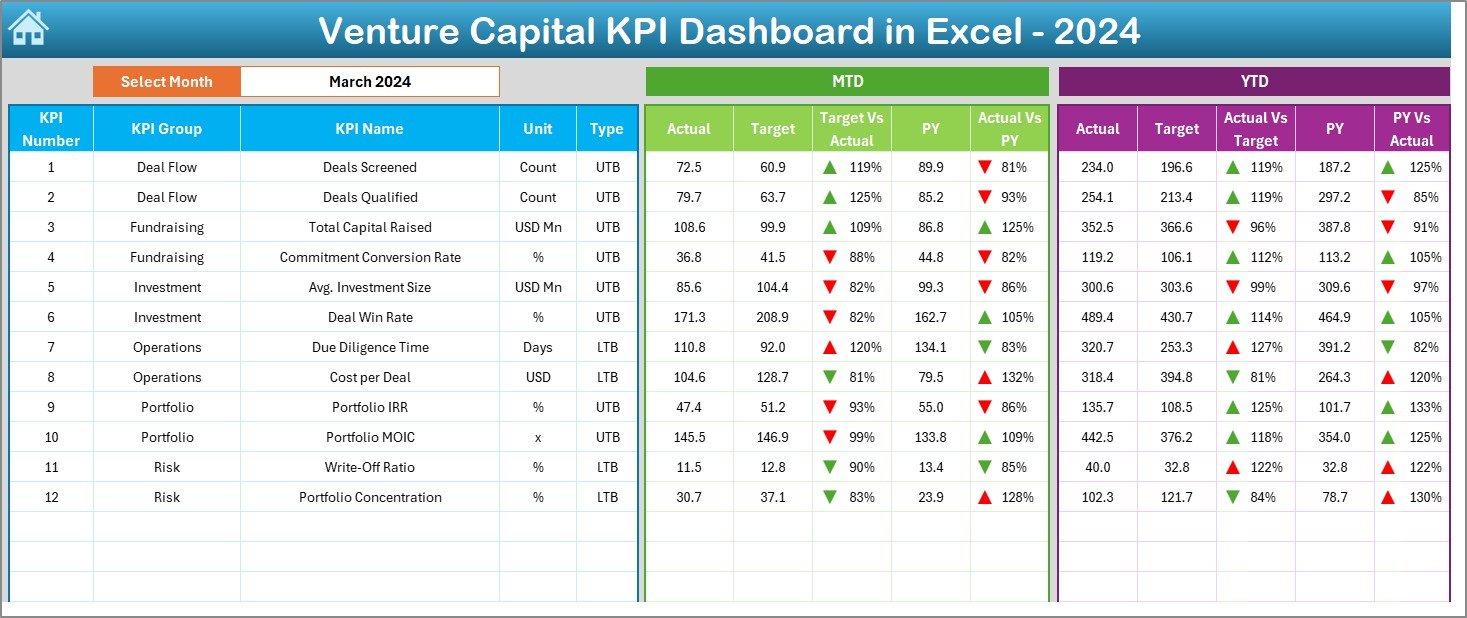
Dashboard Sheet – The Main Performance View
The Dashboard Sheet displays all essential KPIs in a clean, visual layout. Since this is the main sheet, it delivers both monthly and yearly insights with one drop-down control.
What You Can See Here
- A drop-down in cell D3 to select the month
- MTD Actual vs Target values
- MTD Actual vs Previous Year (PY) values
- YTD Actual vs Target values
- YTD Actual vs Previous Year (PY) values
- Conditional formatting arrows (green ↑ for positive, red ↓ for negative)
As soon as you choose a different month, the entire dashboard updates instantly. This helps managers understand what changed, why it changed, and how the portfolio performs over time.
Why This Sheet Matters
- You compare KPIs in real-time.
- You find performance gaps quickly.
- You monitor both growth and risk indicators.
- You make faster investment decisions.
Click to buy Venture Capital KPI Dashboard in Excel
Trend Sheet – KPI Trends and Insights
The Trend Sheet helps you analyze performance over time. You simply choose the KPI from the drop-down in cell C3, and the dashboard shows:
- KPI Group
- Unit of Measurement
- KPI Type (LTB or UTB)
- KPI Formula
- KPI Definition
- MTD Trend Chart
- YTD Trend Chart
- Actual, Target, and PY lines
These charts show growth patterns and help you find whether the KPI improves or declines across months.
Why the Trend Sheet Is Valuable
- You see long-term performance for every KPI.
- You identify patterns like rapid growth, slow decline, or sudden spikes.
- You compare monthly performance with targets and previous year numbers.
- You prepare portfolio reports with clear graphs.
Click to buy Venture Capital KPI Dashboard in Excel
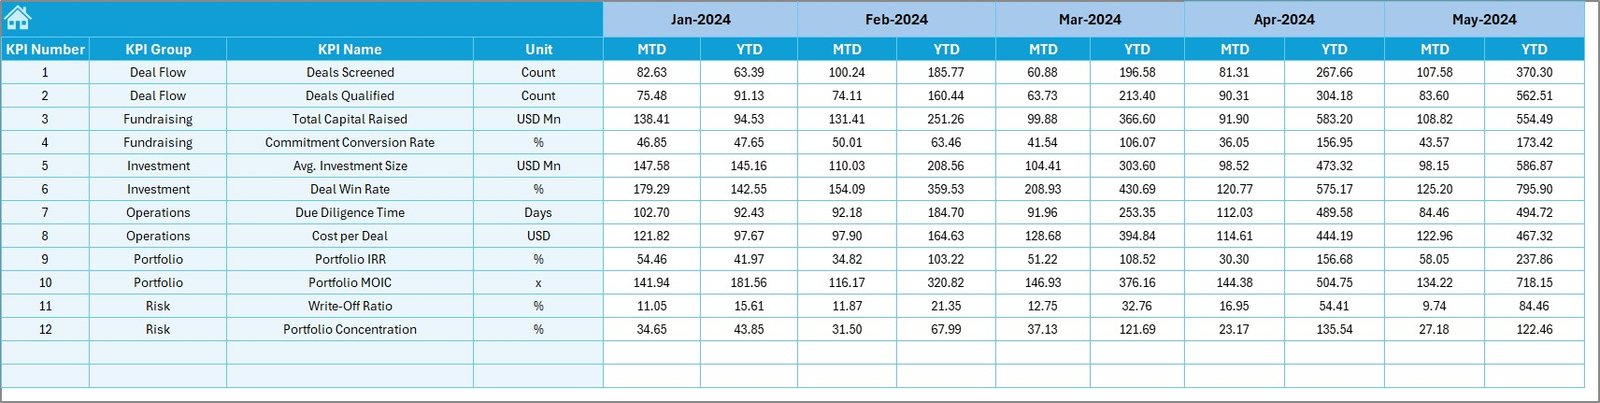
Actual Numbers Input Sheet – Update Actual KPI Data Easily
This sheet allows you to enter actual KPI numbers for each month. You can change the fiscal year start month using cell E1, making the dashboard flexible for different business cycles.
How It Works
- Enter MTD and YTD actual values.
- Choose the correct month.
- Update KPI values for each startup or portfolio segment.
As soon as you update this sheet, the dashboard and trend charts change automatically.
Click to buy Venture Capital KPI Dashboard in Excel
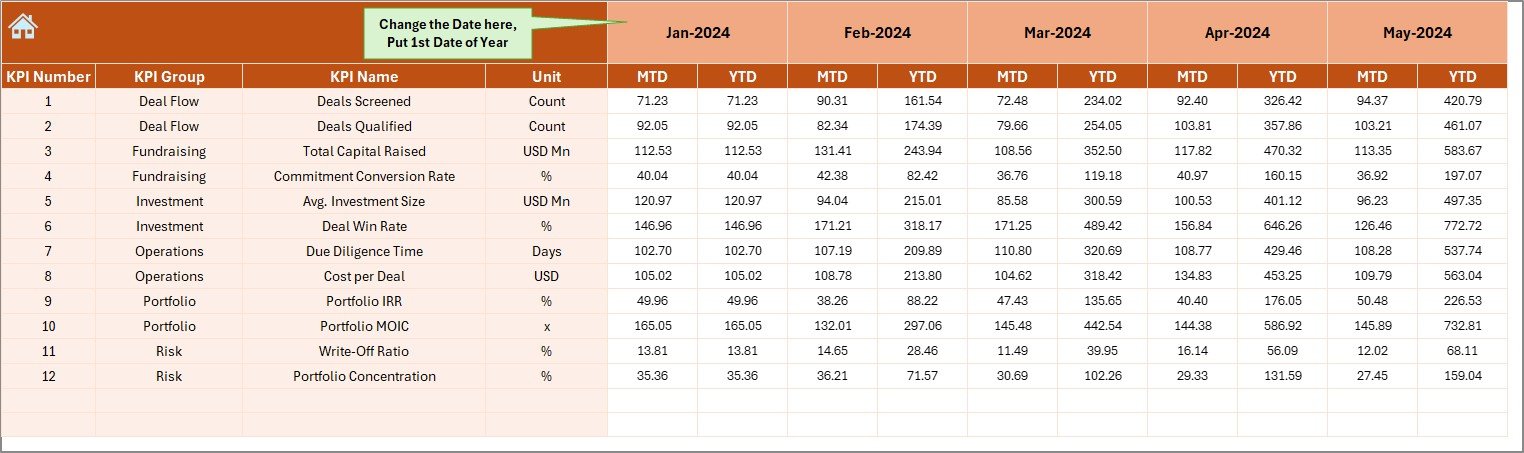
Target Sheet – Add Monthly and Yearly Targets
In the Target Sheet, you enter MTD and YTD target values for each KPI. Because KPIs vary by portfolio and strategy, you can adjust these numbers based on:
- Growth expectations
- Product roadmap
- Funding cycle
- Market situation
- Founder performance
Setting targets keeps your team aligned and creates a clear performance benchmark.
Click to buy Venture Capital KPI Dashboard in Excel
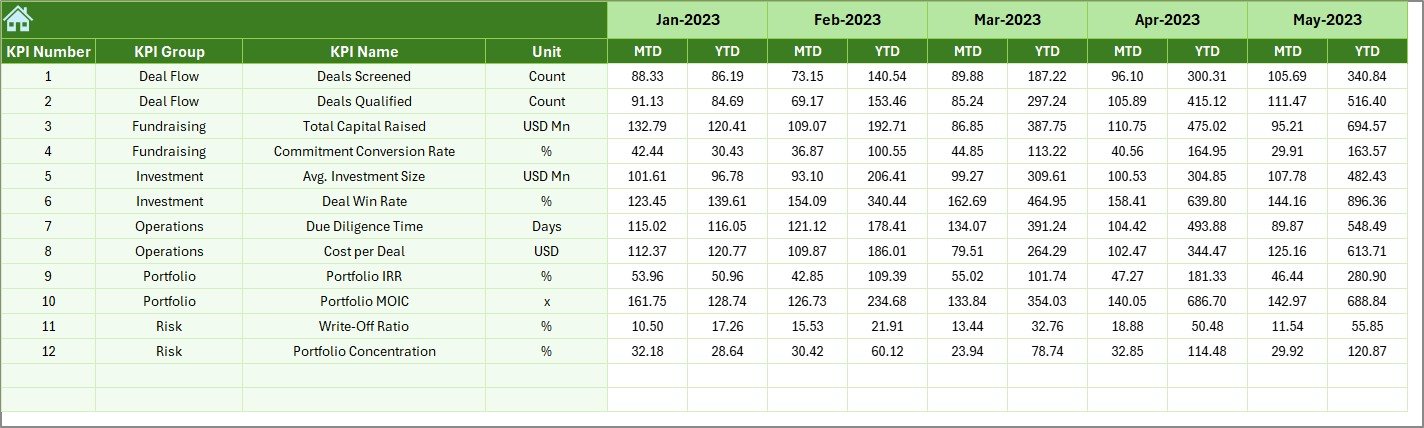
Previous Year Numbers Sheet – Compare With Last Year
This sheet stores the previous year’s actual values. It works the same way as the current year sheet. When you fill this sheet:
- The Dashboard sheet compares PY vs Actual
- Arrows show whether you improved or declined
- Trend charts display growth patterns year-over-year
Since VC decisions rely heavily on performance improvement, this comparison becomes essential.
Click to buy Venture Capital KPI Dashboard in Excel
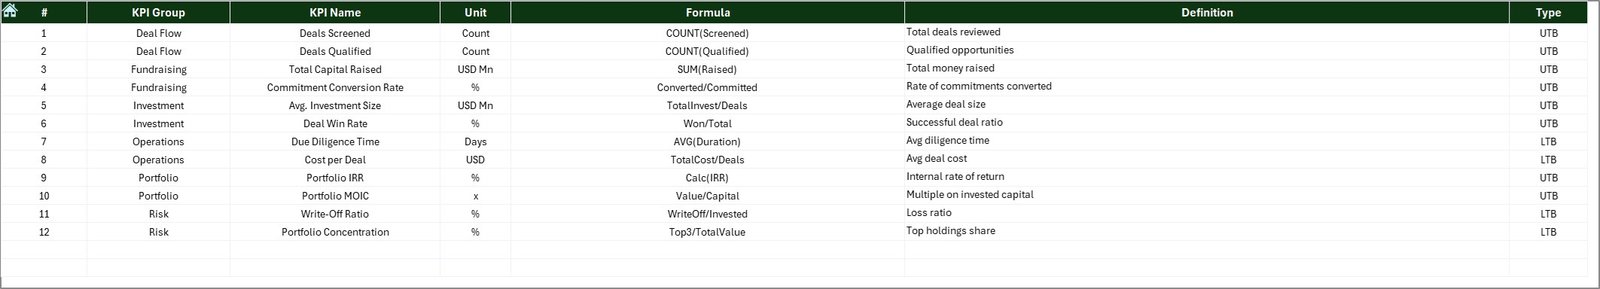
KPI Definition Sheet – Define Every KPI Clearly
In this sheet, you enter all KPI details in a structured format:
- KPI Name
- KPI Group
- Unit
- Formula
- KPI Definition
- Type (Lower the Better or Upper the Better)
This sheet helps new users, team members, or founders understand each KPI quickly.
What KPIs Should a Venture Capital Dashboard Include?
Here are the most common KPIs investors track:
- Cash Burn Rate
- Revenue Growth Rate
- Customer Acquisition Cost (CAC)
- Customer Lifetime Value (CLTV)
- Runway Months
- Operating Margin
- Monthly Recurring Revenue (MRR)
- Annual Recurring Revenue (ARR)
- Profit Margin
- Churn Rate
- Valuation
- Net Revenue Retention
- Gross Margin
- Sales Pipeline Growth
- Fund Utilization Metrics
You can add or remove KPIs based on your investment model.
How Does This Dashboard Improve Venture Capital Decisions?
The dashboard offers many strategic benefits:
- It highlights underperforming startups early.
- It shows which KPIs meet or miss the targets.
- It allows data-driven discussions with founders.
- It helps you allocate funds more intelligently.
- It improves the accuracy of monthly and quarterly reporting.
- It saves time compared to manual reporting or PowerPoint-driven workflows.
When you monitor trends regularly, you reduce risk and increase investment success rates.
Advantages of Using a Venture Capital KPI Dashboard in Excel
- Better Visibility Across All Investments
You see every KPI clearly in one place and understand how your portfolio performs without opening multiple files.
- Faster Decision-Making
Since the dashboard updates automatically, you spot problems early. This helps you guide founders with accurate data.
- Easy Customization
You can add new KPIs, change months, update formulas, or add charts. Excel provides complete control.
- Improved Reporting
The dashboard includes charts, slicers, and conditional formatting. Because of that, your monthly review reports become more impressive and easier to understand.
- Saves Time and Reduces Errors
You avoid manual calculations and reduce reporting mistakes. Excel automates most of the KPI work.
- User-Friendly for All Teams
Anyone with basic Excel skills can use and update the dashboard. You don’t depend on advanced tools or expensive BI software.
Best Practices for the Venture Capital KPI Dashboard in Excel
Follow these best practices to make the dashboard more effective:
- Keep KPI Definitions Clear
Always add clear definitions, formulas, and units in the KPI Definition Sheet. This avoids confusion across teams.
- Update Data on Time
Enter accurate actuals, targets, and previous year numbers every month. Consistency improves accuracy.
- Use Color Coding Wisely
Use green for positive performance and red for negative. This helps users understand insights quickly.
- Protect the Dashboard
Lock formulas and structure. Allow users to update only actual or target sheets.
- Review Trends Every Month
Use the Trend sheet to review KPI patterns. Early insights prevent bigger problems later.
- Avoid Overloading with Too Many KPIs
Track only essential KPIs. More KPIs create confusion and reduce dashboard clarity.
- Train Stakeholders
Teach your team how each sheet works. This improves adoption and reduces reporting delays.
- Refresh KPI List Every Year
Update KPIs based on new investment strategies, market situations, and startup maturity stages.
- Maintain a Clean File Structure
Keep consistent naming, clean formatting, and organized sheets.
Conclusion
The Venture Capital KPI Dashboard in Excel transforms the way investors monitor performance. Since the dashboard combines actual data, targets, yearly comparisons, and trend charts, you gain complete control over your investment insights. Every sheet in the dashboard supports smarter decision-making, faster reporting, and deeper analysis.
Because Excel is flexible, you customize the dashboard as your portfolio grows. When you use the right KPIs, update them regularly, and follow best practices, you can improve fund performance and help founders achieve better results.
This dashboard is not only a reporting tool—it is a complete performance management system for venture capital teams.
Frequently Asked Questions (FAQs)
- What is the purpose of a Venture Capital KPI Dashboard in Excel?
It helps investors track, measure, and compare key performance indicators for multiple startups using a single, easy-to-use system.
- Can I customize KPIs in this dashboard?
Yes, you can add, change, or remove KPIs anytime based on your investment goals.
- Does the dashboard update automatically?
Yes. Once you enter data in the Actual, Target, or Previous Year sheets, the main Dashboard updates instantly.
- Can beginners use this dashboard?
Yes. The system uses simple formulas, drop-downs, and charts that beginners can understand quickly.
- Does Excel work better than BI tools for VC dashboards?
Excel is fast, budget-friendly, and customizable. It works well for small to medium VC teams. BI tools are useful when you handle very large datasets.
- How often should I update KPI values?
Update values monthly for the best results. However, you can also refresh weekly if you track high-growth startups.
- What skills do I need to maintain this dashboard?
Basic Excel skills like formulas, drop-downs, charts, and conditional formatting are enough.
Visit our YouTube channel to learn step-by-step video tutorials
Watch the step-by-step video tutorial:
Click to buy Venture Capital KPI Dashboard in Excel