Managing a wood and furniture manufacturing business is not easy. You deal with raw material costs, machine efficiency, production delays, quality issues, inventory losses, and delivery timelines every single day. Because of this, relying on basic reports or scattered Excel sheets never gives you the full picture.
That is exactly why a Wood & Furniture Manufacturing KPI Dashboard in Excel becomes a powerful management tool.
In this detailed article, you will clearly understand what a Wood & Furniture Manufacturing KPI Dashboard in Excel is, why it matters, how it works, and how each worksheet supports better operational and strategic decisions. Moreover, you will learn its advantages, best practices, and common questions—explained in simple and practical language.
Click to buy Wood & Furniture Manufacturing KPI Dashboard in Excel
What Is a Wood & Furniture Manufacturing KPI Dashboard in Excel?
A Wood & Furniture Manufacturing KPI Dashboard in Excel is a structured, interactive reporting tool built to track and analyze key performance indicators related to furniture and wood-based manufacturing operations.
Instead of working with multiple files or manual calculations, this dashboard brings all production, quality, cost, and efficiency KPIs into one centralized Excel file. As a result, plant managers, operations heads, and business owners can monitor performance instantly.
Most importantly, Excel makes this dashboard flexible, affordable, and easy to customize—without investing in costly BI tools.
Why Do Wood & Furniture Manufacturers Need a KPI Dashboard?
Wood and furniture manufacturing involves multiple production stages such as cutting, shaping, finishing, polishing, and packaging. Each stage generates important performance data. However, when teams track these numbers separately, decisions often rely on assumptions.
A KPI Dashboard in Excel helps because it:
- Shows real-time performance using actual data
- Highlights gaps between targets and actuals
- Supports data-driven decisions instead of guesswork
- Improves productivity, quality, and cost control
- Saves time and reporting effort
Because of these benefits, many manufacturers now prefer dashboards over static monthly reports.
Which KPIs Does a Wood & Furniture Manufacturing Dashboard Track?
A well-designed dashboard typically covers KPIs from different functional areas.
Common KPI Groups Included
- Production KPIs
- Production volume
- Capacity utilization
- Machine efficiency
- Quality KPIs
- Defect rate
- Rework percentage
- First-pass yield
- Cost KPIs
- Material cost variance
- Production cost per unit
- Delivery KPIs
- On-time delivery rate
- Safety & Waste KPIs
- Wood waste percentage
- Scrap rate
- By grouping KPIs clearly, the dashboard becomes easier to understand and analyze.
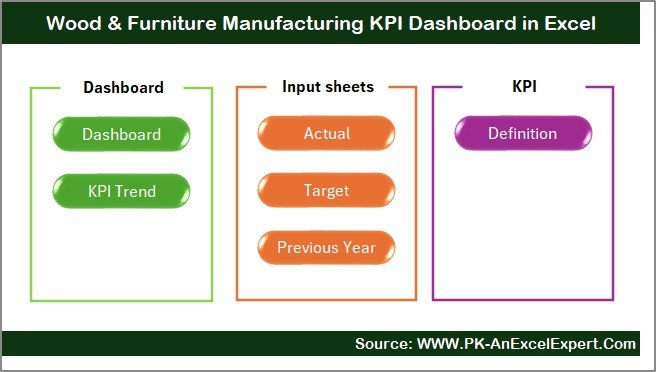
How Does the Wood & Furniture Manufacturing KPI Dashboard Work in Excel?
This KPI Dashboard follows a structured worksheet-based design that separates data entry, calculations, and visualization. As a result, users can update data safely without breaking formulas.
Let us now understand each worksheet in detail.
What Is the Summary Page in the KPI Dashboard?
Summary Page – Your Navigation Hub
The Summary Page works as an index sheet.
Here, you will find six navigation buttons, each linking to a specific worksheet inside the dashboard. Because of this design, users can jump instantly between sheets without searching.
Why Is the Summary Page Important?
- Improves user experience
- Saves navigation time
- Makes the dashboard professional and intuitive
This page acts like a home screen for the entire dashboard.
What Can You See on the Main Dashboard Sheet?
Click to buy Wood & Furniture Manufacturing KPI Dashboard in Excel
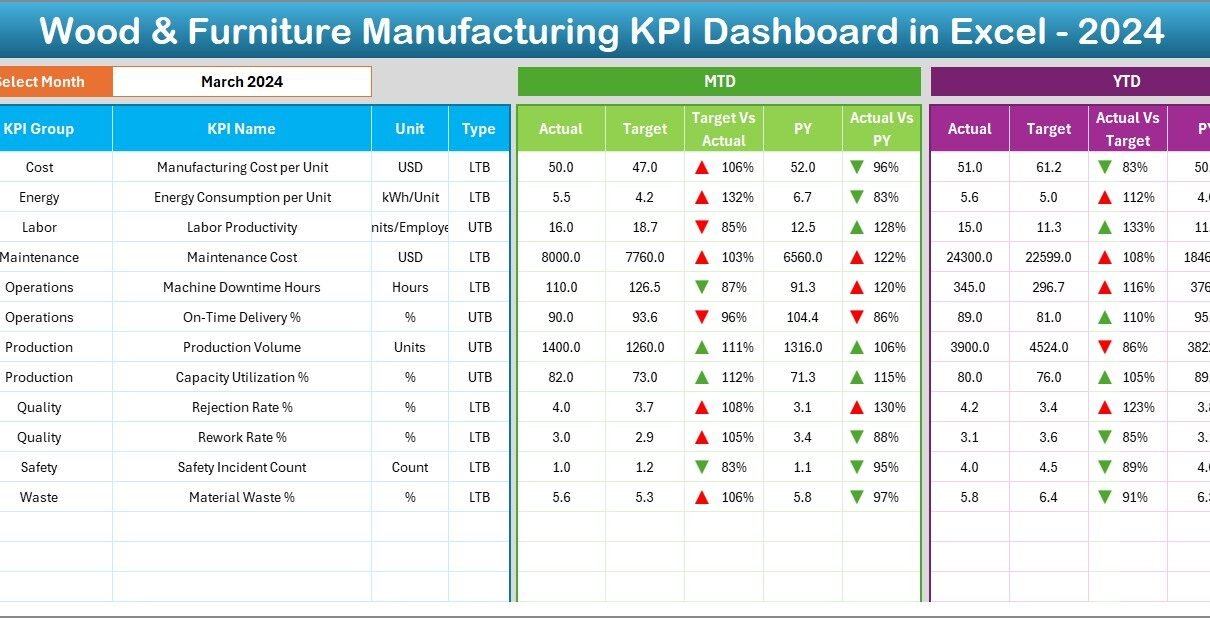
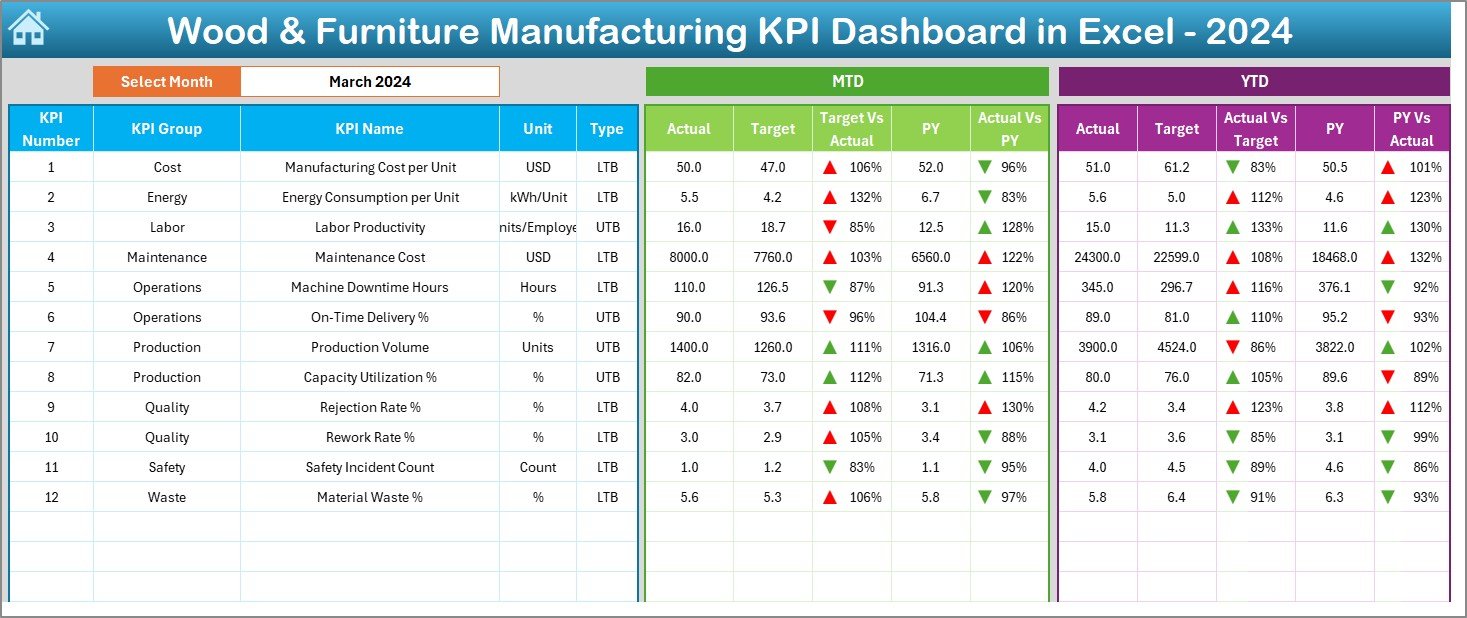
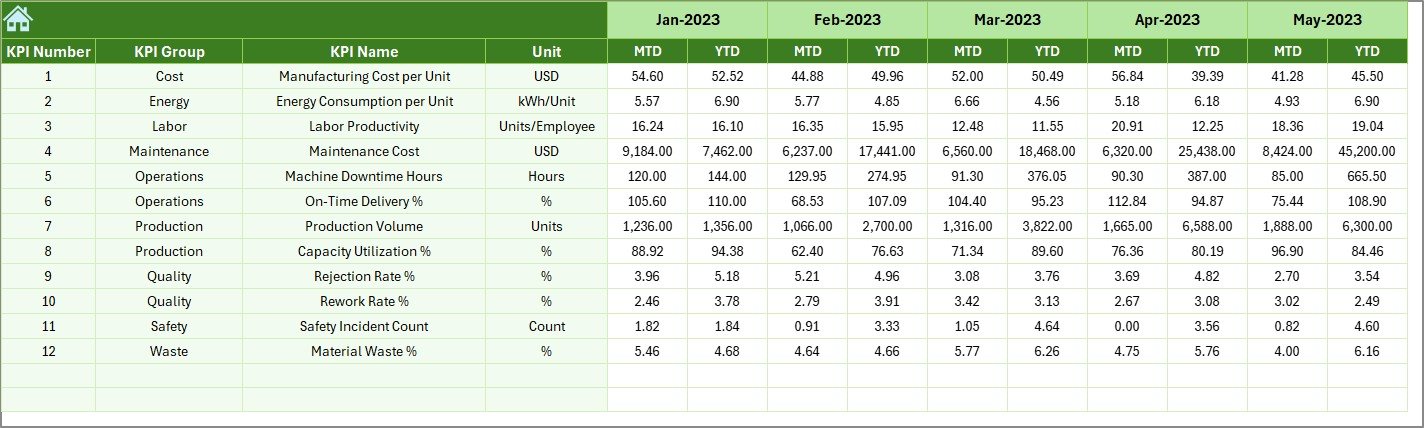
Dashboard Sheet – The Control Center
The Dashboard sheet tab is the most important part of the KPI Dashboard in Excel.
Here, the dashboard displays all KPI performance in one place.
Key Features of the Dashboard Sheet
- Month Selection (Cell D3)
You can select any month from a drop-down list. Once you change the month, the entire dashboard updates automatically. - MTD (Month-to-Date) Performance
- Actual
- Target
- Previous Year (PY)
- YTD (Year-to-Date) Performance
- Actual
- Target
- Previous Year (PY)
- Variance Analysis
- Target vs Actual
- Previous Year vs Actual
- Conditional Formatting
- Up arrows for positive performance
- Down arrows for negative performance
- Why This Sheet Matters
Because it presents MTD and YTD performance side by side, managers spot trends and issues quickly. Moreover, visual arrows guide attention without reading long tables.
Click to buy Wood & Furniture Manufacturing KPI Dashboard in Excel
How Does the Trend Sheet Help in KPI Analysis?
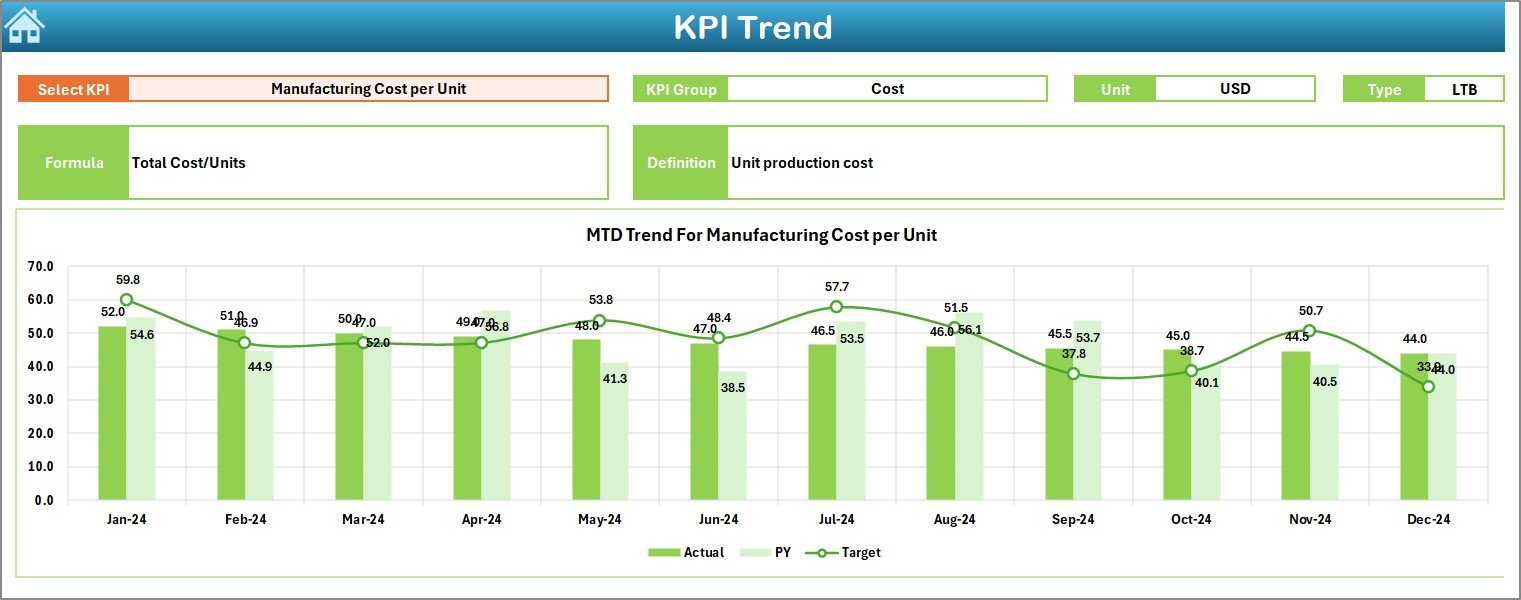
Trend Sheet – Understanding KPI Behavior Over Time
The Trend sheet tab focuses on individual KPI performance trends.
Here, you select a KPI name from a drop-down list (Cell C3). Once selected, the dashboard automatically displays complete details about that KPI.
Information Displayed on the Trend Sheet
- KPI Group
- Unit of Measurement
- KPI Type (Upper the Better / Lower the Better)
- Formula of the KPI
- Definition of the KPI
Trend Charts Included
- MTD Trend Chart
- Actual vs Target vs Previous Year
- YTD Trend Chart
- Actual vs Target vs Previous Year
- Why the Trend Sheet Is Critical
While the main dashboard shows summary numbers, the trend sheet answers deeper questions such as:
- Is performance improving month by month?
- Did targets change over time?
- How does current performance compare with last year?
Because of this, teams can identify root causes early.
Click to buy Wood & Furniture Manufacturing KPI Dashboard in Excel
Where Do You Enter Actual Numbers in the Dashboard?
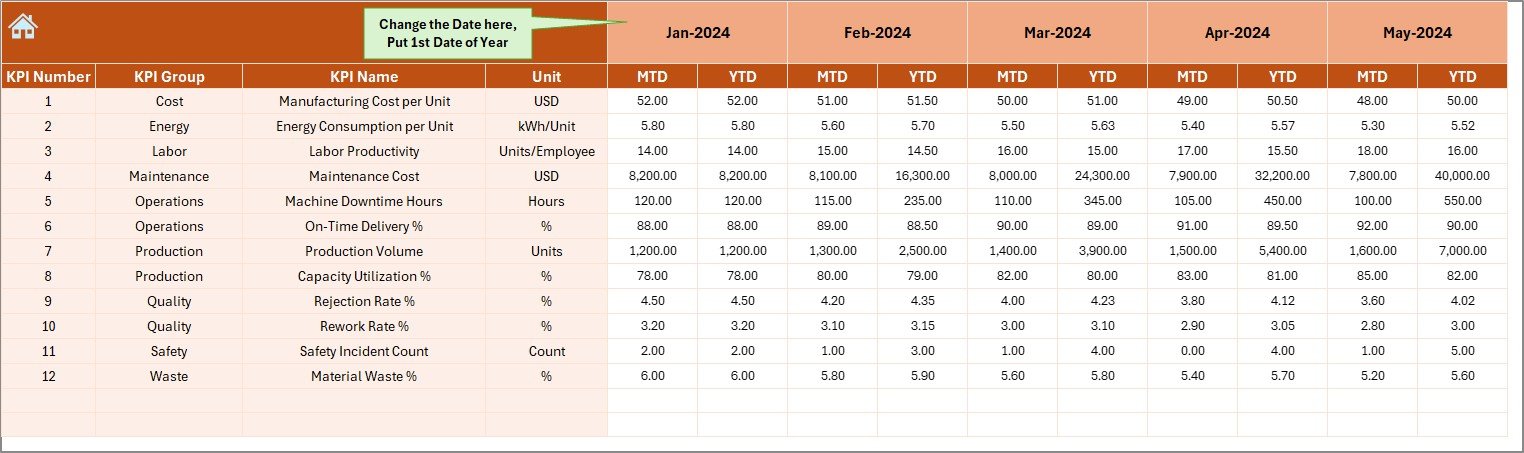
Actual Numbers Input Sheet – Data Entry Made Simple
The Actual Numbers Input sheet is where users enter actual KPI values.
How Data Entry Works
- Select the starting month of the year in cell E1
- Enter MTD and YTD values for each KPI
- Change the month easily without rewriting formulas
Key Benefits of This Design
- Reduces data entry errors
- Keeps formulas protected
- Supports quick monthly updates
Because users only input data in dedicated cells, the dashboard remains stable and reliable.
Click to buy Wood & Furniture Manufacturing KPI Dashboard in Excel
How Are Target Values Managed in the KPI Dashboard?
Target Sheet – Goal Setting Made Visible
The Target sheet tab stores target numbers for each KPI.
Here, users enter:
- Monthly target values (MTD)
- Yearly cumulative targets (YTD)
Once updated, these targets automatically reflect across the dashboard and trend charts.
Why Target Tracking Matters
- Keeps teams aligned with business goals
- Encourages accountability
- Supports performance-based reviews
By comparing targets against actuals, managers can take corrective action on time.
Click to buy Wood & Furniture Manufacturing KPI Dashboard in Excel
Previous Year Data
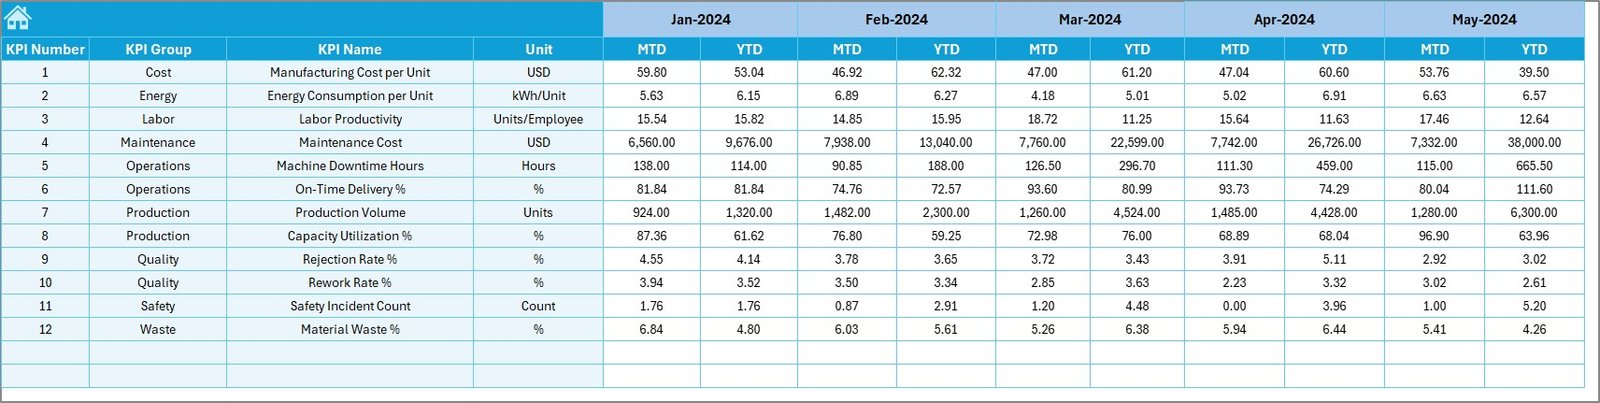
Previous Year Number Sheet – Historical Comparison
The Previous Year Number sheet tab stores past-year data for the same KPIs.
Here, you enter MTD and YTD values for the previous year.
Benefits of Previous Year Comparison
- Shows seasonal patterns
- Highlights year-over-year improvement or decline
- Helps with realistic forecasting
Because this data integrates directly with charts and variance calculations, decision-makers gain powerful insights instantly.
Click to buy Wood & Furniture Manufacturing KPI Dashboard in Excel
What Role Does the KPI Definition Sheet Play?
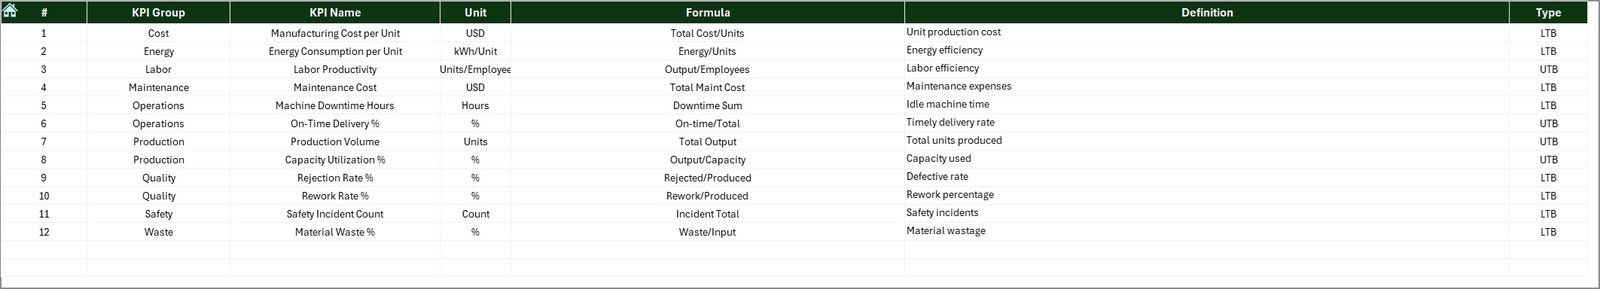
KPI Definition Sheet – The Foundation of the Dashboard
The KPI Definition sheet tab contains metadata for each KPI.
Here, you define:
- KPI Name
- KPI Group
- Unit
- Formula
- KPI Definition
Why This Sheet Is Essential
- Brings clarity to users
- Avoids KPI misinterpretation
- Makes the dashboard reusable as a template
Since all KPI details sit in one place, you can easily modify or add new KPIs without redesigning the dashboard.
Click to buy Wood & Furniture Manufacturing KPI Dashboard in Excel
Advantages of Wood & Furniture Manufacturing KPI Dashboard in Excel
Using a Wood & Furniture Manufacturing KPI Dashboard in Excel offers several practical advantages.
Key Advantages
- Centralized Reporting
All KPIs appear in one dashboard instead of multiple files. - Time-Saving
Automated calculations reduce manual effort. - Better Decision-Making
Visual insights replace assumptions. - Cost-Effective Solution
No need for expensive BI software. - Customizable Template
Easily adapt KPIs for different plants or products. - Improved Performance Tracking
MTD and YTD views guide continuous improvement.
Because of these advantages, Excel dashboards remain a preferred choice for manufacturing teams.
How Does This KPI Dashboard Improve Operational Efficiency?
This dashboard improves efficiency because it:
- Identifies production bottlenecks early
- Highlights quality losses quickly
- Tracks cost overruns in real time
- Encourages cross-department accountability
As a result, management responds faster and more accurately.
Best Practices for the Wood & Furniture Manufacturing KPI Dashboard
To get maximum value from your KPI Dashboard, you should follow proven best practices.
Best Practices You Should Always Follow
- Keep KPIs Relevant
Track only KPIs that influence decisions. - Review Data Monthly
Update actual, target, and previous year data on time. - Use Clear Definitions
Ensure every KPI definition stays simple and precise. - Avoid Overloading the Dashboard
Too many KPIs reduce clarity. - Train Users Properly
Help teams understand KPI logic and interpretation. - Lock Formula Cells
Protect calculations to prevent accidental changes.
Following these practices ensures accuracy, reliability, and long-term usability.
Can This KPI Dashboard Be Used as a Template?
Yes, absolutely.
Because the dashboard separates data, definitions, and visuals, you can reuse it as a template for:
- Different factories
- Multiple product lines
- Future financial years
All you need to do is update the KPI list and data inputs.
Conclusion: Why You Should Use a Wood & Furniture Manufacturing KPI Dashboard in Excel
A Wood & Furniture Manufacturing KPI Dashboard in Excel transforms raw production data into meaningful insights. It replaces manual reports, reduces errors, and supports faster decisions.
Because it tracks MTD, YTD, Target, and Previous Year performance in one place, management gains complete visibility across operations. Moreover, its structured design and visual clarity make it useful for both daily reviews and strategic planning.
In today’s competitive manufacturing environment, relying on intuition alone is risky. A KPI Dashboard in Excel ensures decisions always rely on data.
Frequently Asked Questions (FAQs)
What is a KPI Dashboard in Excel for wood manufacturing?
A KPI Dashboard in Excel is a reporting tool that tracks and analyzes production, quality, cost, and efficiency KPIs in one place.
Can small furniture manufacturers use this dashboard?
Yes. Excel dashboards suit both small workshops and large manufacturing plants because of their flexibility.
Does this dashboard require advanced Excel skills?
No. Basic Excel knowledge is enough to update data and review reports.
How often should KPIs be updated?
You should update KPIs monthly to maintain accuracy and relevance.
Can I add new KPIs to the dashboard?
Yes. You can add or remove KPIs easily through the KPI Definition sheet.
Is Excel reliable for manufacturing dashboards?
Yes. Excel remains a trusted, cost-effective, and widely used tool when designed correctly.
Visit our YouTube channel to learn step-by-step video tutorials
Watch the step-by-step video tutorial:
Click to buy Wood & Furniture Manufacturing KPI Dashboard in Excel