Professional training and coaching programs grow only when they follow a strong measurement system. Every training department wants to know if the sessions deliver results, if learners improve their skills over time, and if the training investment creates real business impact. However, manual tracking often takes time, looks confusing, and fails to highlight performance gaps.
A Professional Training & Coaching KPI Dashboard in Power BI solves these challenges. It brings all your key metrics—training hours, attendance, coaching sessions, learner performance, feedback scores, target achievement, and more—into one powerful visual dashboard. You can understand performance trends, compare progress, and make informed decisions within seconds.
This article explains everything about this dashboard. You will learn how it works, what each page shows, how the Excel data structure supports it, and why this template helps training teams perform better. You will also see the advantages, best practices, and frequently asked questions to make your dashboard usage easier.
Click to buy Professional Training & Coaching KPI Dashboard in Power BI
What Is a Professional Training & Coaching KPI Dashboard in Power BI?
A Professional Training & Coaching KPI Dashboard in Power BI is a ready-to-use reporting tool designed for training departments, coaching institutes, corporate learning teams, L&D managers, and freelance coaches. It converts raw Excel data into dynamic visuals that update automatically. This means you get real-time insights without doing any calculations manually.
You can track:
- Monthly training performance
- Coaching session results
- Instructor and trainer efficiency
- Training program quality
- Target vs. actual performance
- Yearly improvement
- Previous year comparison
- KPI-level achievements
- Group-wise and category-wise metrics
Since the dashboard runs in Power BI, you can drill down into every KPI, apply filters, compare data, and understand performance from every angle.
Why Do Professional Training Teams Need This Dashboard?
Professional training and coaching departments handle large amounts of performance data. When the data stays scattered in multiple files, it becomes difficult to track improvement. With a Power BI dashboard, you bring everything together.
You need this dashboard because it helps you:
- Monitor training results every month
- Measure coaching effectiveness
- Check if learners achieve the required standards
- Identify performance gaps early
- Improve training planning
- Understand which programs need attention
- Show results to stakeholders with confidence
This dashboard becomes your single source of truth for everything related to training KPIs.
Key Features of the Professional Training & Coaching KPI Dashboard in Power BI
This ready-to-use dashboard comes with three powerful pages, each designed to make data analysis smooth and fast.
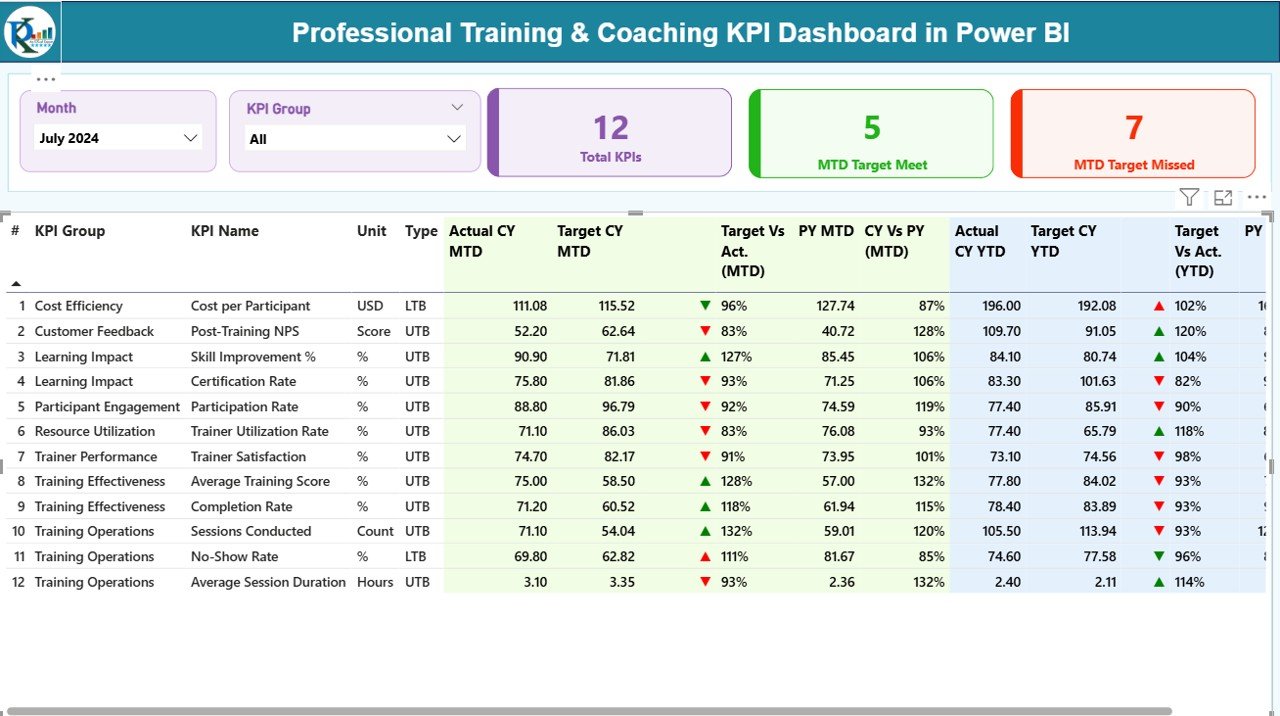
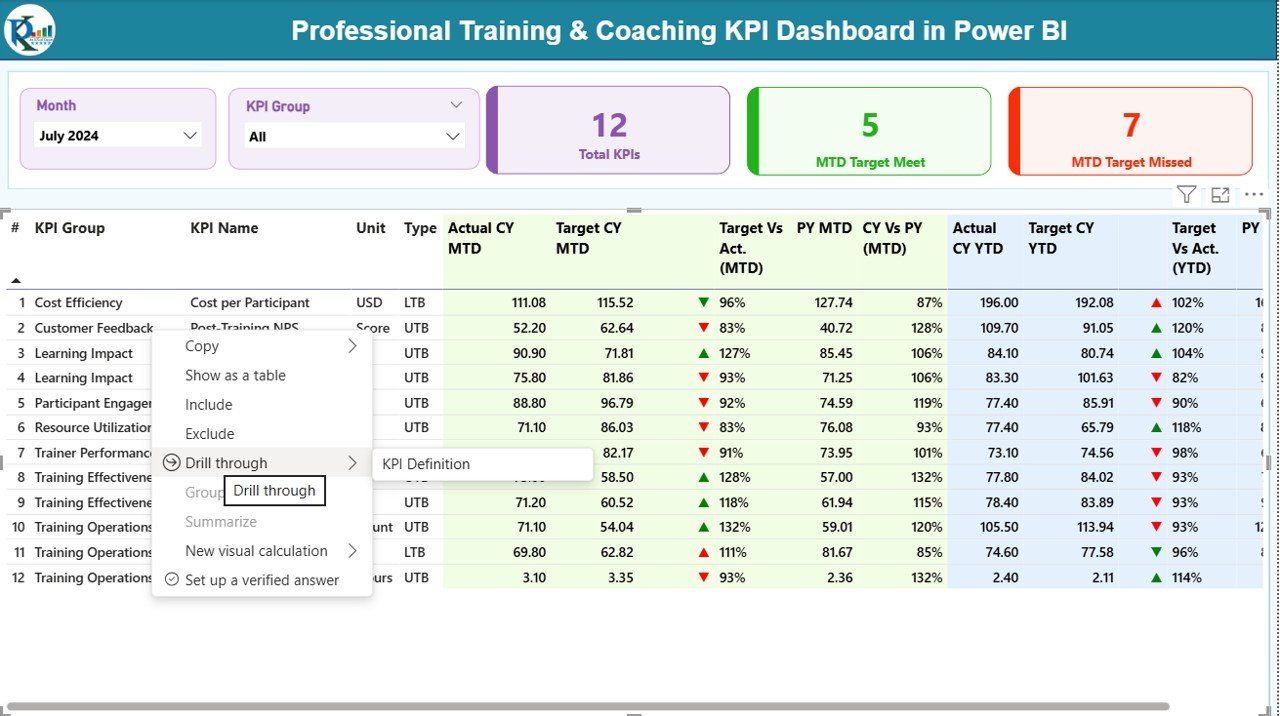
Summary Page – Your Main Control Center
The Summary Page is the heart of the dashboard. You get a complete overview of all training and coaching KPIs in one place.
What does the Summary Page include?
Month Slicer
You can select any month and see all metrics update instantly. This helps training managers measure progress month by month.
KPI Group Slicer
Group-wise filtering helps you focus on a specific training category, such as:
- Technical Training
- Soft Skills Coaching
- Leadership Development
- Certification Programs
- Behavioral Training
- Productivity Workshops
Three KPI Cards
These cards appear at the top and show:
- Total KPIs Count – Number of KPIs tracked
- MTD Target Met Count – How many KPIs achieved the monthly target
- MTD Target Missed Count – How many KPIs failed to meet the target
These cards help you understand the overall performance instantly.
Detailed KPI Table
Below the cards, you get a professional KPI table showing:
- KPI Number (sequence number)
- KPI Group (category)
- KPI Name
- Unit of Measurement
- Type of KPI – LTB (Lower the Better) or UTB (Upper the Better)
- Actual CY MTD – Current Year Month-to-Date actual number
- Target CY MTD – Current Year Month-to-Date target number
- MTD Icon – ▲ (green) or ▼ (red) based on performance
- Target vs Actual % (MTD)
- PY MTD – Previous Year MTD
- CY vs PY (MTD) – Growth percentage
- Actual CY YTD – Year-to-Date actual
- Target CY YTD – Year-to-Date target
- YTD Icon – ▲ (green) or ▼ (red)
- Target vs Actual % (YTD)
- PY YTD – Previous Year YTD
- CY vs PY (YTD) – Yearly progress percentage
The visuals use clear arrows and colors to make performance evaluation easy.
Click to buy Professional Training & Coaching KPI Dashboard in Power BI
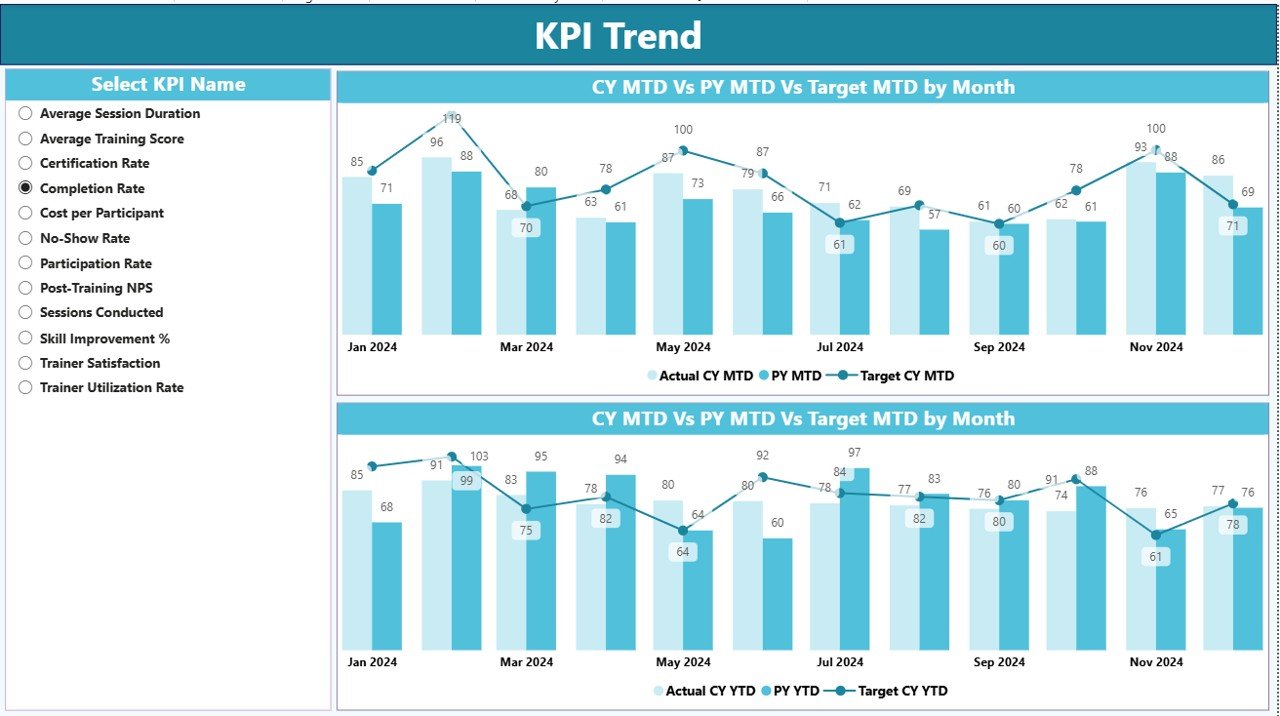
KPI Trend Page – Visualize Performance Over Time
Trainers and L&D managers often want to see how performance changes every month. The KPI Trend Page helps you see those patterns clearly.
What do you see on this page?
Two Combo Charts
These charts compare:
- Current Year Actual
- Previous Year Actual
- Target Values
- MTD Trends
- YTD Trends
You can quickly spot improvement, decline, and seasonal patterns.
KPI Slicer
Select any KPI and watch the trend charts update instantly. This makes deep analysis extremely simple.
Click to buy Professional Training & Coaching KPI Dashboard in Power BI
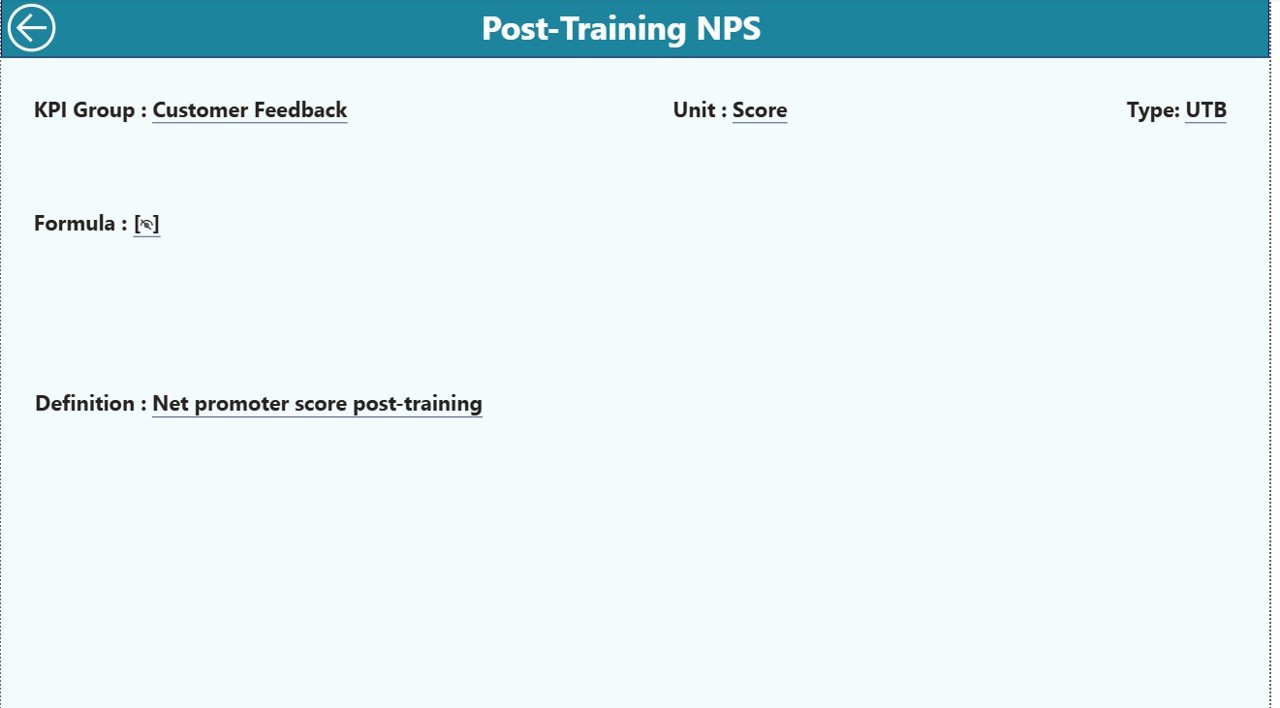
KPI Definition Page – Get Clear Meaning of Every KPI
This is a drill-through page, kept hidden from the main navigation to maintain a clean dashboard structure.
From the Summary Page, you can click any KPI and drill through to see:
- KPI Number
- KPI Group
- KPI Name
- Unit
- Formula
- KPI Definition
- KPI Type
This helps the training team understand every KPI clearly and ensures that everyone follows the same definitions.
You can return to the main page by clicking the Back button on the top-left corner.
Click to buy Professional Training & Coaching KPI Dashboard in Power BI
Excel Data Structure for the Dashboard
The dashboard runs on three structured Excel sheets. You only need to fill these sheets to update the dashboard automatically.
Input_Actual Sheet Tab
Here, you enter:
- KPI Name
- Month (use the first date of every month)
- MTD Actual
- YTD Actual
This sheet stores the actual performance numbers for every KPI.
Input_Target Sheet Tab
Here, you enter:
- KPI Name
- Month (first date of the month)
- MTD Target
- YTD Target
This sheet stores the planned performance numbers.
Click to buy Professional Training & Coaching KPI Dashboard in Power BI
KPI Definition Sheet Tab
This sheet provides clarity for every KPI.
Enter:
- KPI Number
- KPI Group
- KPI Name
- Unit
- Formula
- Definition
- Type (LTB or UTB)
This makes the dashboard transparent and easy to understand.
Advantages of a Professional Training & Coaching KPI Dashboard in Power BI
A strong KPI dashboard gives training teams a clear direction. Below are the most important benefits:
- Gain Real-Time Visibility
You see performance trends instantly. You understand which programs perform well and which require improvement.
- Improve Planning and Decision Making
Training managers make better decisions since data stays organized and clear. You can compare targets, track learner growth, and understand where resources must be focused.
- Identify Gaps Early
The dashboard highlights KPIs that fail to meet monthly or yearly targets. This helps you correct the issue before it becomes bigger.
- Increase Accountability in Training Teams
Everyone knows what to track and how performance is measured. Trainers, instructors, and coaches stay aligned with business goals.
- Save Time and Reduce Errors
No manual data merging, no complex Excel formulas, and no wasted effort. You enter data once, and Power BI updates everything.
- Create Professional Reports for Leadership
You can present visually rich reports to management. It becomes easy to explain progress, challenges, and improvement strategies.
- Compare With Previous Year Performance
The MTD and YTD comparisons help you see how performance improves over time.
Best Practices for Using the Professional Training & Coaching KPI Dashboard
Follow these best practices to get maximum value from your dashboard:
- Update Data Regularly
Fill the Actual and Target sheets every month. Regular updates ensure accurate insights.
- Use Clear and Simple KPI Names
Simple names make the dashboard easy to understand for everyone.
- Maintain Consistent Units
Use the same unit across Actual, Target, and Previous Year numbers.
- Keep KPI Definitions Updated
Regularly review the definition sheet to ensure clarity.
- Use Color Indicators Wisely
Green and red arrows guide users. Do not change color codes since consistency matters.
- Review Monthly Trends Before Taking Action
Look at both MTD and YTD trends before finalizing decisions.
- Share Dashboard with Stakeholders
Share Power BI reports with trainers, project managers, HR, and leadership teams to increase transparency.
Conclusion
A Professional Training & Coaching KPI Dashboard in Power BI gives training teams a complete view of their performance. It reduces manual work, highlights progress, and supports faster decision-making. When you track KPIs in a structured and visual way, you deliver better training outcomes, improve coaching quality, and strengthen learner success.
This dashboard helps every training organization move from guesswork to data-driven planning. With clear visuals, trend charts, KPI definitions, and automated tracking, you stay ahead and grow your training impact every month.
Frequently Asked Questions (FAQs)
- Who should use the Professional Training & Coaching KPI Dashboard?
- Training managers, L&D teams, coaching institutes, HR departments, and freelance coaches use this dashboard to track performance KPIs.
- Do I need advanced Power BI skills to use this dashboard?
- No. You only need to enter data in Excel. The dashboard updates automatically.
- Can I add more KPIs to the dashboard?
- Yes. You can add new KPIs in the Excel sheets, and Power BI will include them after refresh.
- Does the dashboard show both MTD and YTD numbers?
- Yes. You get clear views of Monthly Target Achievement, Yearly Progress, and Previous Year comparisons.
- Can I customize the KPI Groups?
Yes. You can change, rename, or add KPI groups in the KPI Definition sheet.
- Does this dashboard work for online coaching also?
Yes. Whether you run classroom training, online coaching, or blended learning, this dashboard supports all formats.
- How do I return to the main page after drill-through?
Click the Back button on the KPI Definition page to return to the Summary Page.
Visit our YouTube channel to learn step-by-step video tutorials
Click to buy Professional Training & Coaching KPI Dashboard in Power BI
Watch the step-by-step video tutorial: