Managing a call center demands constant monitoring, fast decisions, and instant access to accurate performance data. Call volumes change every hour, customers expect quick resolutions, and managers need a real-time view of how teams perform. Because of this, call center leaders look for a system that brings clarity, speed, and accuracy in one place. A Call Center Operations KPI Dashboard in Power BI solves this need.
This dashboard helps you track month-to-date (MTD), year-to-date (YTD), and previous-year performance across all critical KPIs. You can see trends, targets, and actual results in a clean and interactive visual format. Since the dashboard connects to an Excel dataset, users do not need advanced technical skills. Everyone can analyze performance with simple clicks.
In this detailed article, we will explore everything about the Call Center Operations KPI Dashboard in Power BI. We will discuss how it works, why businesses need it, key components, advantages, best practices, and answers to the most common questions.
Click to buy Call Center Operations KPI Dashboard in Power BI
Managing a call center demands constant monitoring, fast decisions, and instant access to accurate performance data. Call volumes change every hour, customers expect quick resolutions, and managers need a real-time view of how teams perform. Because of this, call center leaders look for a system that brings clarity, speed, and accuracy in one place. A Call Center Operations KPI Dashboard in Power BI solves this need.
This dashboard helps you track month-to-date (MTD), year-to-date (YTD), and previous-year performance across all critical KPIs. You can see trends, targets, and actual results in a clean and interactive visual format. Since the dashboard connects to an Excel dataset, users do not need advanced technical skills. Everyone can analyze performance with simple clicks.
In this detailed article, we will explore everything about the Call Center Operations KPI Dashboard in Power BI. We will discuss how it works, why businesses need it, key components, advantages, best practices, and answers to the most common questions.
What Is a Call Center Operations KPI Dashboard in Power BI?
A Call Center Operations KPI Dashboard in Power BI is a ready-to-use performance management tool that tracks call center KPIs at monthly and yearly levels. It pulls data from an Excel file and turns it into interactive visuals, slicers, and performance indicators.
This dashboard helps call center managers monitor:
- Call volume metrics
- Productivity metrics
- Customer experience metrics
- Agent performance
- Service-level adherence
- Target achievement
- Year-over-year improvement
Since everything updates based on the selected month and KPI group, managers get a real-time view of performance without manual calculations.
Why Do Call Centers Need a KPI Dashboard?
Call centers operate in a high-pressure environment. Teams handle hundreds or thousands of calls daily, and every second matters. Without a clear dashboard, managers depend on scattered spreadsheets, which leads to:
- Delayed decisions
- Miscommunication
- Missed targets
- Unclear performance visibility
- Unbalanced workloads
A KPI dashboard in Power BI removes all these challenges. It organizes data and presents it in a simple structure so every stakeholder stays aligned.
Key Features of the Call Center Operations KPI Dashboard in Power BI
This dashboard includes three well-designed pages, each focusing on a different type of analysis.
Summary Page – The Main Control Panel
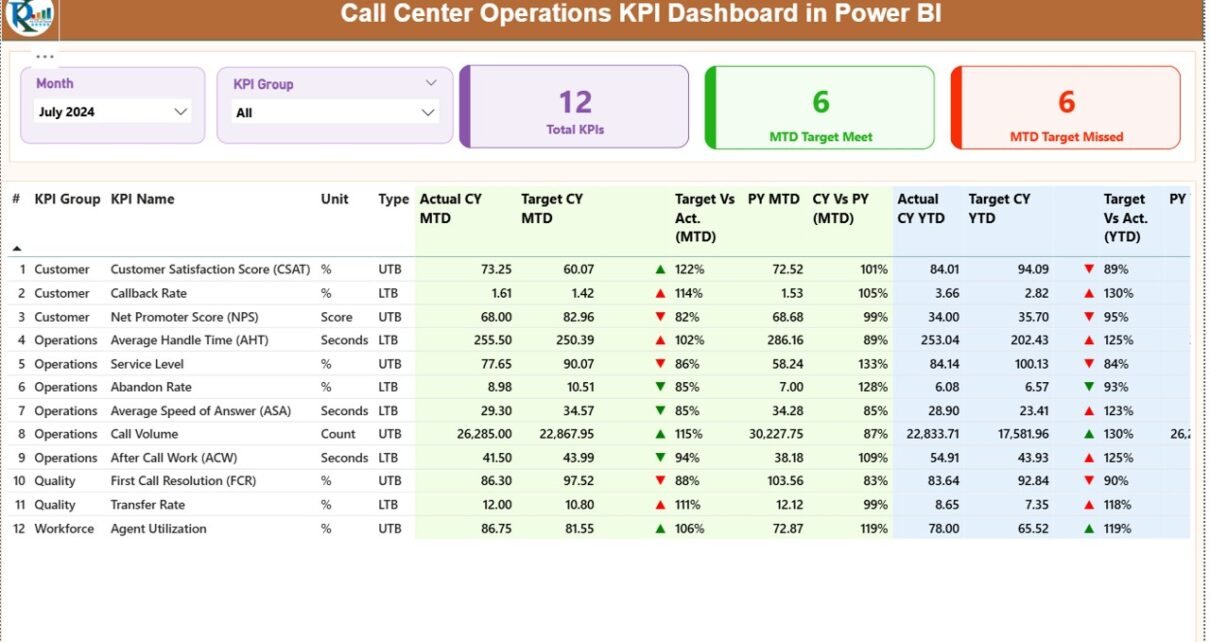
The Summary Page is the heart of the dashboard. It displays the overall performance through slicers, cards, tables, and indicators.
Key Elements of the Summary Page
Month Slicer
Users can select the month they want to analyze. The entire dashboard updates instantly.
KPI Group Slicer
Users can filter KPIs by group or category. This brings focus and helps managers evaluate specific areas like:
- Agent performance
- Customer satisfaction
- Call handling
- Service levels
Three Summary Cards
The dashboard displays three important KPI counts:
- Total KPIs
- MTD Target Met
- MTD Target Missed
These cards give a quick snapshot of overall progress.
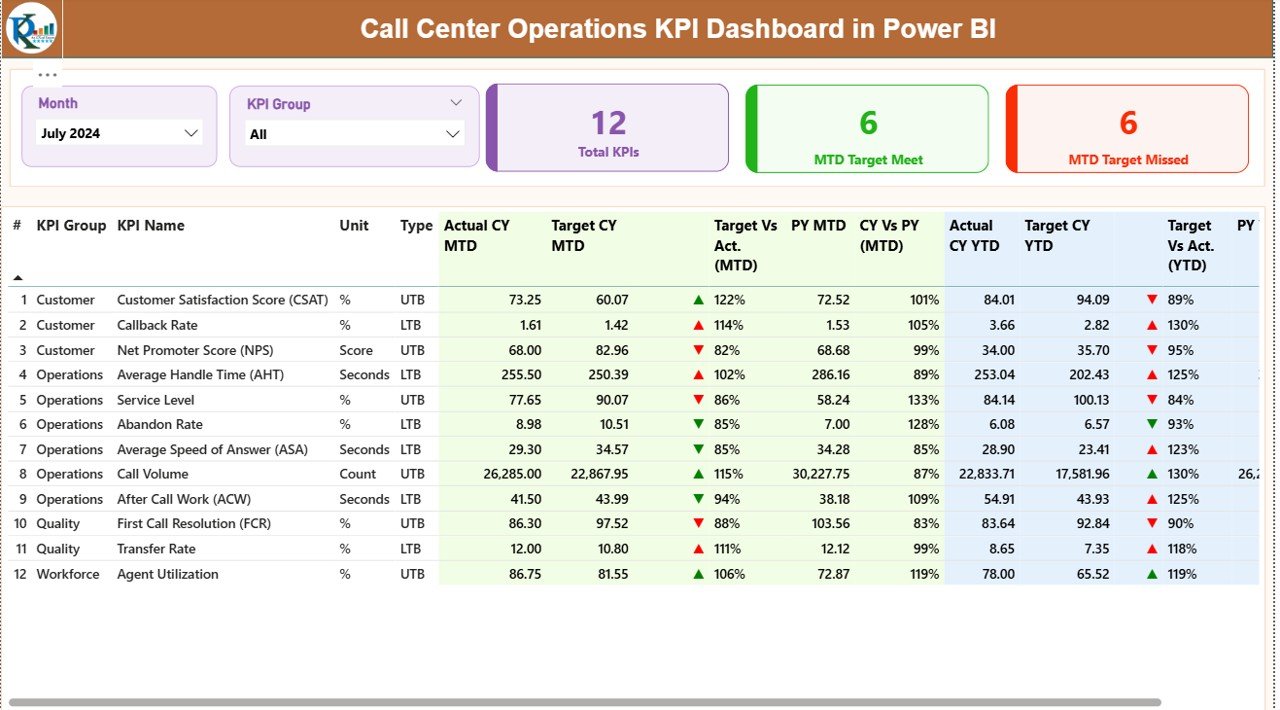
Detailed KPI Table
The table at the bottom shows the complete performance structure for each KPI. It includes:
- KPI Number
- KPI Group
- KPI Name
- Unit of Measurement
- KPI Type (LTB/UTB)
- Actual CY MTD
- Target CY MTD
- MTD Status Icon (▲ or ▼)
- MTD Target vs Actual (%)
- Previous Year MTD
- CY vs PY MTD (%)
- Actual CY YTD
- Target CY YTD
- YTD Status Icon (▲ or ▼)
- YTD Target vs Actual (%)
- Previous Year YTD
- CY vs PY YTD (%)
How KPIs Are Calculated
- Target vs Actual (MTD/YTD)
Formula:
Actual ÷ Target - CY vs PY (MTD/YTD)
Formula:
Current Year Value ÷ Previous Year Value
The arrows update automatically:
- ▲ Green Arrow → Target met
- ▼ Red Arrow → Target missed
This helps managers immediately understand where improvement is needed.
Click to buy Call Center Operations KPI Dashboard in Power BI
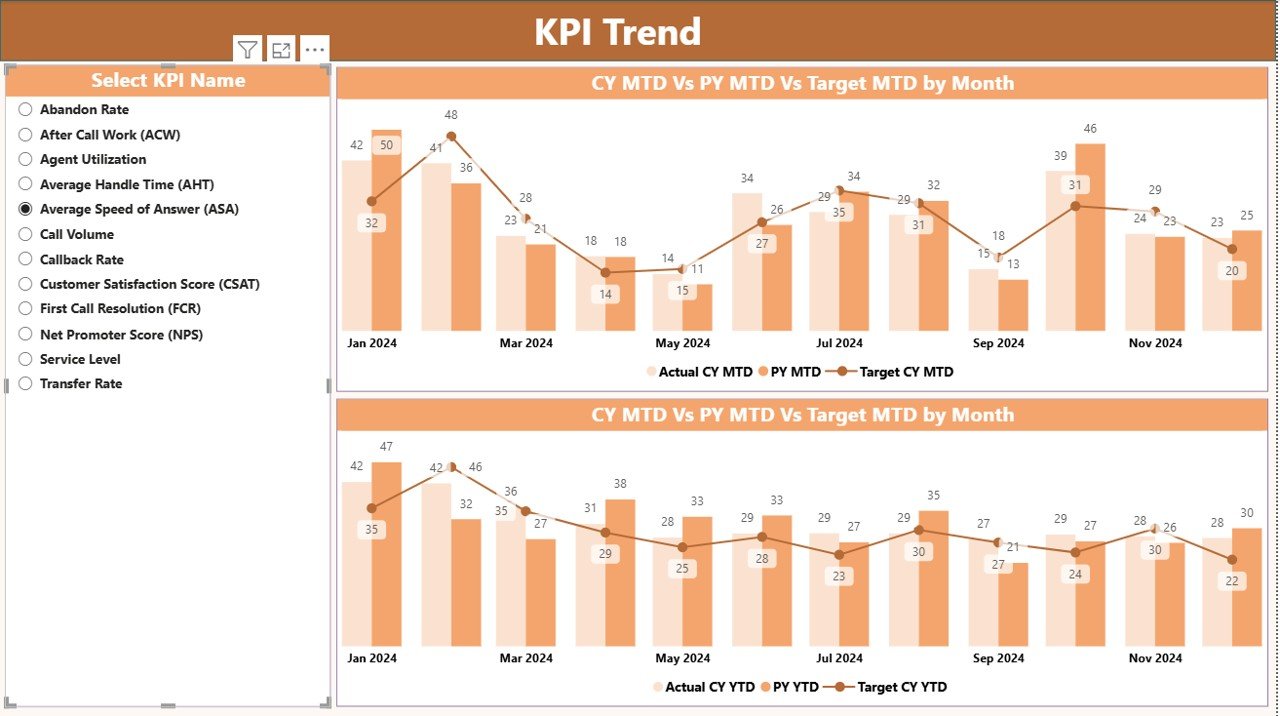
KPI Trend Page – Visual Performance Analysis
The second page shows clear visual trends using two combo charts.
Key Highlights of the KPI Trend Page
KPI Selection Slicer
Users can choose any KPI to view its trend.
Two Combo Charts
- MTD Trend Chart
Shows:
- Current Year MTD
- Previous Year MTD
- Target MTD
- YTD Trend Chart
Shows:
- Current Year YTD
- Previous Year YTD
- Target YTD
These charts help teams understand:
- Performance growth
- Decline patterns
- Seasonal fluctuations
- Long-term progress
This page is extremely useful for presentation meetings and performance reviews.
Click to buy Call Center Operations KPI Dashboard in Power BI
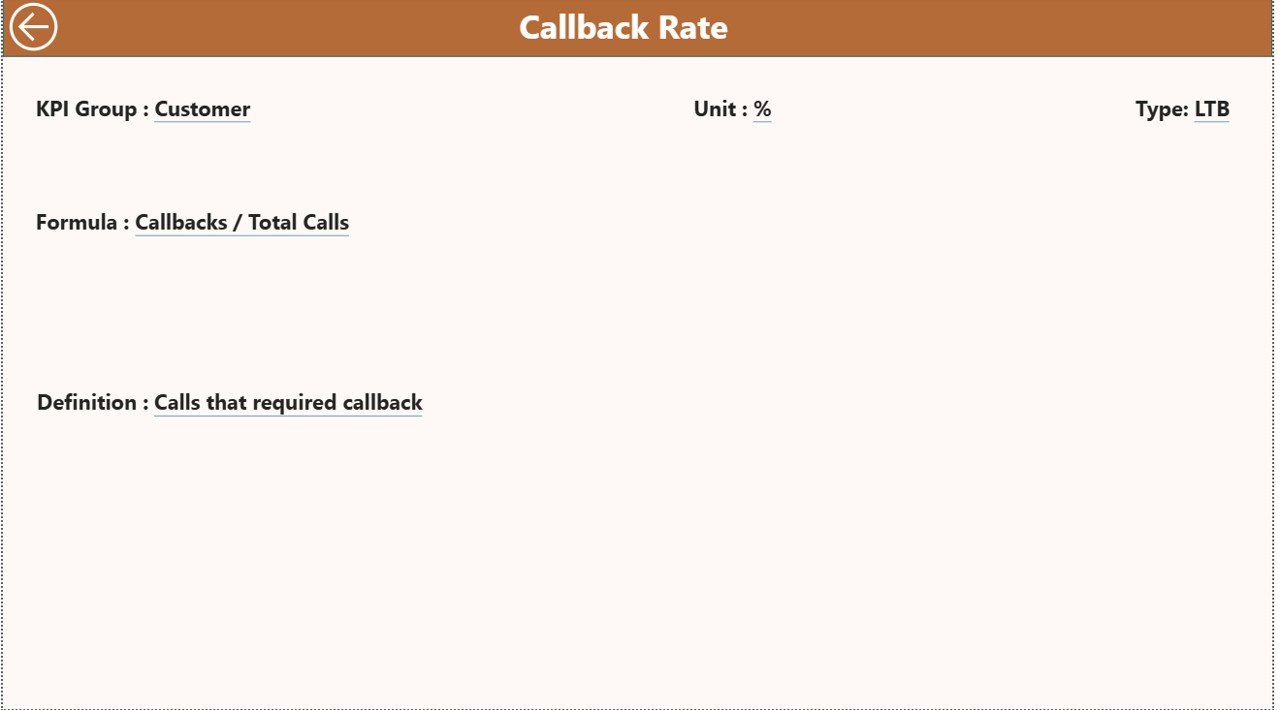
KPI Definition Page – Detailed Drill-Through Information
This page is hidden and opens only when users drill through from the Summary Page. It provides detailed information about each KPI.
KPI Definition Page Includes:
- KPI Number
- KPI Group
- KPI Name
- Unit
- KPI Formula
- KPI Definition
- KPI Type (LTB or UTB)
This helps new team members understand how each KPI is measured.
You can return to the Summary Page using the Back Button.
Click to buy Call Center Operations KPI Dashboard in Power BI
Excel Data Structure Used in the Dashboard
The dashboard connects to an Excel file that contains three worksheets.
- Input_Actual Sheet
This sheet stores:
- KPI Name
- Month (first day of month)
- MTD Actual
- YTD Actual
Users update this sheet every month.
- Input_Target Sheet
This sheet stores:
- KPI Name
- Month (first day of month)
- MTD Target
- YTD Target
Targets may come from managers or historical analysis.
- KPI Definition Sheet
This sheet stores:
- KPI Number
- KPI Group
- KPI Name
- Unit
- Formula
- KPI Definition
- Type (LTB or UTB)
This ensures every KPI has a clear purpose and measurement rule.
Which KPIs Should Call Centers Track?
Different call centers track different KPIs, but below are the most common ones:
Productivity KPIs
- Average Handle Time (AHT)
- First Call Resolution (FCR)
- Calls Answered per Agent
- Call Transfer Rate
Customer Experience KPIs
- Customer Satisfaction (CSAT)
- Net Promoter Score (NPS)
- Complaint Volume
Quality KPIs
- Quality Score
- Escalation Rate
- Error Rate
Operational KPIs
- Service Level
- Call Abandonment Rate
- Occupancy Rate
- Average Speed of Answer (ASA)
The dashboard supports any KPI as long as it is entered in the Excel sheet.
Advantages of the Call Center Operations KPI Dashboard in Power BI
Call centers gain several benefits from this dashboard. Below are the most important advantages.
- Real-Time Visibility
Managers get instant access to performance without waiting for reports. This leads to quicker decisions and faster action.
- Centralized Data
The dashboard collects all metrics into a single system. No more switching between spreadsheets or tools.
- Accurate Target Monitoring
The MTD and YTD comparison helps you:
- Track performance
- Spot issues early
- Improve results
- Better Agent Performance Tracking
Supervisors can evaluate each KPI group and identify training needs.
- date Excel sheets. Power BI does the rest.
- Better Y
Easy Reporting for Management
The clean design and combo charts make it easy to present performance during meetings.
No Coding Needed
- Users only up
- ear-over-Year Comparison
The dashboard shows how the call center performs compared to the previous year. This helps with planning, hiring, and process improvement.
Best Practices for Using the Call Center Operations KPI Dashboard
To get maximum value from this dashboard, follow these best practices.
- Update Data Monthly
Fill the Actual and Target sheets every month on time. This ensures accurate reporting.
- Use Consistent KPI Definitions
Keep KPI definitions stable. Do not change formulas often, or trends will become confusing.
- Involve Supervisors and Team Leads
Share the dashboard with the team. This creates accountability and transparency.
- Track Leading and Lagging Indicators
For example:
- Leading Indicator: Average Speed of Answer
- Lagging Indicator: Customer Satisfaction
Both are important.
- Review KPI Trends Weekly
Even though KPIs are monthly, weekly review sessions help teams stay on track.
- Use Drill-Through for Training
When new staff join, use the KPI Definition page to teach them performance rules.
- Align KPIs With Business Goals
Choose KPIs that support:
- Customer satisfaction
- Reduced handling time
- Faster resolutions
Conclusion
A Call Center Operations KPI Dashboard in Power BI gives call centers a powerful way to track and improve performance. It removes manual reporting, improves visibility, and gives managers a complete understanding of MTD, YTD, and previous-year performance. With slicers, combo charts, and KPI definitions, this dashboard creates a smooth workflow for every team.
Call centers today face high expectations. Customers want fast service. Agents need clarity. Managers need real-time insights. This dashboard brings all of these together in one place.
If you want a simple, accurate, and professional way to manage call center KPIs, this dashboard is the best solution.
Frequently Asked Questions (FAQs)
- What is a Call Center Operations KPI Dashboard?
It is a Power BI dashboard that tracks call center performance using MTD, YTD, and previous-year KPIs.
- Do I need technical skills to use this dashboard?
No. You only need to update an Excel file.
- Can I add more KPIs?
Yes. Add them in the KPI Definition sheet and update Actual and Target sheets.
- Can this dashboard track agent-level KPIs?
Yes. As long as data exists in Excel, Power BI will visualize it.
- How often should I update the data?
Monthly updates give the best results.
- Can I customize the visuals?
Yes. Power BI allows full customization.
- Does the dashboard support drill-through?
Yes. The KPI Definition page opens when you drill through from the Summary Page.
- Can I add more months of data?
Yes. Just add more rows in the Actual and Target sheets.
- What makes this dashboard useful for managers?
It provides clear insights, tracks targets, and shows trends.
- Does it work for all industries?
Yes. Any call center can use it, regardless of size or sector.
Visit our YouTube channel to learn step-by-step video tutorials
Watch the step-by-step video tutorial:
Click to buy Call Center Operations KPI Dashboard in Power BI