A Libraries & Archives KPI Dashboard in Excel is a ready-to-use performance monitoring template designed to track, analyze, and visualize key performance indicators related to library operations, archival management, user engagement, and resource utilization.
Instead of managing multiple files and manual reports, this dashboard consolidates all KPI data into one structured Excel workbook. Consequently, librarians, archivists, administrators, and leadership teams gain instant visibility into operational performance, monthly trends, and year-to-date results.
Because the dashboard uses Microsoft Excel, it remains easy to use, flexible, cost-effective, and widely accessible. Moreover, teams do not need advanced BI tools or complex systems to start tracking performance effectively.
Click to buy Libraries & Archives KPI Dashboard in Excel
Why Do Libraries and Archives Need a KPI Dashboard?
Libraries and archives manage vast collections, limited budgets, diverse user needs, and increasing digital demands. Therefore, they must track performance consistently and accurately.
Without a KPI dashboard, libraries face several challenges:
- Difficulty tracking usage trends
- Limited visibility into service efficiency
- Manual and time-consuming reporting
- Lack of data-driven decision-making
- Poor alignment with strategic goals
However, when libraries use a KPI Dashboard in Excel, they gain structure, clarity, and control. As a result, they improve service quality, optimize resources, and demonstrate value to stakeholders.
How Does a Libraries & Archives KPI Dashboard in Excel Work?
The dashboard works by combining structured data input sheets with automated calculations and visual summaries. First, users define KPIs and enter actual, target, and previous-year values. Then, Excel formulas calculate MTD (Month-to-Date) and YTD (Year-to-Date) performance. Finally, the dashboard presents insights through tables, indicators, and trend charts.
Because everything updates dynamically, users can change the selected month or KPI and instantly see updated results. Therefore, performance reviews become faster, clearer, and more reliable.
What Are the Key Features of the Libraries & Archives KPI Dashboard in Excel?
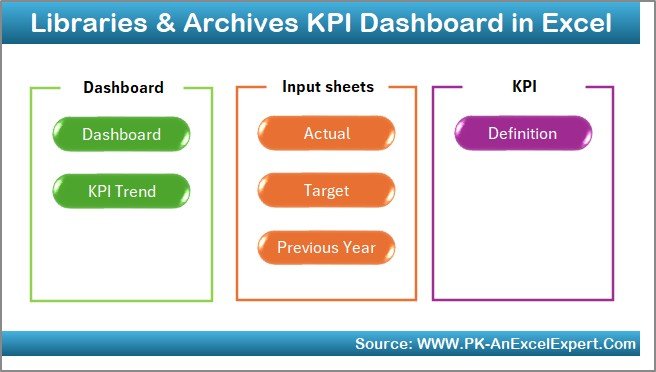
This KPI dashboard includes 7 well-structured worksheets, each designed for a specific purpose. Let us explore each sheet in detail.
Summary Page
The Summary Page acts as the index sheet of the dashboard.
On this sheet, you will find six navigation buttons that allow users to jump directly to other worksheets. As a result, users do not waste time searching for sheets. Instead, they move quickly across the dashboard.
Moreover, the Summary Page improves usability and ensures that even non-technical users can navigate the file easily.
Click to buy Libraries & Archives KPI Dashboard in Excel
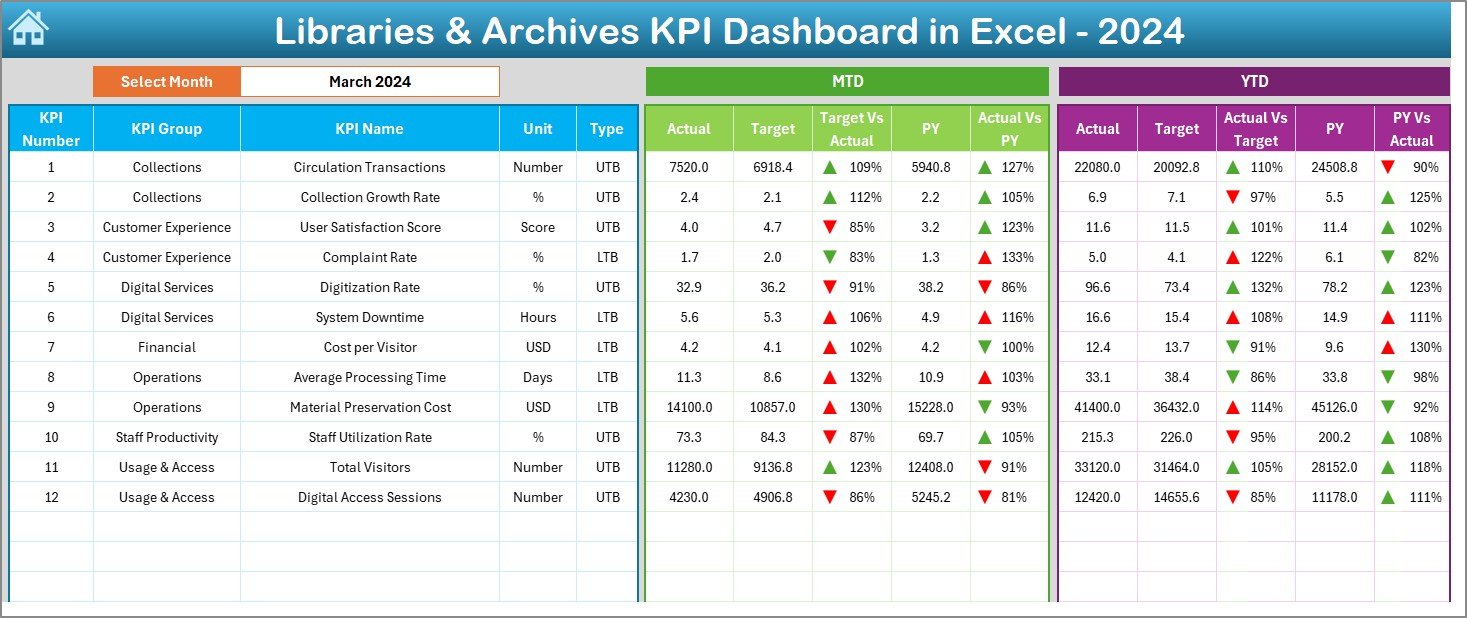
Dashboard Sheet
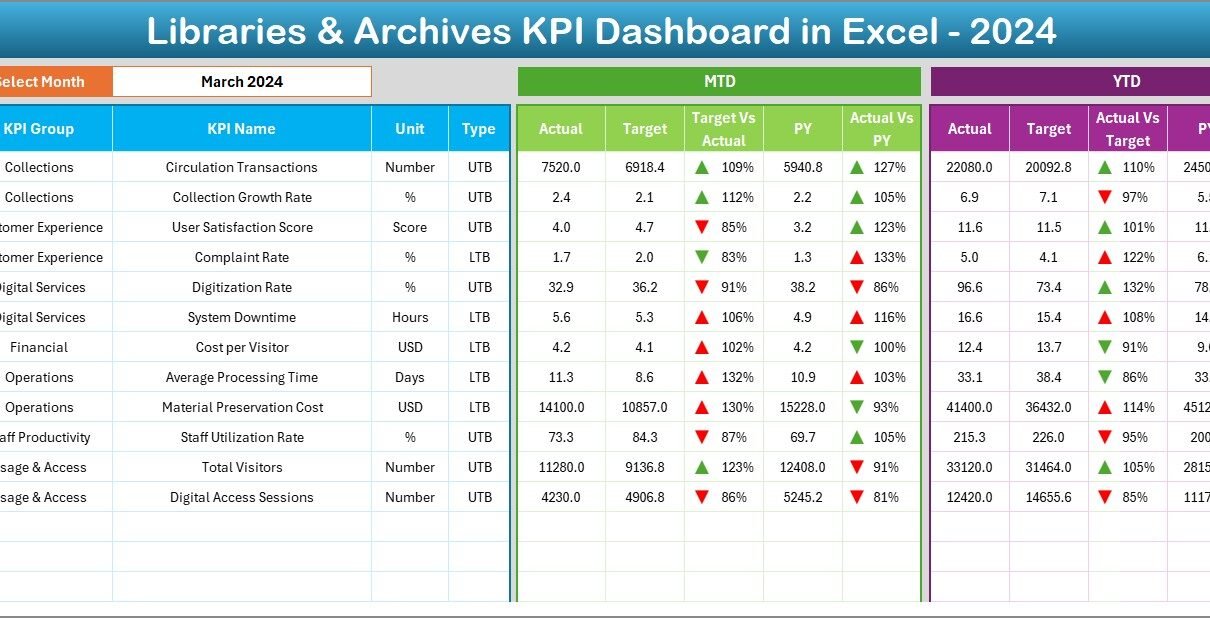
The Dashboard sheet serves as the main performance overview.
Here, the dashboard displays all KPI-related information in a structured and visual format. On cell D3, users can select the month from a drop-down list. Once selected, all dashboard values update automatically for that month.
This sheet shows:
- MTD Actual values
- MTD Target values
- MTD Previous Year values
- Target vs Actual variance
- Previous Year vs Actual variance
- YTD Actual values
- YTD Target values
- YTD Previous Year values
Additionally, conditional formatting with up and down arrows highlights performance trends. Therefore, users can instantly identify whether KPIs meet targets or need attention.
Click to buy Libraries & Archives KPI Dashboard in Excel
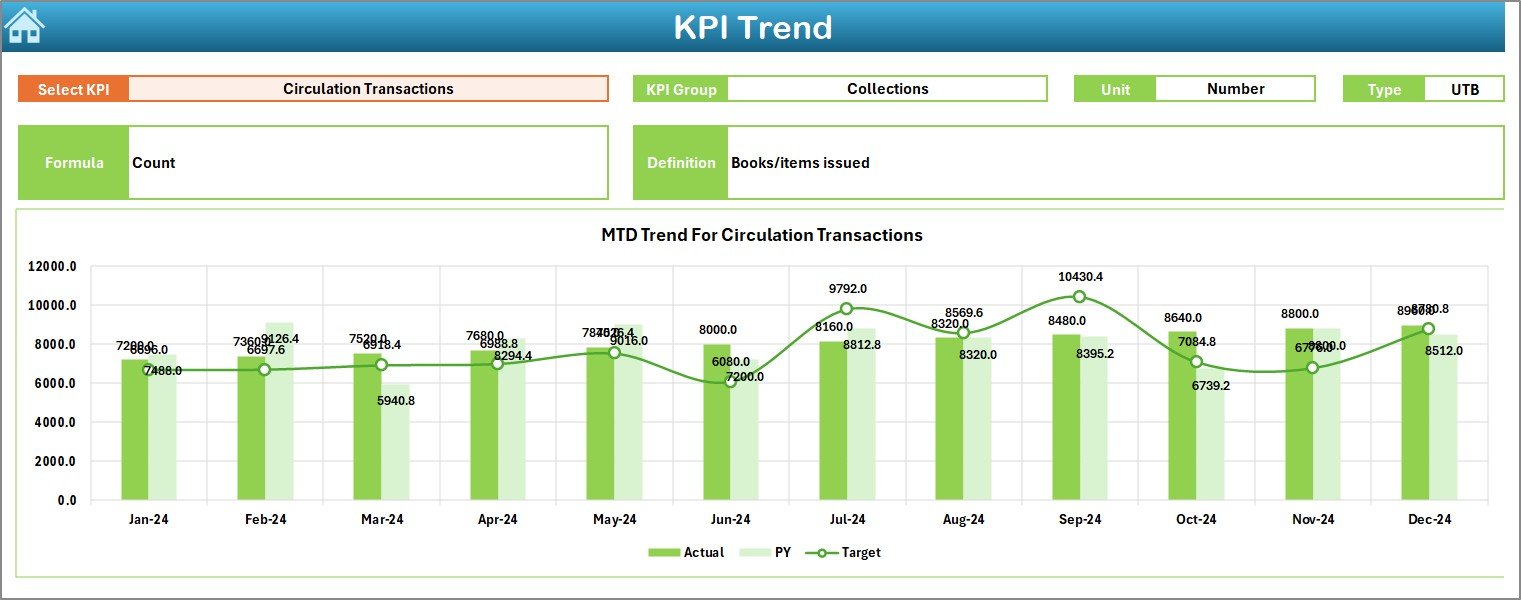
Trend Sheet
The Trend sheet focuses on detailed KPI-level analysis.
On cell C3, users can select a specific KPI from a drop-down list. Once selected, the sheet displays:
- KPI Group
- Unit of Measurement
- KPI Type (Lower the Better or Upper the Better)
- KPI Formula
- KPI Definition
In addition, the sheet shows MTD and YTD trend charts for Actual, Target, and Previous Year values. Consequently, users can analyze performance patterns over time rather than relying only on static numbers.
Click to buy Libraries & Archives KPI Dashboard in Excel
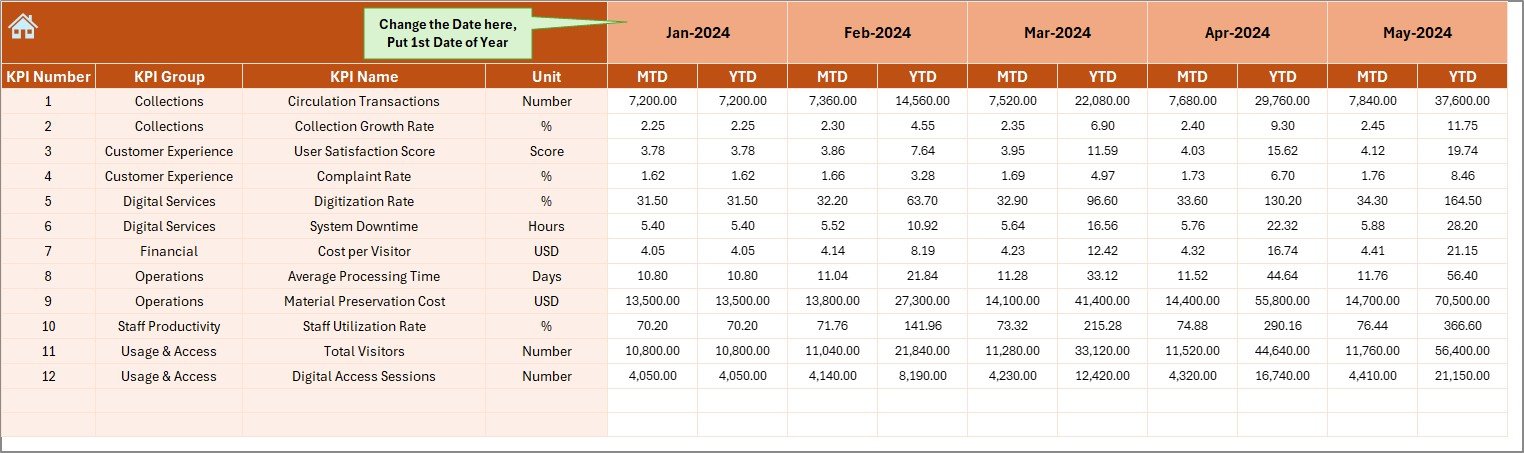
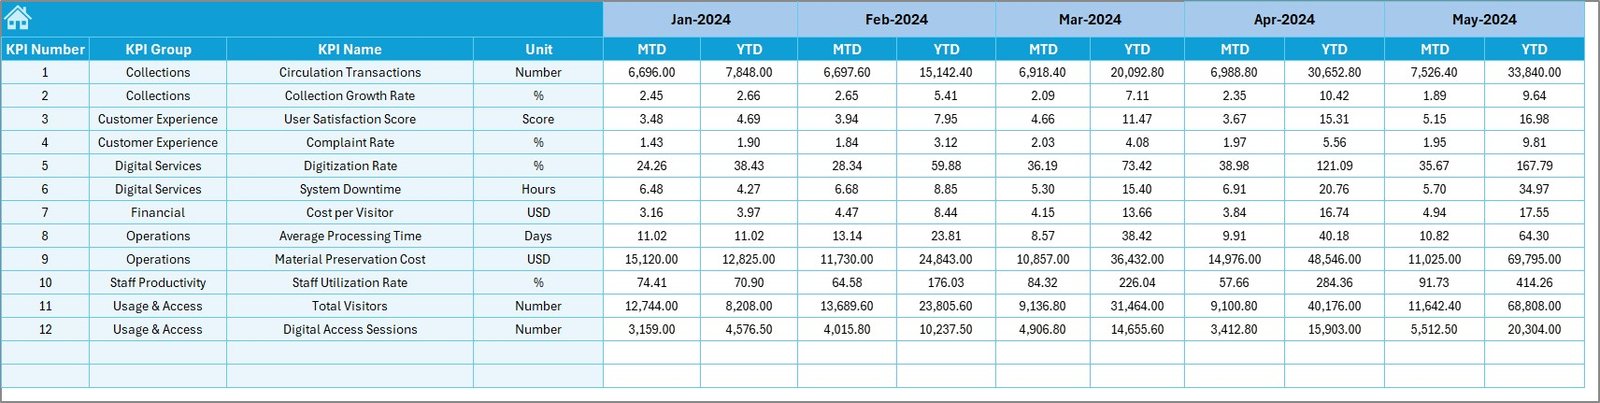
Actual Numbers Input
The Actual Numbers Input sheet allows users to enter real performance data.
On this sheet:
- Users enter MTD and YTD actual values
- Users can change the month from cell E1
- Users define the first month of the year in cell E1
Because the input structure remains simple, data entry becomes fast and error-free. Moreover, the dashboard automatically reflects these values without manual adjustments.
Click to buy Libraries & Archives KPI Dashboard in Excel
Target Sheet
The Target Sheet stores planned or expected performance values.
Here, users enter:
- Monthly targets (MTD)
- Year-to-date targets (YTD)
By defining targets clearly, libraries can compare actual performance against expectations. As a result, teams can identify gaps early and take corrective actions.
Click to buy Libraries & Archives KPI Dashboard in Excel
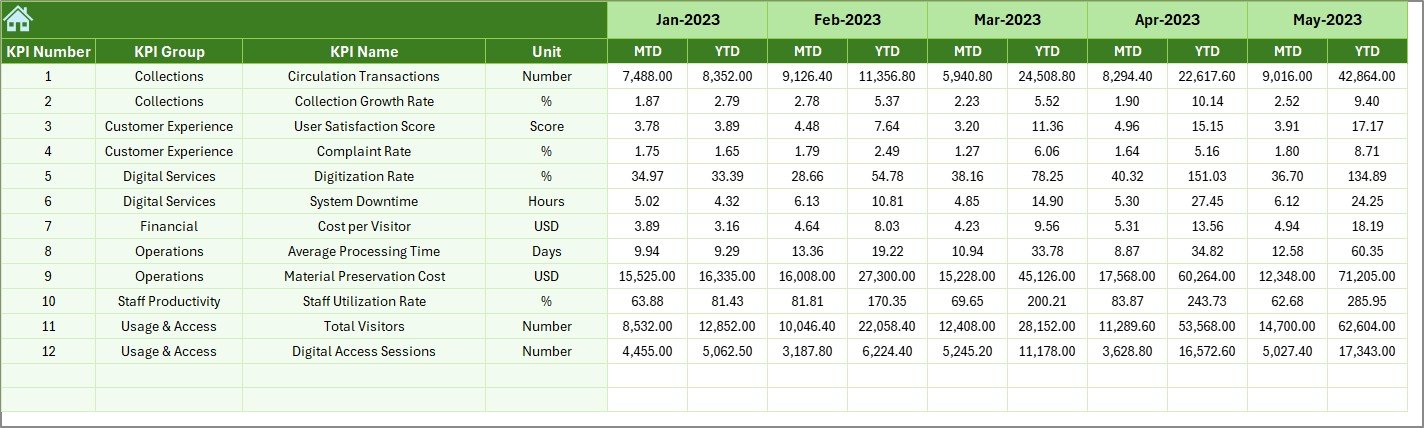
Previous Year Number
The Previous Year Number sheet captures historical data.
Users enter previous-year values using the same structure as current-year data. This setup allows easy comparison between current performance and historical trends.
Consequently, libraries can evaluate growth, decline, or stability across years.
Click to buy Libraries & Archives KPI Dashboard in Excel
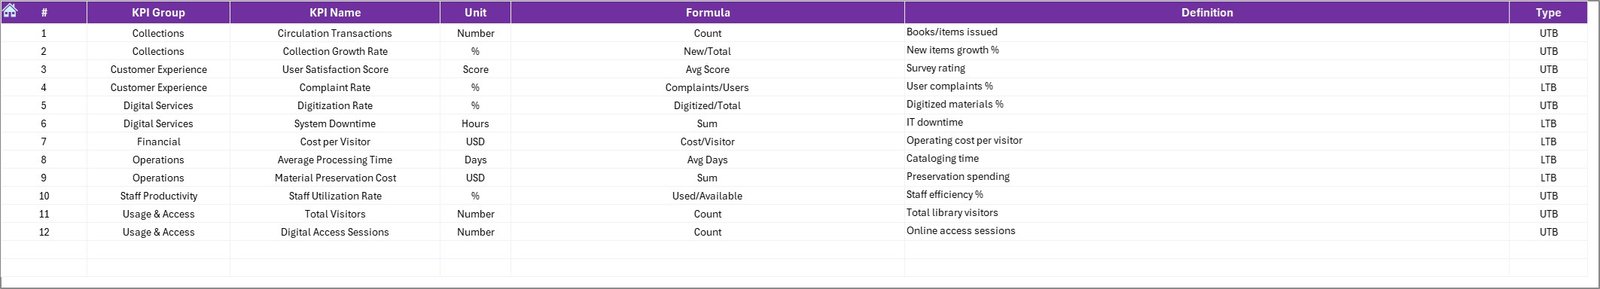
KPI Definition Sheet
The KPI Definition sheet acts as the foundation of the entire dashboard.
On this sheet, users define:
- KPI Name
- KPI Group
- Unit of Measurement
- KPI Formula
- KPI Definition
Because every KPI remains clearly defined, users avoid confusion and maintain consistency. Moreover, new team members can understand KPIs quickly without additional explanations.
Click to buy Libraries & Archives KPI Dashboard in Excel
What Are Common KPIs for Libraries & Archives?
Libraries and archives track a wide range of KPIs depending on their goals. Some commonly used KPIs include:
- Visitor Footfall
- Book Issuance Rate
- Digital Resource Usage
- Archive Access Requests
- Collection Growth Rate
- Preservation Completion Rate
- Staff Productivity
- User Satisfaction Score
- Cataloging Turnaround Time
- Budget Utilization
By tracking these KPIs, institutions gain a holistic view of performance.
Advantages of Libraries & Archives KPI Dashboard in Excel
Using a KPI Dashboard in Excel offers several powerful advantages.
- Centralized Performance Tracking
The dashboard consolidates all KPIs into one file. Therefore, teams avoid juggling multiple reports.
- Better Decision-Making
Clear visuals and comparisons help leadership make data-driven decisions quickly.
- Time-Saving Reporting
Automated calculations eliminate repetitive manual work. As a result, reporting becomes faster.
- Cost-Effective Solution
Excel-based dashboards do not require expensive BI tools. Hence, even small libraries can adopt them.
- Improved Transparency
Everyone sees the same data. Consequently, accountability and trust improve.
- Easy Customization
Users can easily add, remove, or modify KPIs based on institutional needs.
Who Can Benefit from a Libraries & Archives KPI Dashboard in Excel?
This dashboard benefits multiple stakeholders:
- Public Libraries
- Academic Libraries
- National Archives
- Museum Archives
- Research Institutions
- Government Information Centers
- Private and Corporate Libraries
Because Excel remains widely used, almost any institution can implement this dashboard with minimal training.
Best Practices for the Libraries & Archives KPI Dashboard in Excel
To get maximum value from the dashboard, follow these best practices.
- Define Clear KPIs
Always define KPIs with clear objectives and formulas. This practice ensures accuracy and relevance.
- Update Data Regularly
Update actual numbers monthly without delays. Regular updates maintain data reliability.
- Review Targets Periodically
Revisit targets based on changing goals, budgets, or user demand.
- Use Trend Analysis
Focus on trends rather than single-month values. Trends reveal long-term performance patterns.
- Train Team Members
Ensure staff understand how to input data and interpret results.
- Keep the Dashboard Simple
Avoid adding unnecessary KPIs. Simplicity improves usability and clarity.
How Does This Dashboard Support Strategic Planning?
A Libraries & Archives KPI Dashboard in Excel aligns daily operations with strategic goals.
Because leadership can monitor performance continuously, they can:
- Allocate budgets efficiently
- Improve service delivery
- Support digital transformation
- Demonstrate value to stakeholders
- Justify funding and investments
Therefore, the dashboard becomes more than a reporting tool—it becomes a strategic asset.
Conclusion
A Libraries & Archives KPI Dashboard in Excel provides a structured, practical, and powerful way to measure performance. By combining clear KPI definitions, automated calculations, and visual insights, this dashboard transforms raw data into actionable intelligence.
Moreover, because it runs on Excel, it remains accessible, flexible, and cost-effective. Whether you manage a small library or a large archival institution, this dashboard helps you track progress, improve services, and make confident decisions.
Frequently Asked Questions (FAQs)
- What is a Libraries & Archives KPI Dashboard in Excel?
A Libraries & Archives KPI Dashboard in Excel is a performance tracking tool that uses KPIs to measure library and archival operations in a structured and visual way.
- Do I need advanced Excel skills to use this dashboard?
No. Basic Excel knowledge is sufficient. The dashboard uses simple data entry and automated calculations.
- Can I customize KPIs in this dashboard?
Yes. You can add, modify, or remove KPIs easily based on your institution’s needs.
- How often should I update the dashboard?
You should update the dashboard monthly to maintain accurate MTD and YTD reporting.
- Is this dashboard suitable for digital libraries?
Yes. The dashboard works well for physical, digital, and hybrid libraries.
- Can multiple users work on this dashboard?
Yes. You can share the Excel file across teams, especially when using shared drives or cloud storage.
Visit our YouTube channel to learn step-by-step video tutorials
Watch the step-by-step video tutorial:
Click to buy Libraries & Archives KPI Dashboard in Excel