Skill development missions play a critical role in building a future-ready workforce. Governments, training institutions, and development agencies continuously invest in upskilling initiatives to improve employability, productivity, and economic growth. However, managing these large-scale programs without structured performance tracking often leads to delays, inefficiencies, and unclear outcomes.
That is exactly why a Skill Development Missions KPI Dashboard in Excel becomes an essential solution. This article explains everything you need to know about this dashboard—what it is, why it matters, how it works, its sheet-wise structure, key KPIs, advantages, best practices, and frequently asked questions. Moreover, the article uses simple language, strong transitions, and practical explanations to ensure clarity and SEO effectiveness.
Click to buy Skill Development Missions KPI Dashboard in Excel
What Is a Skill Development Missions KPI Dashboard in Excel?
A Skill Development Missions KPI Dashboard in Excel is a ready-to-use performance monitoring and reporting tool designed to track key metrics related to skill training programs, missions, and initiatives.
Instead of managing multiple spreadsheets for enrollments, certifications, placements, targets, and budgets, this dashboard consolidates all critical information into one structured Excel file. As a result, decision-makers gain instant visibility into mission performance.
Because the dashboard runs entirely in Excel, organizations can implement it quickly without investing in expensive BI tools. Furthermore, users can easily customize KPIs, targets, and definitions to match different missions or regions.
Why Do Skill Development Missions Need KPI Dashboards?
Skill development missions involve multiple stakeholders, training partners, regions, and beneficiaries. Therefore, manual tracking often causes data gaps and reporting delays. A KPI dashboard solves these challenges in a structured way.
Key reasons why KPI dashboards are essential:
- They centralize mission performance data
- They enable month-wise and year-to-date monitoring
- They support target vs actual comparisons
- They improve accountability across departments
- They help leadership make faster, data-driven decisions
Moreover, when teams track KPIs visually, they quickly identify bottlenecks and opportunities for improvement.
How Does a Skill Development Missions KPI Dashboard in Excel Work?
The dashboard works on a simple but powerful concept. Users input Actual, Target, and Previous Year data into structured sheets. Excel formulas then calculate variances, percentages, and trends automatically.
Because the dashboard uses a month selector, users can change the reporting month and instantly view updated MTD and YTD performance. Additionally, conditional formatting arrows highlight whether performance improved or declined.
As a result, stakeholders move from reactive reporting to proactive performance management.
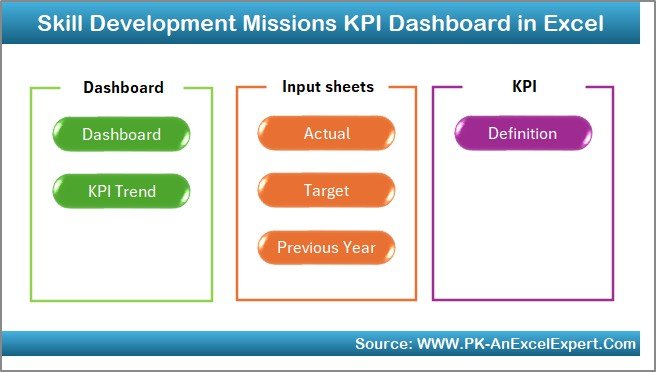
Sheet-Wise Structure of Skill Development Missions KPI Dashboard in Excel
One of the biggest strengths of this dashboard lies in its clear and logical sheet structure. Each worksheet serves a specific purpose and supports accurate reporting.
Summary Page (Index Sheet)
The Summary Page acts as the navigation hub of the dashboard.
Key highlights:
- Clean index layout
- Six navigation buttons
- One-click access to all sheets
- User-friendly design for non-technical users
Because of this structure, even first-time users can navigate the dashboard easily.
Click to buy Skill Development Missions KPI Dashboard in Excel
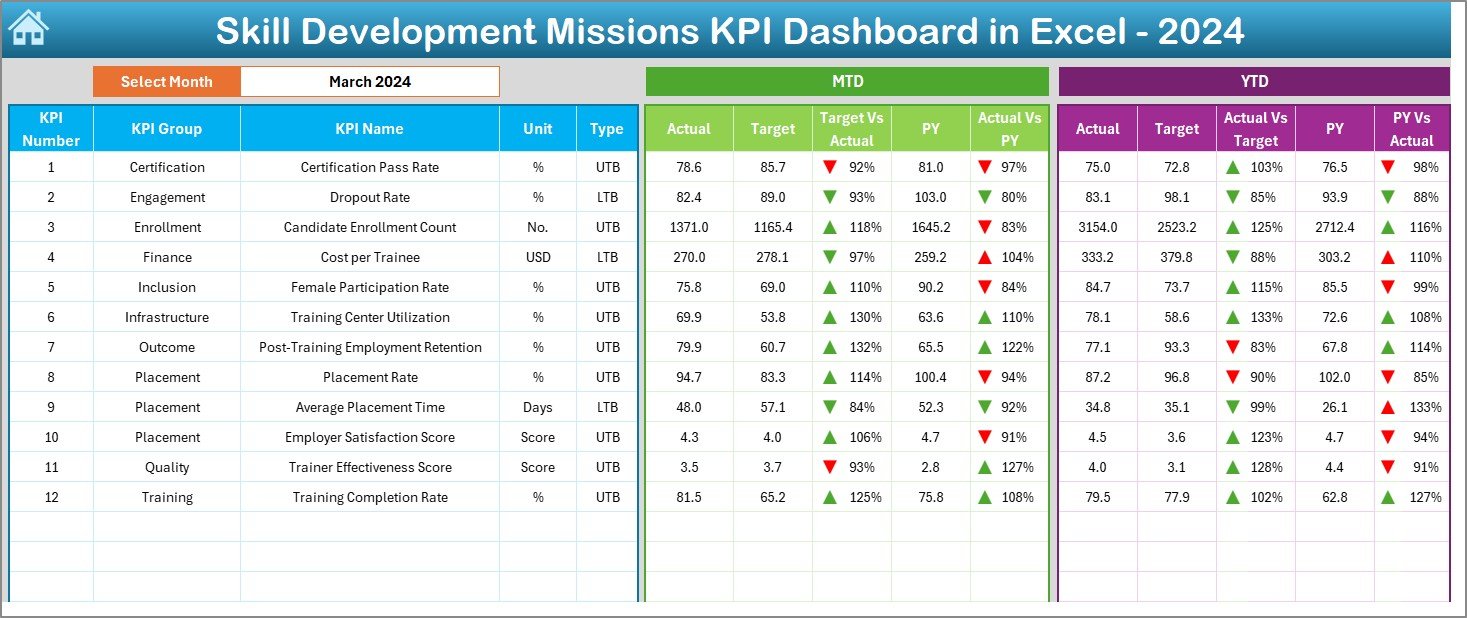
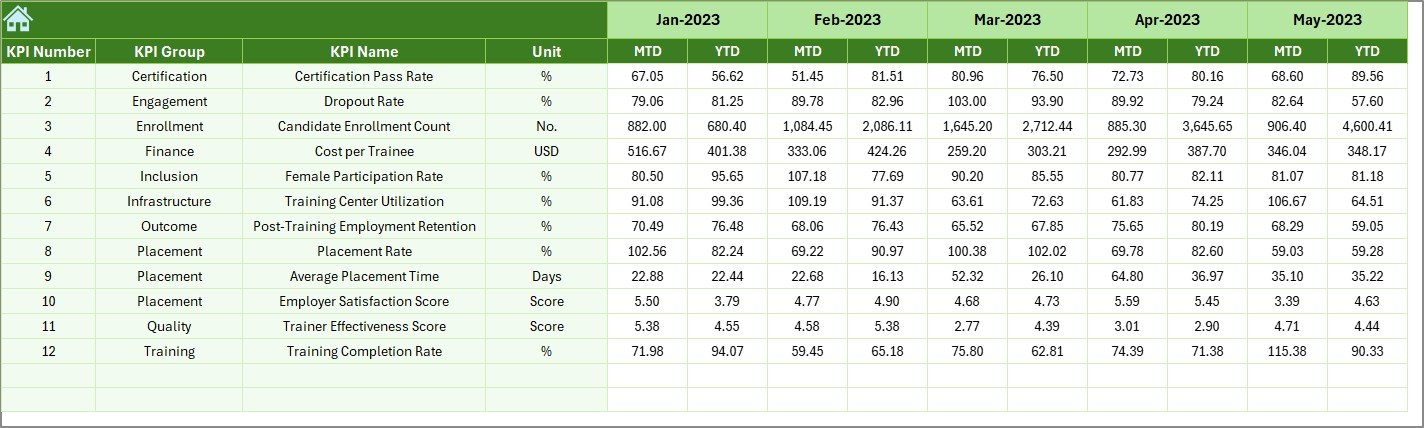
Dashboard Sheet Tab
The Dashboard Sheet is the core reporting page where all KPI performance appears.
Key features:
- Month selection drop-down on cell D3
- Automatic update of all metrics based on selected month
- Display of MTD Actual, Target, and Previous Year values
- Display of YTD Actual, Target, and Previous Year values
- Target vs Actual and PY vs Actual variance
- Conditional formatting arrows for quick performance insights
Therefore, leadership teams can instantly understand mission progress without reading long reports.
Click to buy Skill Development Missions KPI Dashboard in Excel
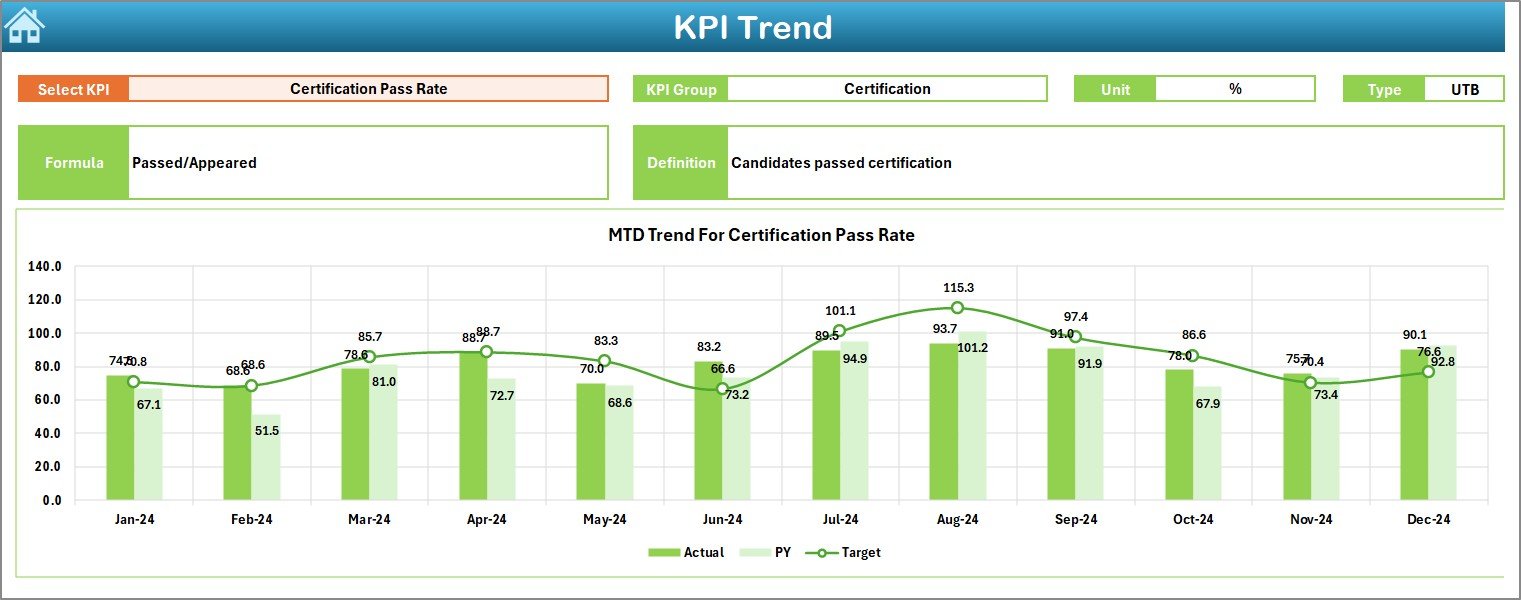
KPI Trend Sheet Tab
The Trend Sheet focuses on detailed KPI-level analysis.
What you can do here:
- Select KPI name from drop-down at C3
- View KPI Group and Unit of measurement
- Identify KPI type (Upper the Better or Lower the Better)
- Review KPI formula and definition
- Analyze MTD and YTD trend charts for Actual, Target, and PY
Because trend charts show movement over time, teams can forecast performance and adjust strategies early.
Click to buy Skill Development Missions KPI Dashboard in Excel
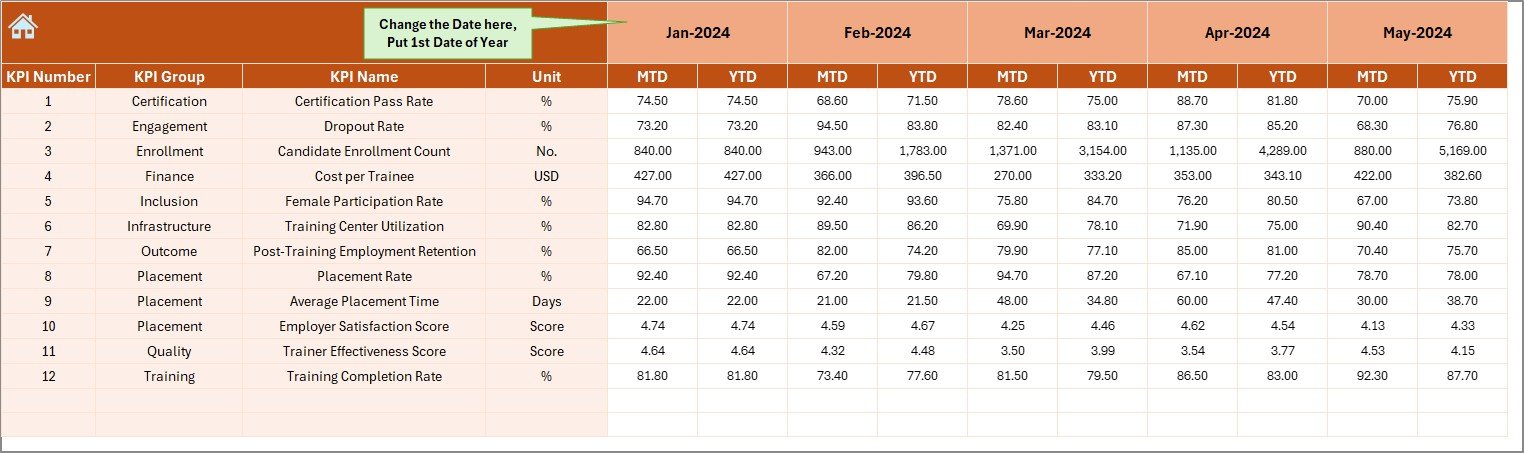
Actual Numbers Input Sheet
The Actual Numbers Input Sheet captures real performance data.
How it works:
- Enter actual MTD and YTD values
- Change the reporting month using E1
- Set the first month of the year in E1
- Keep data entry structured and consistent
As a result, the dashboard calculations remain accurate and reliable.
Click to buy Skill Development Missions KPI Dashboard in Excel
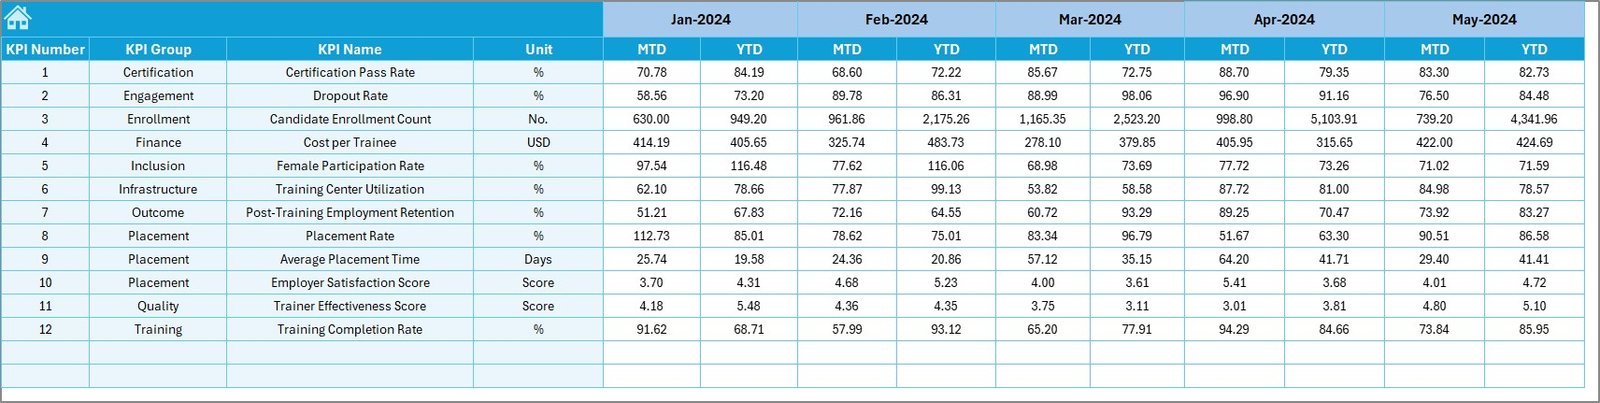
Target Sheet Tab
The Target Sheet defines expected performance.
Key inputs:
- Monthly MTD targets for each KPI
- YTD targets for long-term tracking
- Alignment with mission objectives
Because targets drive accountability, this sheet plays a critical role in performance evaluation.
Click to buy Skill Development Missions KPI Dashboard in Excel
Previous Year Number Sheet Tab
The Previous Year Sheet enables year-over-year comparisons.
Why it matters:
- Tracks historical performance
- Highlights long-term improvement or decline
- Supports strategic planning and benchmarking
Therefore, organizations can assess whether mission outcomes improve year after year.
Click to buy Skill Development Missions KPI Dashboard in Excel
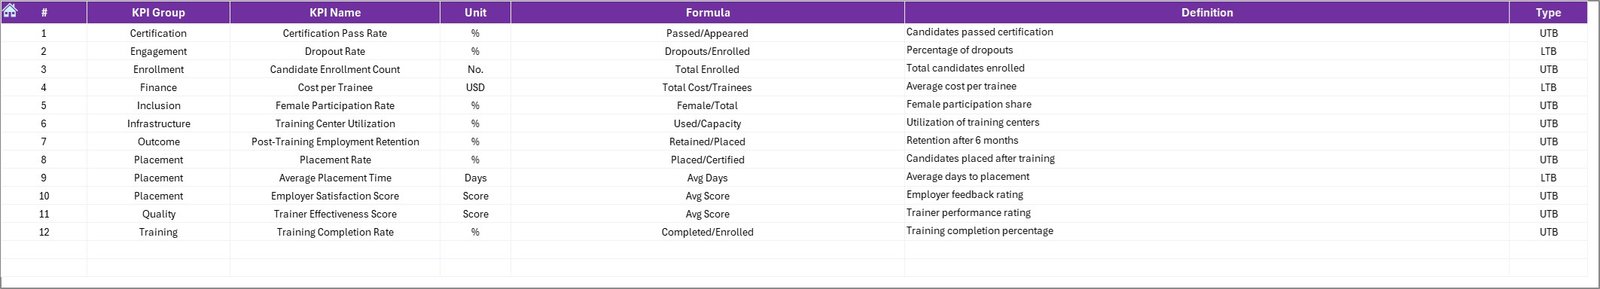
KPI Definition Sheet Tab
The KPI Definition Sheet ensures clarity and consistency.
Fields included:
- KPI Name
- KPI Group
- Unit of Measurement
- Formula
- KPI Definition
Because everyone refers to the same definitions, reporting errors and confusion reduce significantly.
Click to buy Skill Development Missions KPI Dashboard in Excel
What Are the Key KPIs for Skill Development Missions?
KPIs may vary depending on mission goals. However, most skill development programs track similar performance indicators.
Common KPIs include:
- Number of candidates enrolled
- Number of candidates trained
- Certification completion rate
- Placement rate after training
- Average training cost per candidate
- Trainer utilization rate
- Course completion time
- Gender participation ratio
- Regional coverage metrics
- Employer satisfaction score
When organizations track these KPIs consistently, they improve mission outcomes and transparency.
Advantages of Skill Development Missions KPI Dashboard in Excel
- Centralized Performance Tracking
The dashboard consolidates data from multiple programs and regions into one file. As a result, teams avoid scattered spreadsheets.
- Faster Decision-Making
Because metrics update instantly, leaders respond quickly to underperformance or delays.
- Clear Target Monitoring
Target vs Actual comparisons make accountability visible. Therefore, teams stay aligned with mission goals.
- Historical Performance Analysis
Previous year data supports trend analysis and long-term planning.
- No Additional Software Required
Since the dashboard runs in Excel, organizations avoid extra licensing costs.
- Easy Customization
Users can modify KPIs, targets, and formulas without technical complexity.
Opportunities for Improvement in Skill Development KPI Dashboards
Although Excel dashboards offer strong capabilities, continuous improvement ensures better results.
Areas to enhance:
- Data validation rules for error prevention
- Automated data imports from source systems
- Role-based access for data entry and review
- Integration with Power BI for advanced analytics
- Standardized reporting templates across missions
By improving these areas, organizations strengthen data quality and scalability.
Best Practices for the Skill Development Missions KPI Dashboard in Excel
- Define KPIs Clearly
Always document KPI formulas and definitions in the KPI Definition sheet. This practice avoids confusion.
- Maintain Data Consistency
Use standardized formats for dates, numbers, and units across all sheets.
- Update Data Regularly
Monthly updates keep MTD and YTD performance accurate and relevant.
- Review Trends, Not Just Numbers
Trend charts reveal patterns that raw numbers cannot show.
- Align KPIs with Mission Objectives
Only track metrics that directly support mission goals and outcomes.
- Train Users on Dashboard Usage
A short training session improves adoption and data accuracy.
How Does This Dashboard Support Government and Institutional Missions?
Skill development missions often operate at scale. Therefore, monitoring thousands of candidates and multiple partners becomes challenging. This dashboard simplifies that complexity.
It helps government departments:
- Track performance across regions
- Monitor partner efficiency
- Report outcomes to stakeholders
- Ensure transparency and accountability
Similarly, training institutions use it to optimize resource utilization and improve placement outcomes.
Why Choose Excel for Skill Development KPI Dashboards?
Excel remains one of the most widely used business tools. Because of its flexibility and familiarity, teams adopt Excel dashboards quickly.
Moreover:
- Excel supports formulas, charts, and conditional formatting
- Users can audit calculations easily
- Files remain portable and shareable
- Organizations avoid IT dependency
Therefore, Excel continues to be a practical choice for KPI dashboards.
Conclusion
A Skill Development Missions KPI Dashboard in Excel transforms how organizations track, analyze, and improve training initiatives. Instead of relying on fragmented reports, teams gain a centralized, visual, and data-driven view of mission performance.
With structured worksheets, automated calculations, trend analysis, and clear KPI definitions, this dashboard supports transparency, accountability, and strategic decision-making. Moreover, because it runs entirely in Excel, organizations implement it quickly and cost-effectively.
When skill development missions rely on accurate KPIs, they deliver stronger outcomes and build a future-ready workforce.
Frequently Asked Questions (FAQs)
What is the main purpose of a Skill Development KPI Dashboard in Excel?
The main purpose is to track, monitor, and analyze performance metrics related to skill training programs in a centralized and visual format.
Who can use this KPI dashboard?
Government departments, training institutions, NGOs, and skill mission administrators can use this dashboard effectively.
Does the dashboard support monthly and yearly tracking?
Yes, the dashboard supports both MTD (Month-to-Date) and YTD (Year-to-Date) tracking.
Can users customize KPIs in the dashboard?
Yes, users can easily add, remove, or modify KPIs using the KPI Definition sheet.
Does this dashboard require advanced Excel knowledge?
No, basic Excel knowledge is enough to operate and maintain the dashboard.
Can this dashboard handle multiple regions or programs?
Yes, users can design KPIs to represent different regions, programs, or training partners.
How does the dashboard compare current performance with previous years?
The Previous Year sheet enables year-over-year comparisons for all KPIs.
Is this dashboard suitable for large-scale missions?
Yes, the structured design supports both small programs and large government missions.
Visit our YouTube channel to learn step-by-step video tutorials
Watch the step-by-step video tutorial:
Click to buy Skill Development Missions KPI Dashboard in Excel